

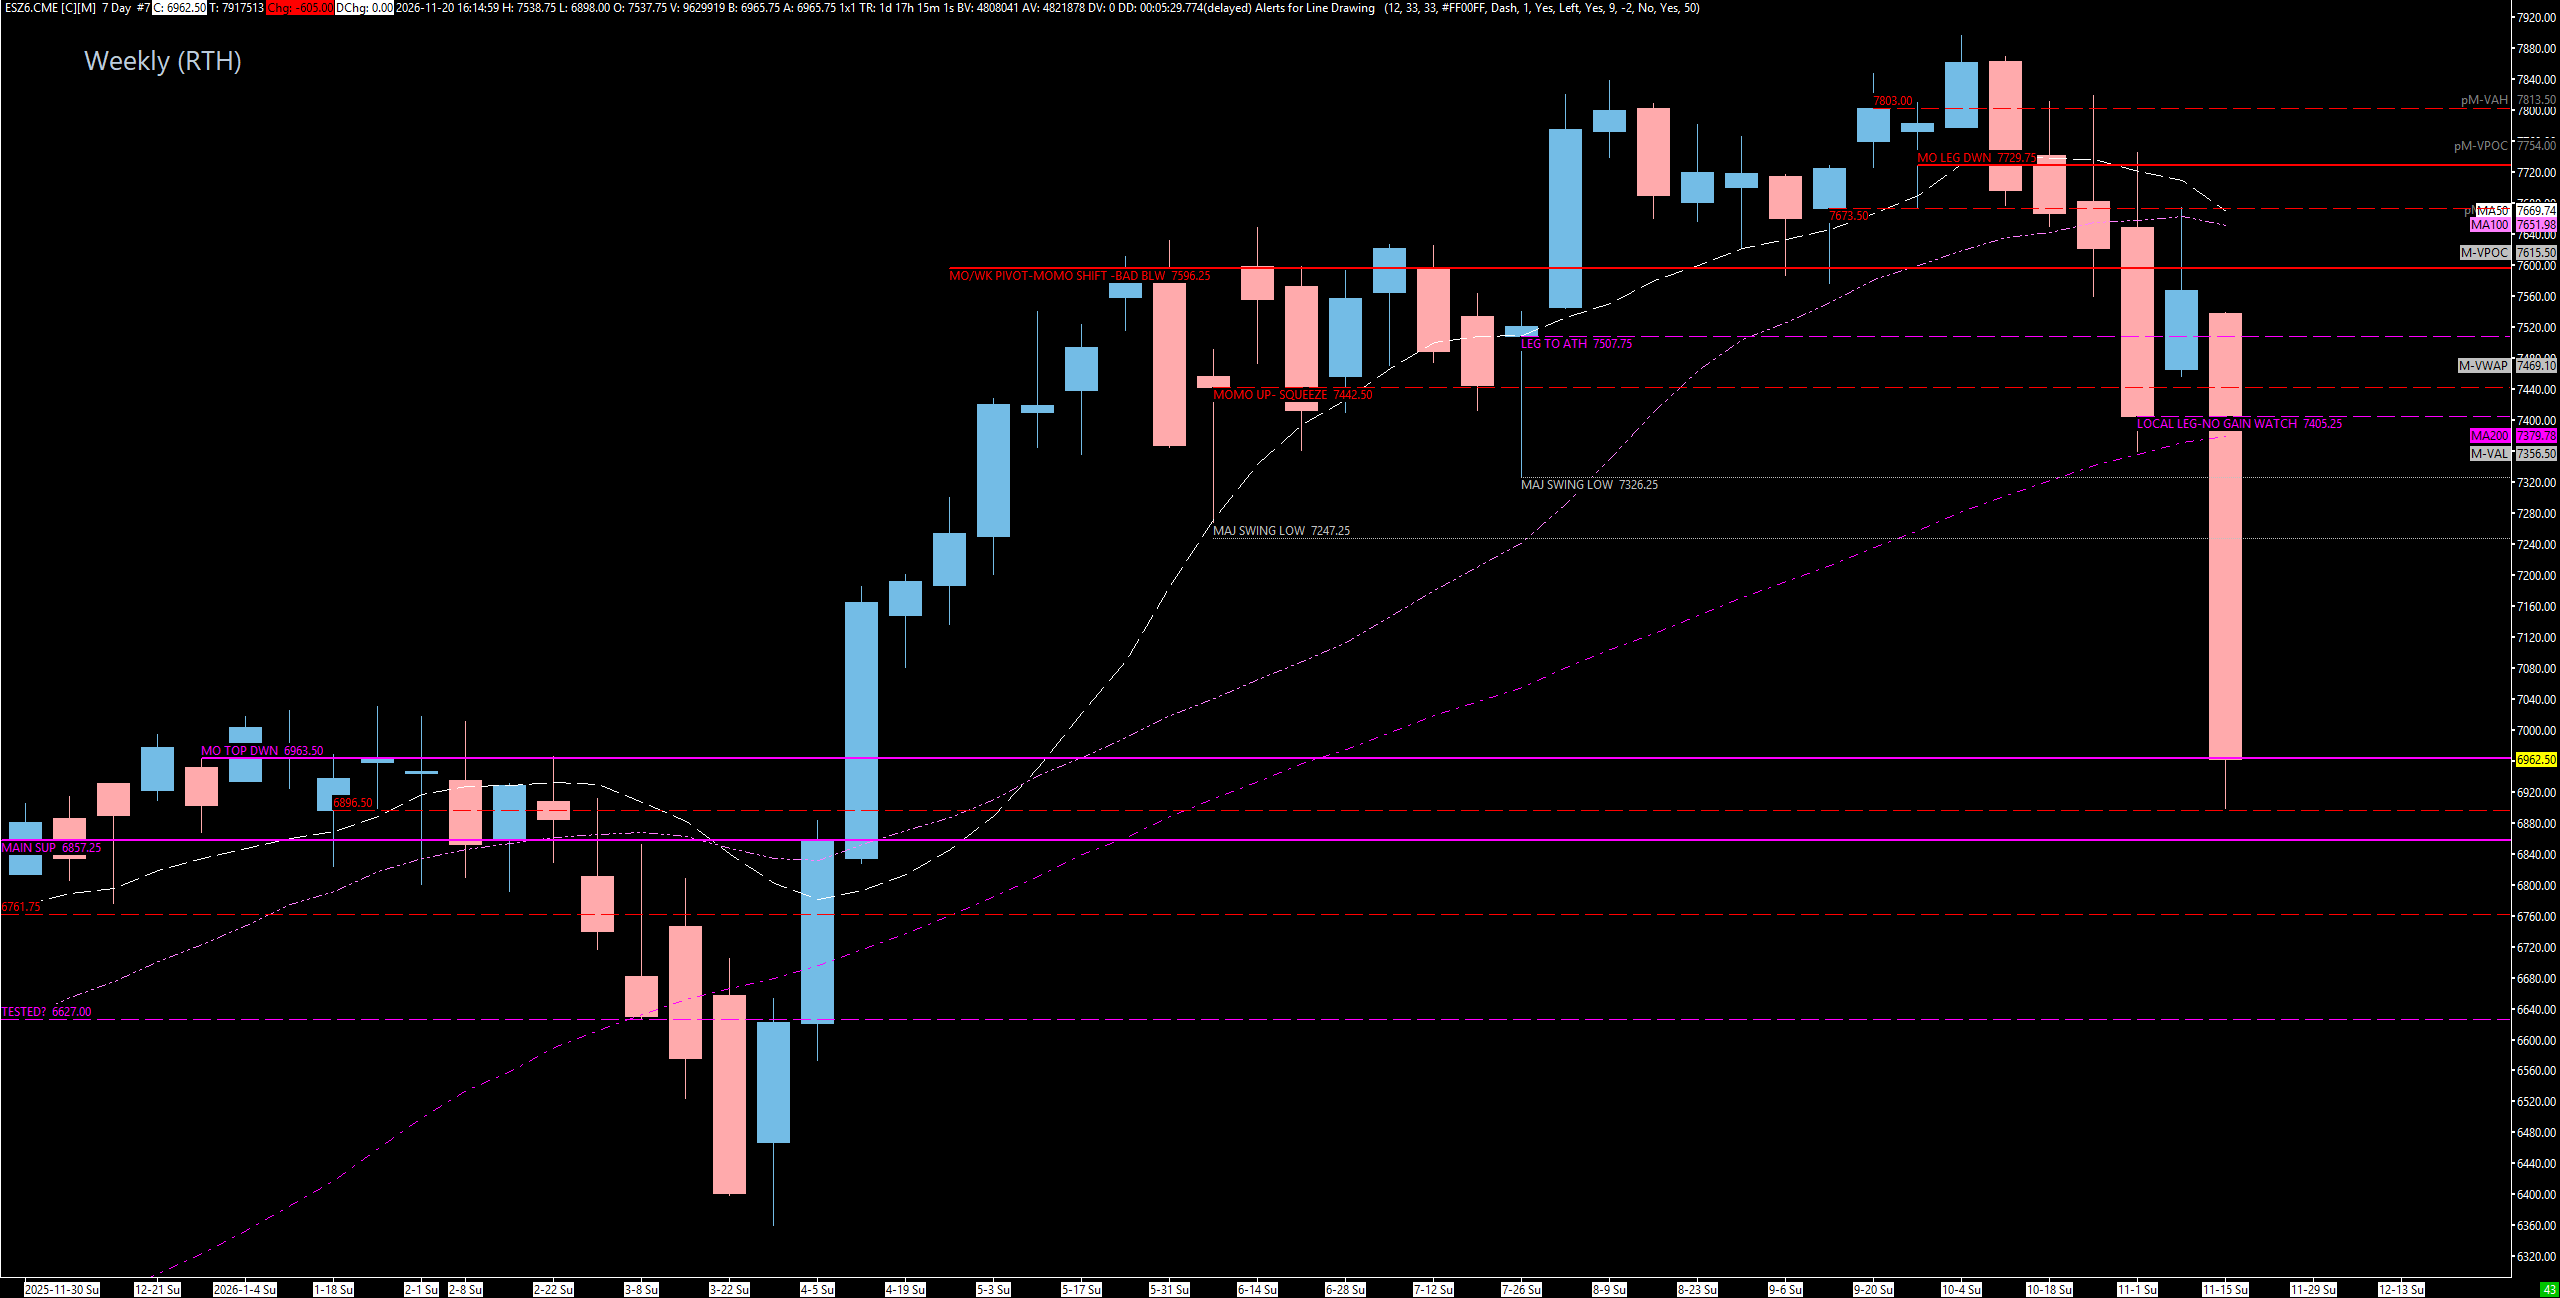
Welcome back, everyone — it is time for the Weekend Review, and what a phenomenal week we had. We have been leaning hardcore to the bearish side, and we finally got all of our high-timeframe targets. I was calling for 7247 last week, and the big high-timeframe target I kept pointing to said we would end up somewhere between 7000 and 6850. We came down and played the 6900 weekly almost to the tick on ES. Absolutely unbelievable stuff. We had the short call from 7673 all the way down to 6900 — well over 700 points — and I have been calling this market a potential bear-market short since 7803. This is not a surprise to us. My process has been pointing us down for quite some time.
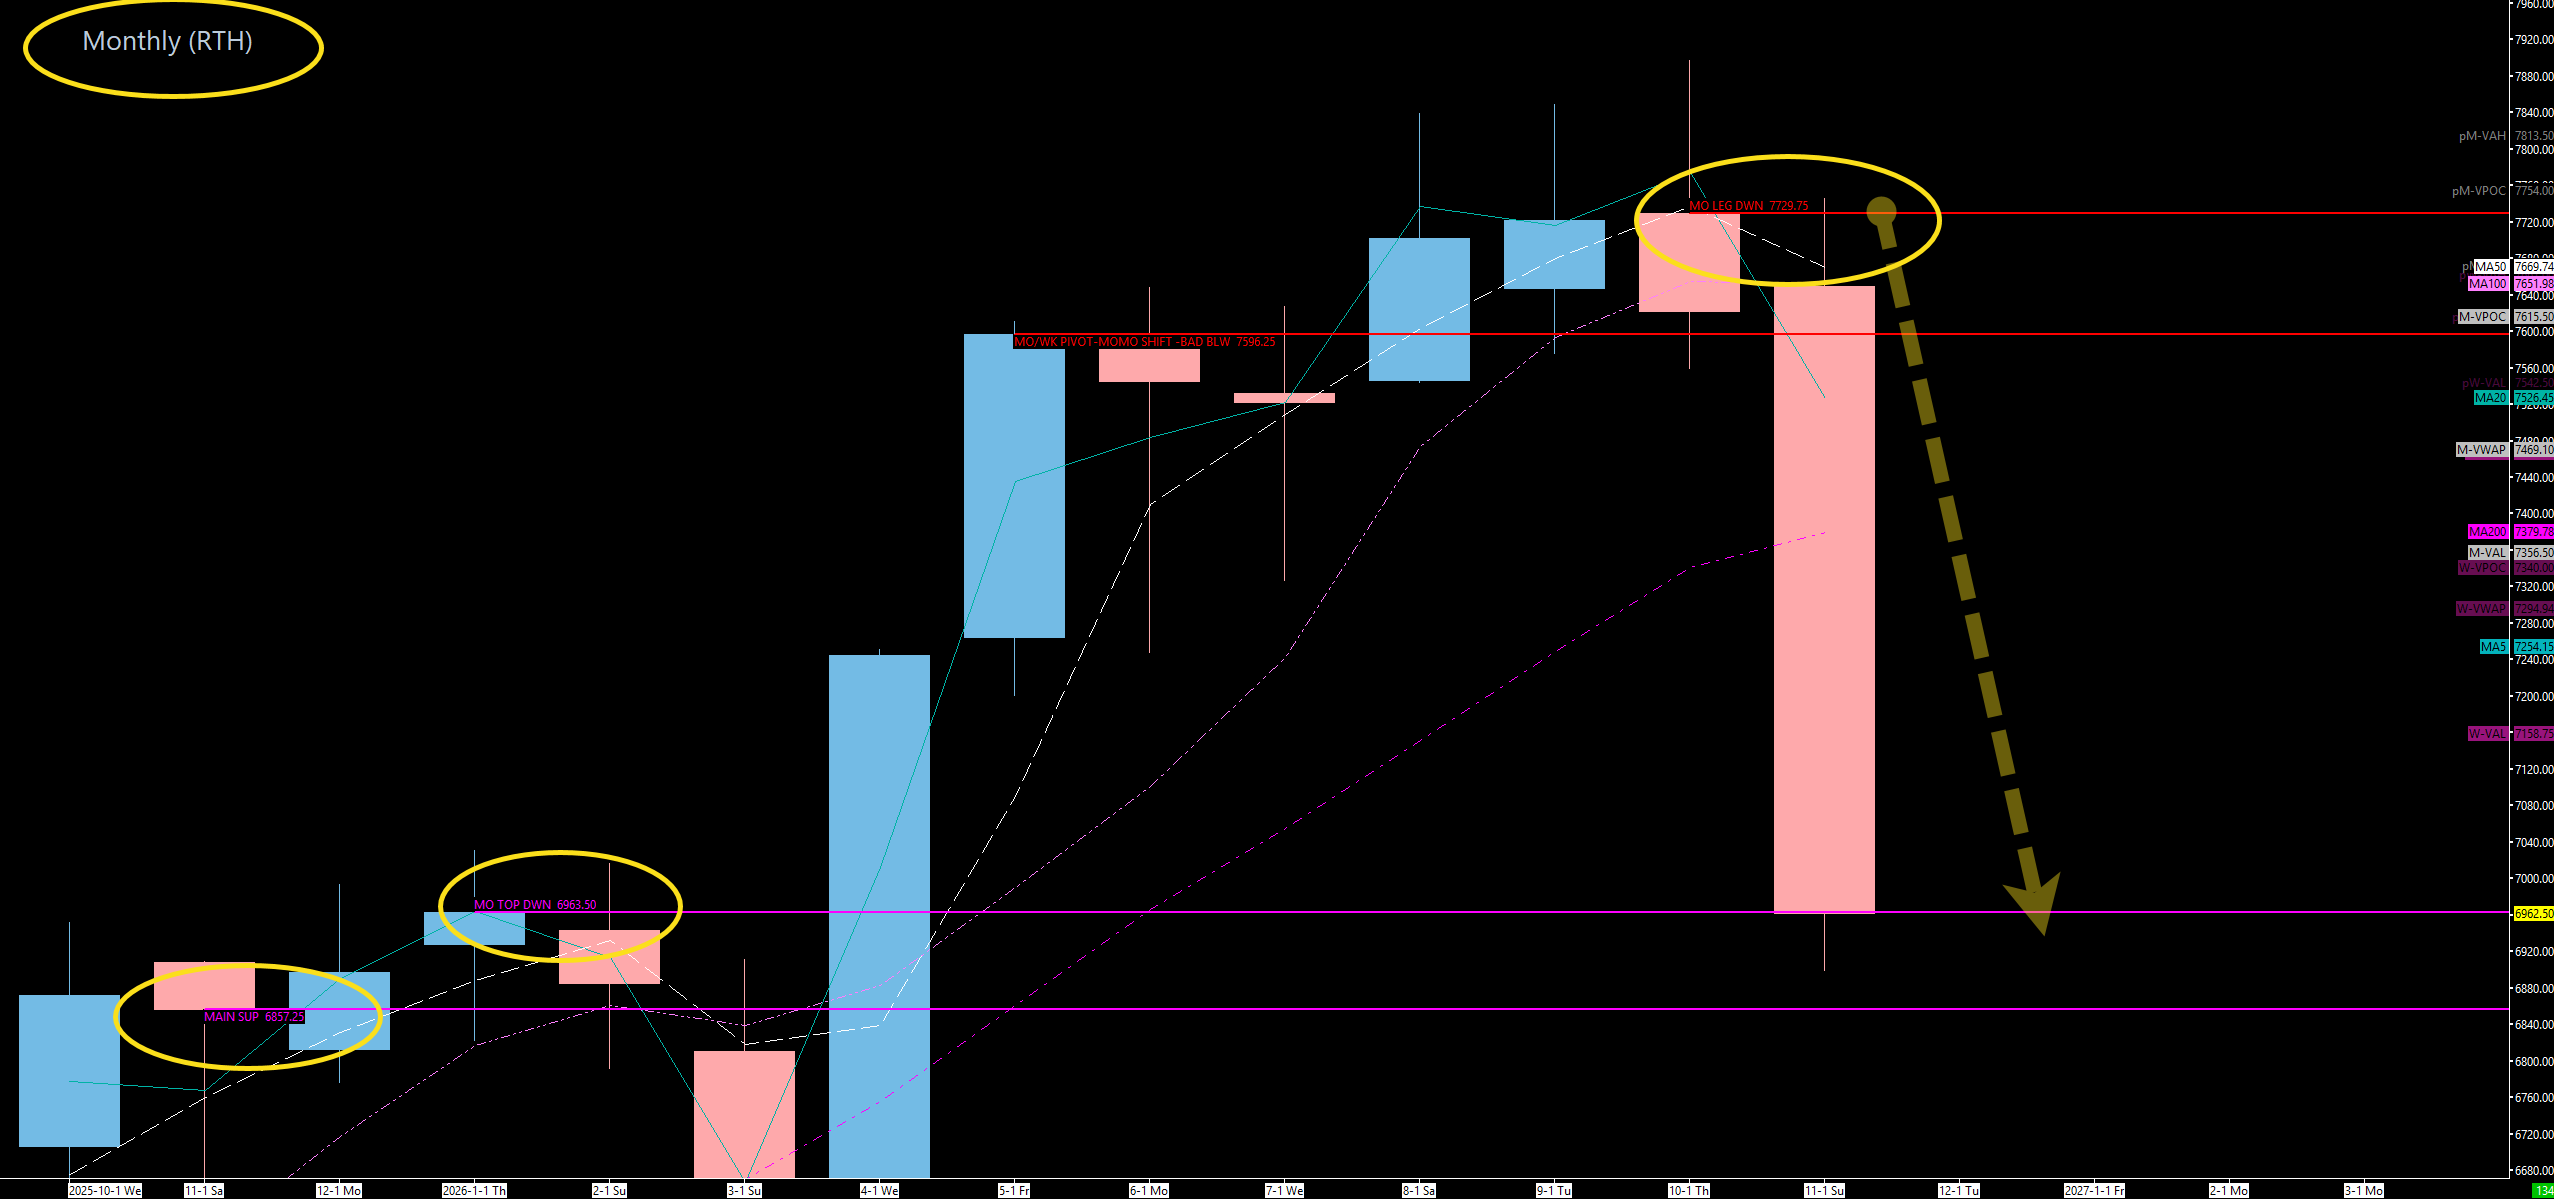
Now that we have hit all of our big targets, it is time to start looking for something else: a bounce, at least momentarily. I am not saying that is what happens, but I am looking across a lot of assets and putting these things together — and VIX flashed a big sign on Friday by closing up well over 26% on the day, which gives us a phenomenal indication that we might have a buy coming. Today we are covering VIX, gold, Bitcoin, SPY, SPX, and ES, because all of this stuff is correlated right now.
📧 Check Your Spam Folder Follow-ups and SPX Brief emails are landing in spam. Look for rbailey@vicitradingsolutions.com and info@vicitradingsolutions.com, mark them “Not Spam,” and add them to your contacts so you keep getting them.
☕ FREE — The New & Improved SPX Morning Brief SPX value levels, 150+ indicator prediction assessments, and the day’s top news — in your inbox before the bell. Completely rebuilt and completely free. Seats are limited and they fill up fast. Get your seat now → https://go.vicitradingsolutions.com/spx-brief
A Note on This Week’s Market:
News — Liquidity Crisis & The Midterm Cycle: This is what’s called a liquidity crisis. Gold, silver, and crypto are all selling off at the same time — there is no hedge and no diversification that is safe, and people are rushing to raise cash. I saw this in 2008 and again during COVID. I wrote my first midterm article on March 15th, laying out roughly a 76% chance of a bear market toward the end of the year and a 70% chance of a meaningful pullback of 10% or more — and we saw that in one week. I followed up in April and again on October 28th, right before the fall. But don’t panic: even though the average maximum drawdown is about 18%, the year tends to end within about 1% either way. This is a reactionary pullback. No specific calendar events were called out for this week.
The 30-Year Market Pattern Nobody Wants to Talk About Right Now
·
If you’ve been trading long enough, you develop a healthy respect for patterns. Not because the market is scripted — it’s not — but because human behavior tends to repeat, especially when the same catalysts show up on a predictable schedule.
Data — The VIX Friday Report: People keep asking, “Ryan, do you think we gap up or gap down?” I have done two posts on this — one on what happens when VIX closes up over 20% on any day, and one specifically on what happens to the S&P 500 after VIX closes up over 20% on a Friday, which is exactly what we just got. History says we should gap up on Monday, and there has been a very solid opportunity to get long after that kind of Friday close. It is not foolproof — Brexit was one of the exceptions — and the path is always a different story. History rhymes, which is why it is a probability and not a sure thing. We could have plenty of volatility tonight, but this revolves around the cash session.
Range: We did 640 points on the week — about 338% of our expected weekly range. That is absolutely obscene, and I have not seen one that big in a long time. If you are kicking yourself for not holding your runner, I agree, I should have too — but when is the last time we got 300-point days consistently? Don’t beat yourself up.
Volatility: VIX soared well above our $35 weekly — my final target — and actually touched $40. In doing so, VIX gained on the weekly for the first time in a very, very long time, which means it could come higher if it pulls back into some areas first.
S&P 500 Midterm Returns: 21 for 21 Since 1942 — Dips Included
·
Midterm season brings a predictable kind of noise. The headlines get louder, the predictions get more partisan, and traders start positioning around who might take the House or the Senate — as if that outcome decides where the S&P 500 goes next.
Trend: We are still pointed down on all timeframes — ES, SPX, and SPY. My process still points to more downside, and I will respect that by playing untested levels for shorts. But I am no longer aggressively looking for shorts. We are sitting in a massive monthly, weekly, and 10-week support area after a 600-point week down, so some mean reversion makes sense. That does not mean it has to happen — a true liquidity break could flush another 10%.


🧠 Current Market Context
Every High-Timeframe Target Hit — Now We Watch For The Pop
When I put something out on X or Substack, pay attention to it. I am not a social media guy — I do not post selfies or post for the sake of posting. If it is out there, it is because it is valuable. On October 26th, I put out a tweet saying 93% of traders do not make it a year, and very few make it 10. I have been trading since 2003, and I have traded every bear market of my generation — 2008, 2020, and 2022. A lot of the furus and Substackers out there have been trading less than a year, and even the ones with five years have never really seen a bear market. After COVID, everybody was a genius, because all we did was go up and everybody was day trading their free money. That ended last week. Volatility is up, and the market is moving both ways. I have had some really sad calls from non-followers who lost their shirts, because everyone was pointed up — that was the default, until it wasn’t. I feel for those people, and I am really glad we have a team that pays attention and trusts the process.
Bitcoin Leads — And It Is Setting Up A Short
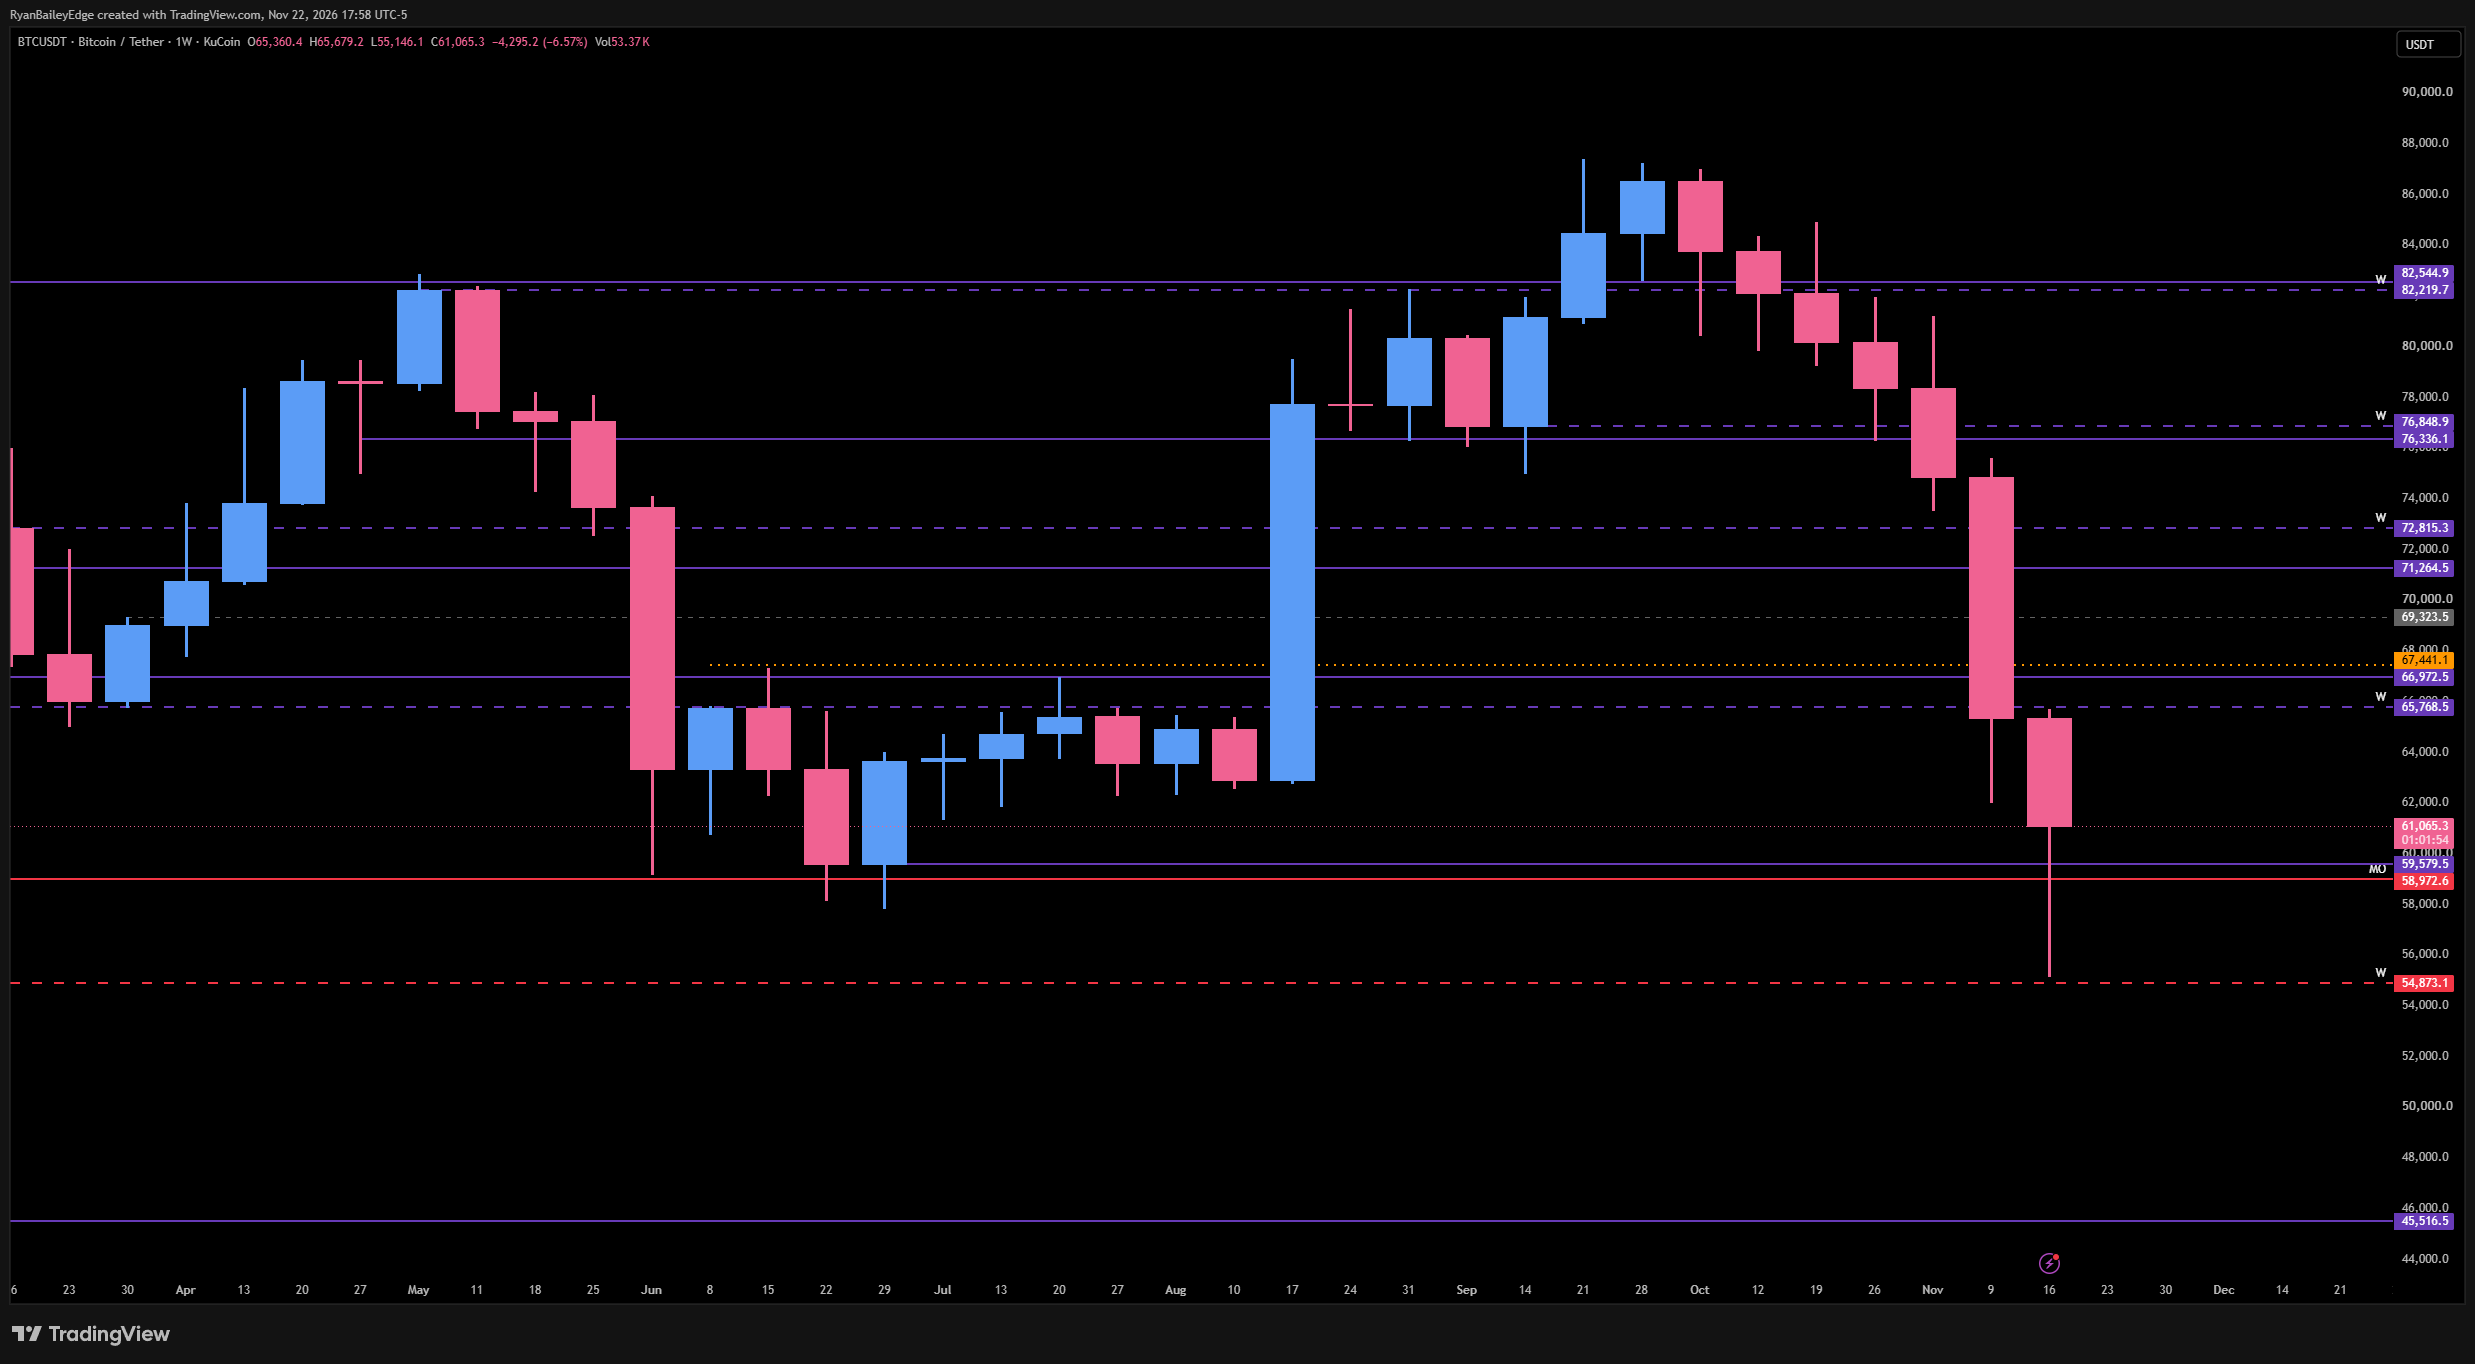
I have been aggressively talking about Bitcoin coming down to $35,000 for most of the last quarter, and I used it as the example in our Weekend Review two weeks ago: Bitcoin is leading ES. I believe it is coming down into the $45,000 handle, if not $35,000 or $30,000 — my model shows that as a real possibility. This week, Bitcoin had an amazing sweep underneath our leg to the high, played the weekly to perfection, and is now back above a significant monthly and a significant leg. It would not surprise me to get a pop. Bitcoin has been up for two days and is maintaining the hold — and when Bitcoin is opening strong on a Sunday, ES more than likely opens strong too, especially with ES sitting in significant support. Here is the trade I am looking for: a pop into $65,750 through the $66,972 monthly — and I really do not want to see it go any higher than $67,441. It is the same setup we had on Friday with ES: pop up, get above the wick, play this area, and get back below — and it comes screaming down, because it will have tested the monthly level on the weekly timeframe. My first target is $45,516 — a massive $20,000 short. Call the above/below the $67,000 area: get back below $65,750, and it comes crushing down. Bitcoin is still pointed down on all timeframes. And remember the correlation: Bitcoin is a high-risk asset, and in a liquidity crisis it is the first thing that gets sold — so if Bitcoin pops, the indices may pop too.
Gold — Buying The Liquidity Flush
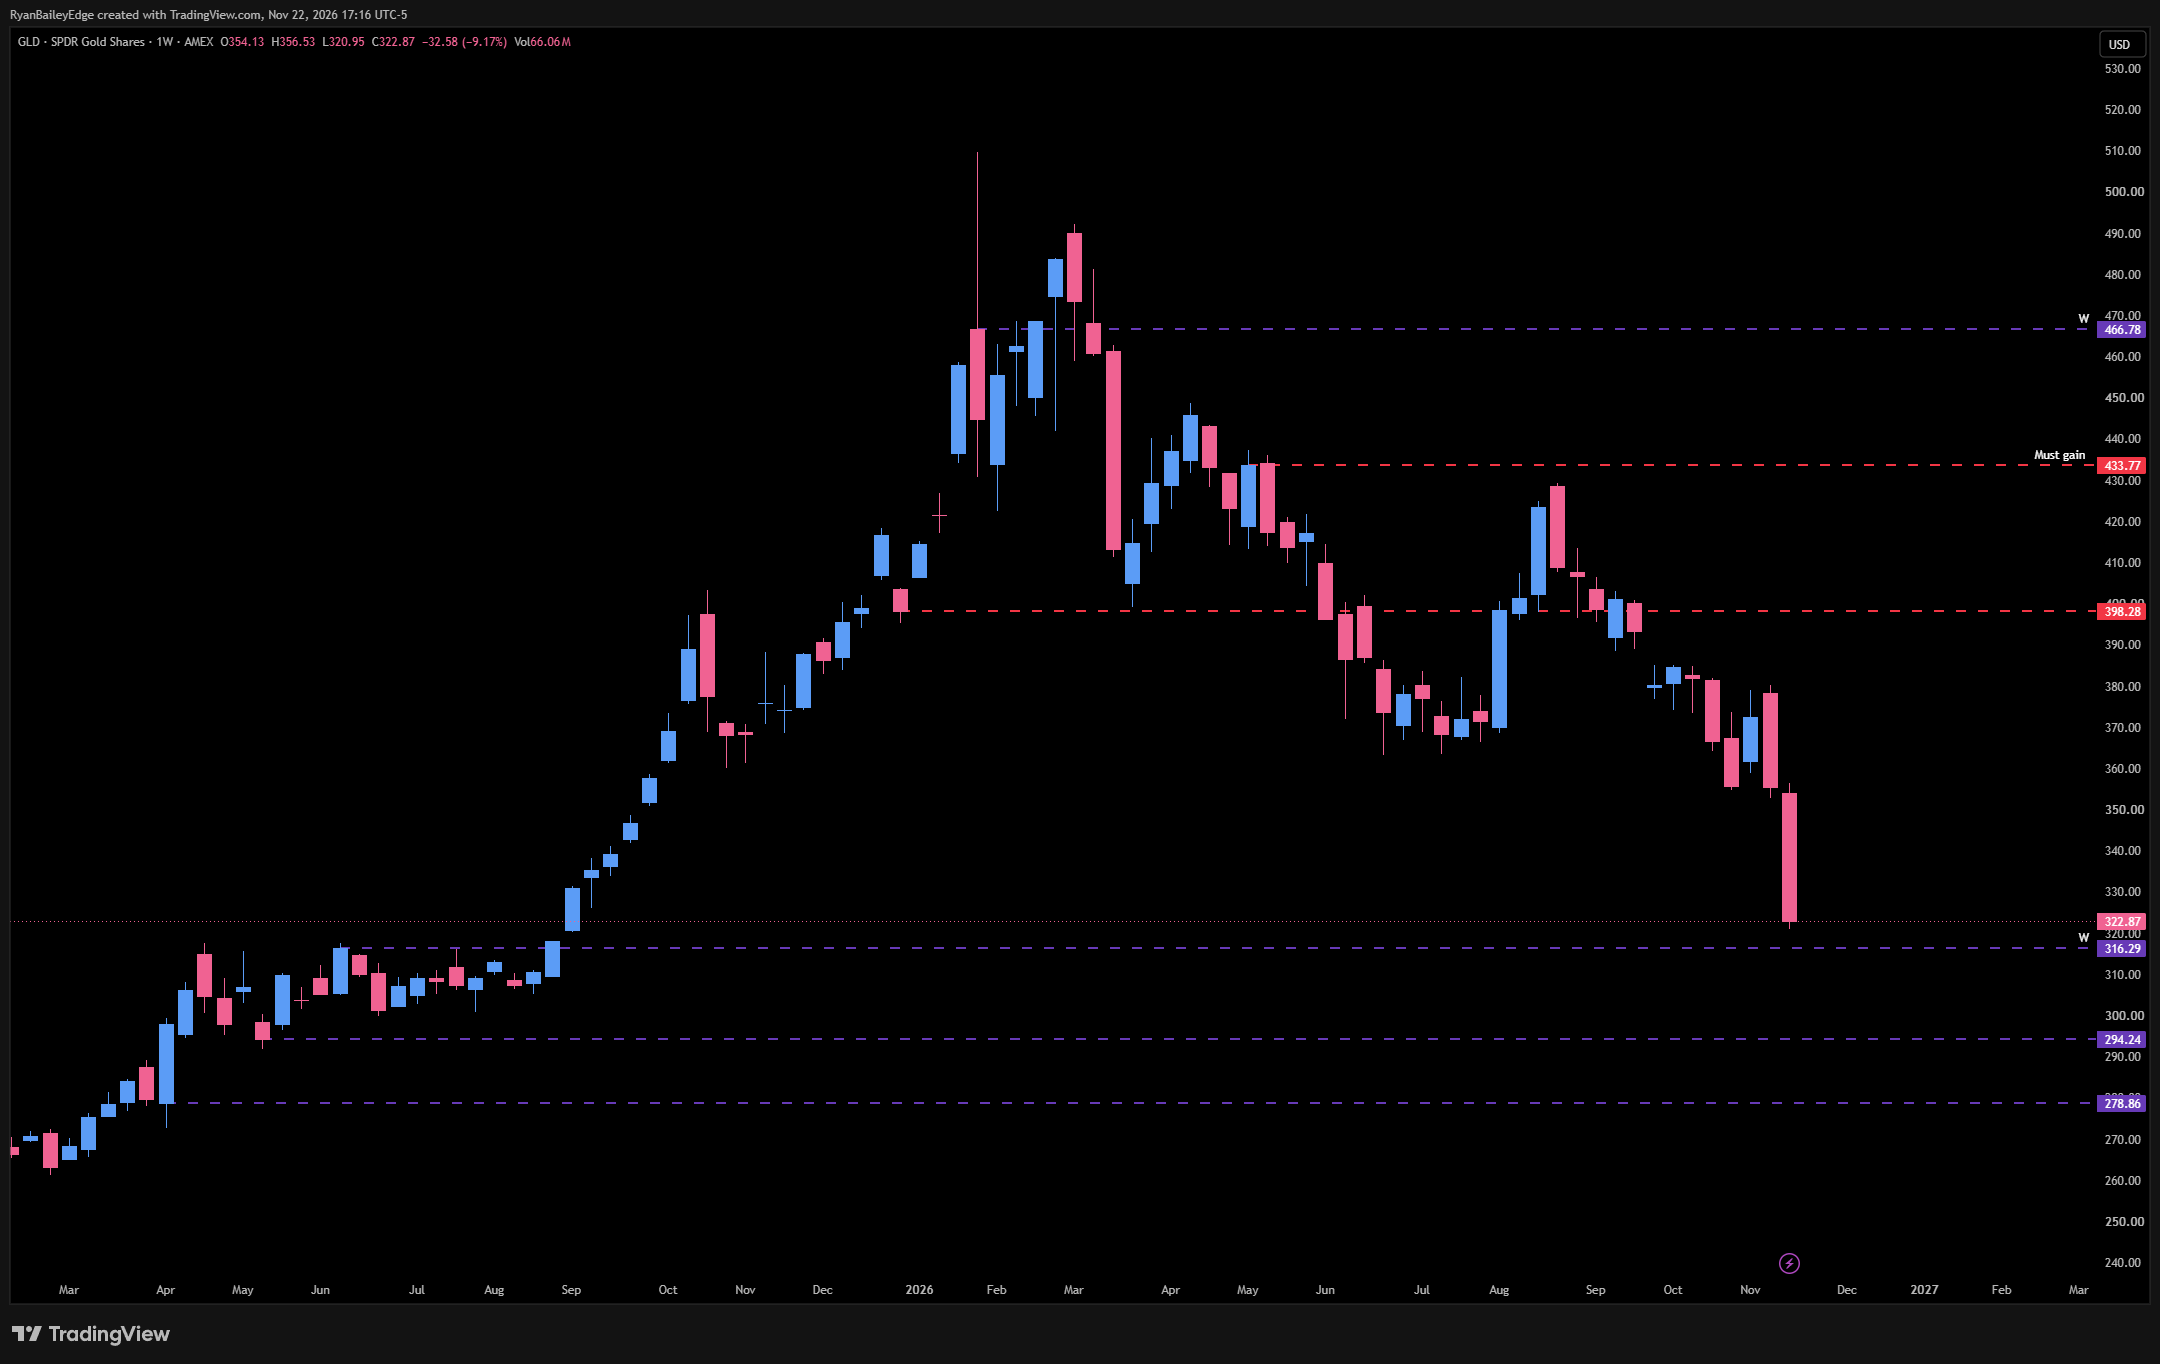
I have been talking about gold to $3,500 ever since it was around $4,400. We took the long all the way up to 4745, and when it could not gain that area — with a little cluster of failed buyers — I started telling everybody there was a strong possibility we would see $3,500. They did it all in one week, the same way ES came down. I am looking to buy gold long term, so I am watching GLD: on the 2025 run, we have not even retraced 50% yet — we are at about 37%. My buys on GLD are around 316, then 294, and 278 as my lowest buy spot. With a massive liquidity break, they could erase 2025 entirely and come all the way to the 243 area, but I do not think that happens right now. I am buying into this in my retirement account — I am not suggesting you do the same, but I missed a lot of the 2025 run-up, and this is a nice long-term buyback. This is a massive cluster of support, and I have to assume we see some relief in gold soon — silver looks absolutely decimated too. When these pop, it should give everything some relief. These are paper hands getting scared. History says we do one of two things here: pop, or go 10% lower.
SPY — Under The Hood
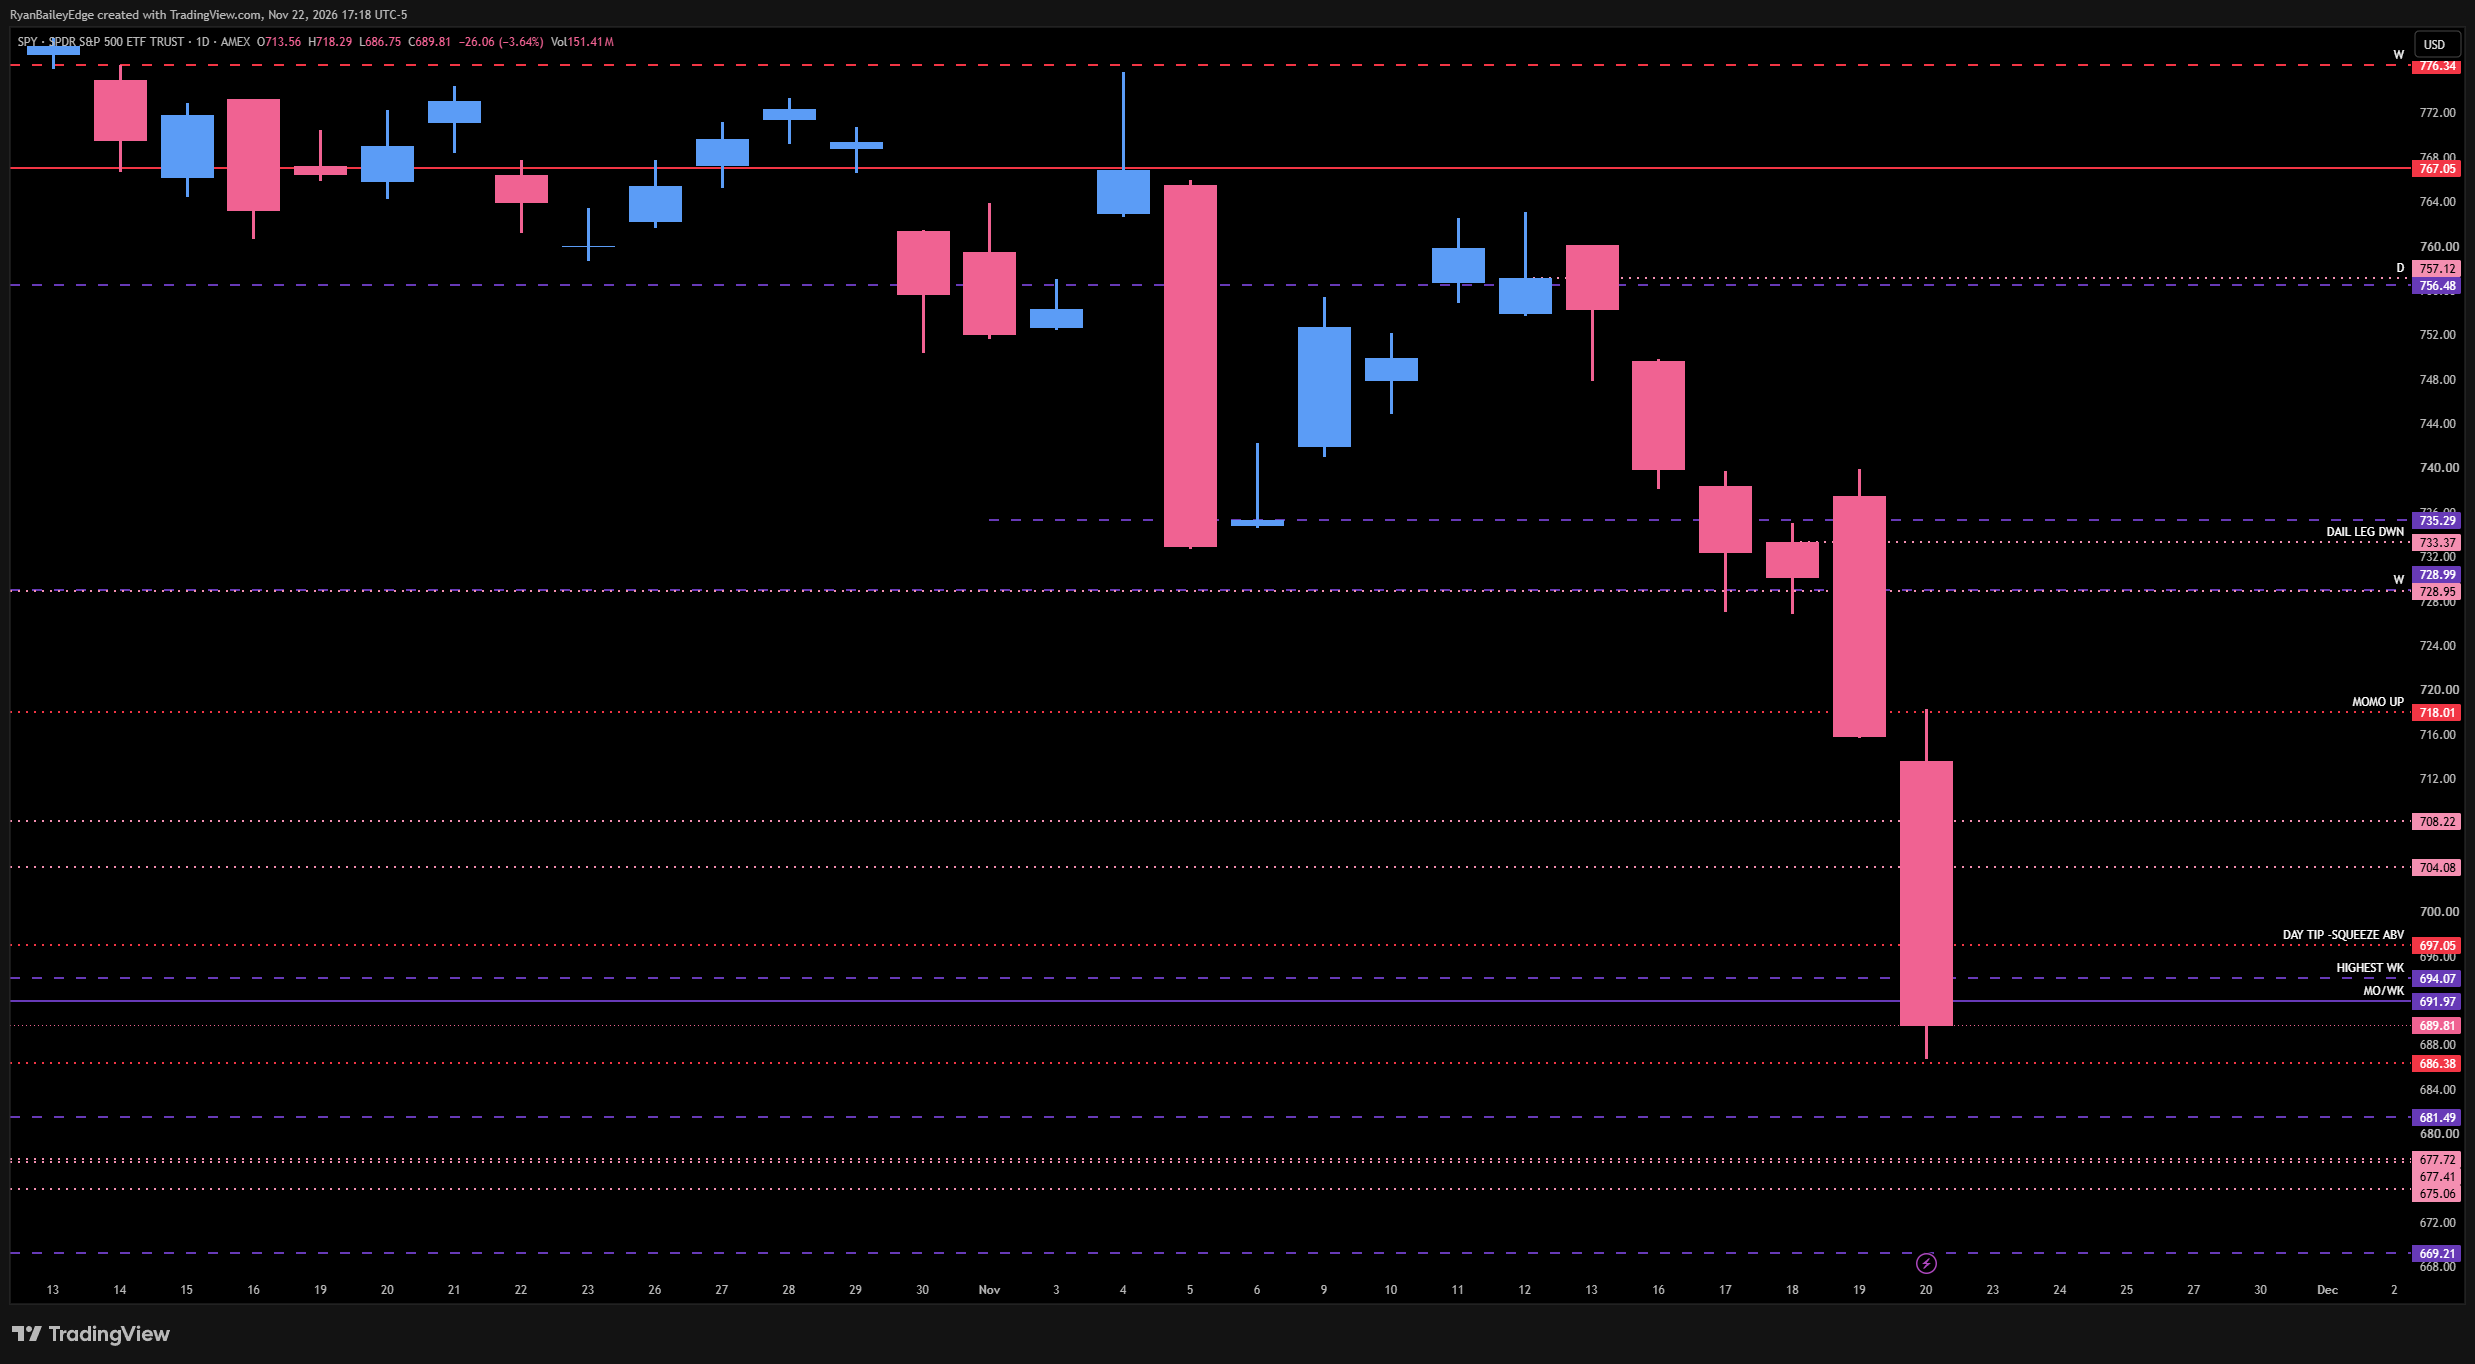
On SPY, we are in the thick of it — sitting in one of the big first monthly and weekly support areas, which also aligns with SPX. We got the daily really nicely, and they have already popped hard in the after-hours. The 697 daily was the leg tip, and they pushed above it right before Friday’s close. If we squeeze, we still have untested dailies overhead — the big one at 708 — then the 718 daily, which is tested, and the 728 weekly. The prime spot is the leg end, $729 to $735.29. That is our massive reactionary area — the leg down — and they always seem to make it to that tippity-top last spot. They would literally have to close the daily above 733 for me to say we are up on the daily, so we are pointed very hard to the downside. On the low side, we really do not want to see SPY much below the 675 area, and if they open below the 686 daily in the morning, we are in some serious trouble. I think we are due for a little pause, then a turn around to do it all over again.
SPX — 19 Weeks Of Balance And The Bounce Map
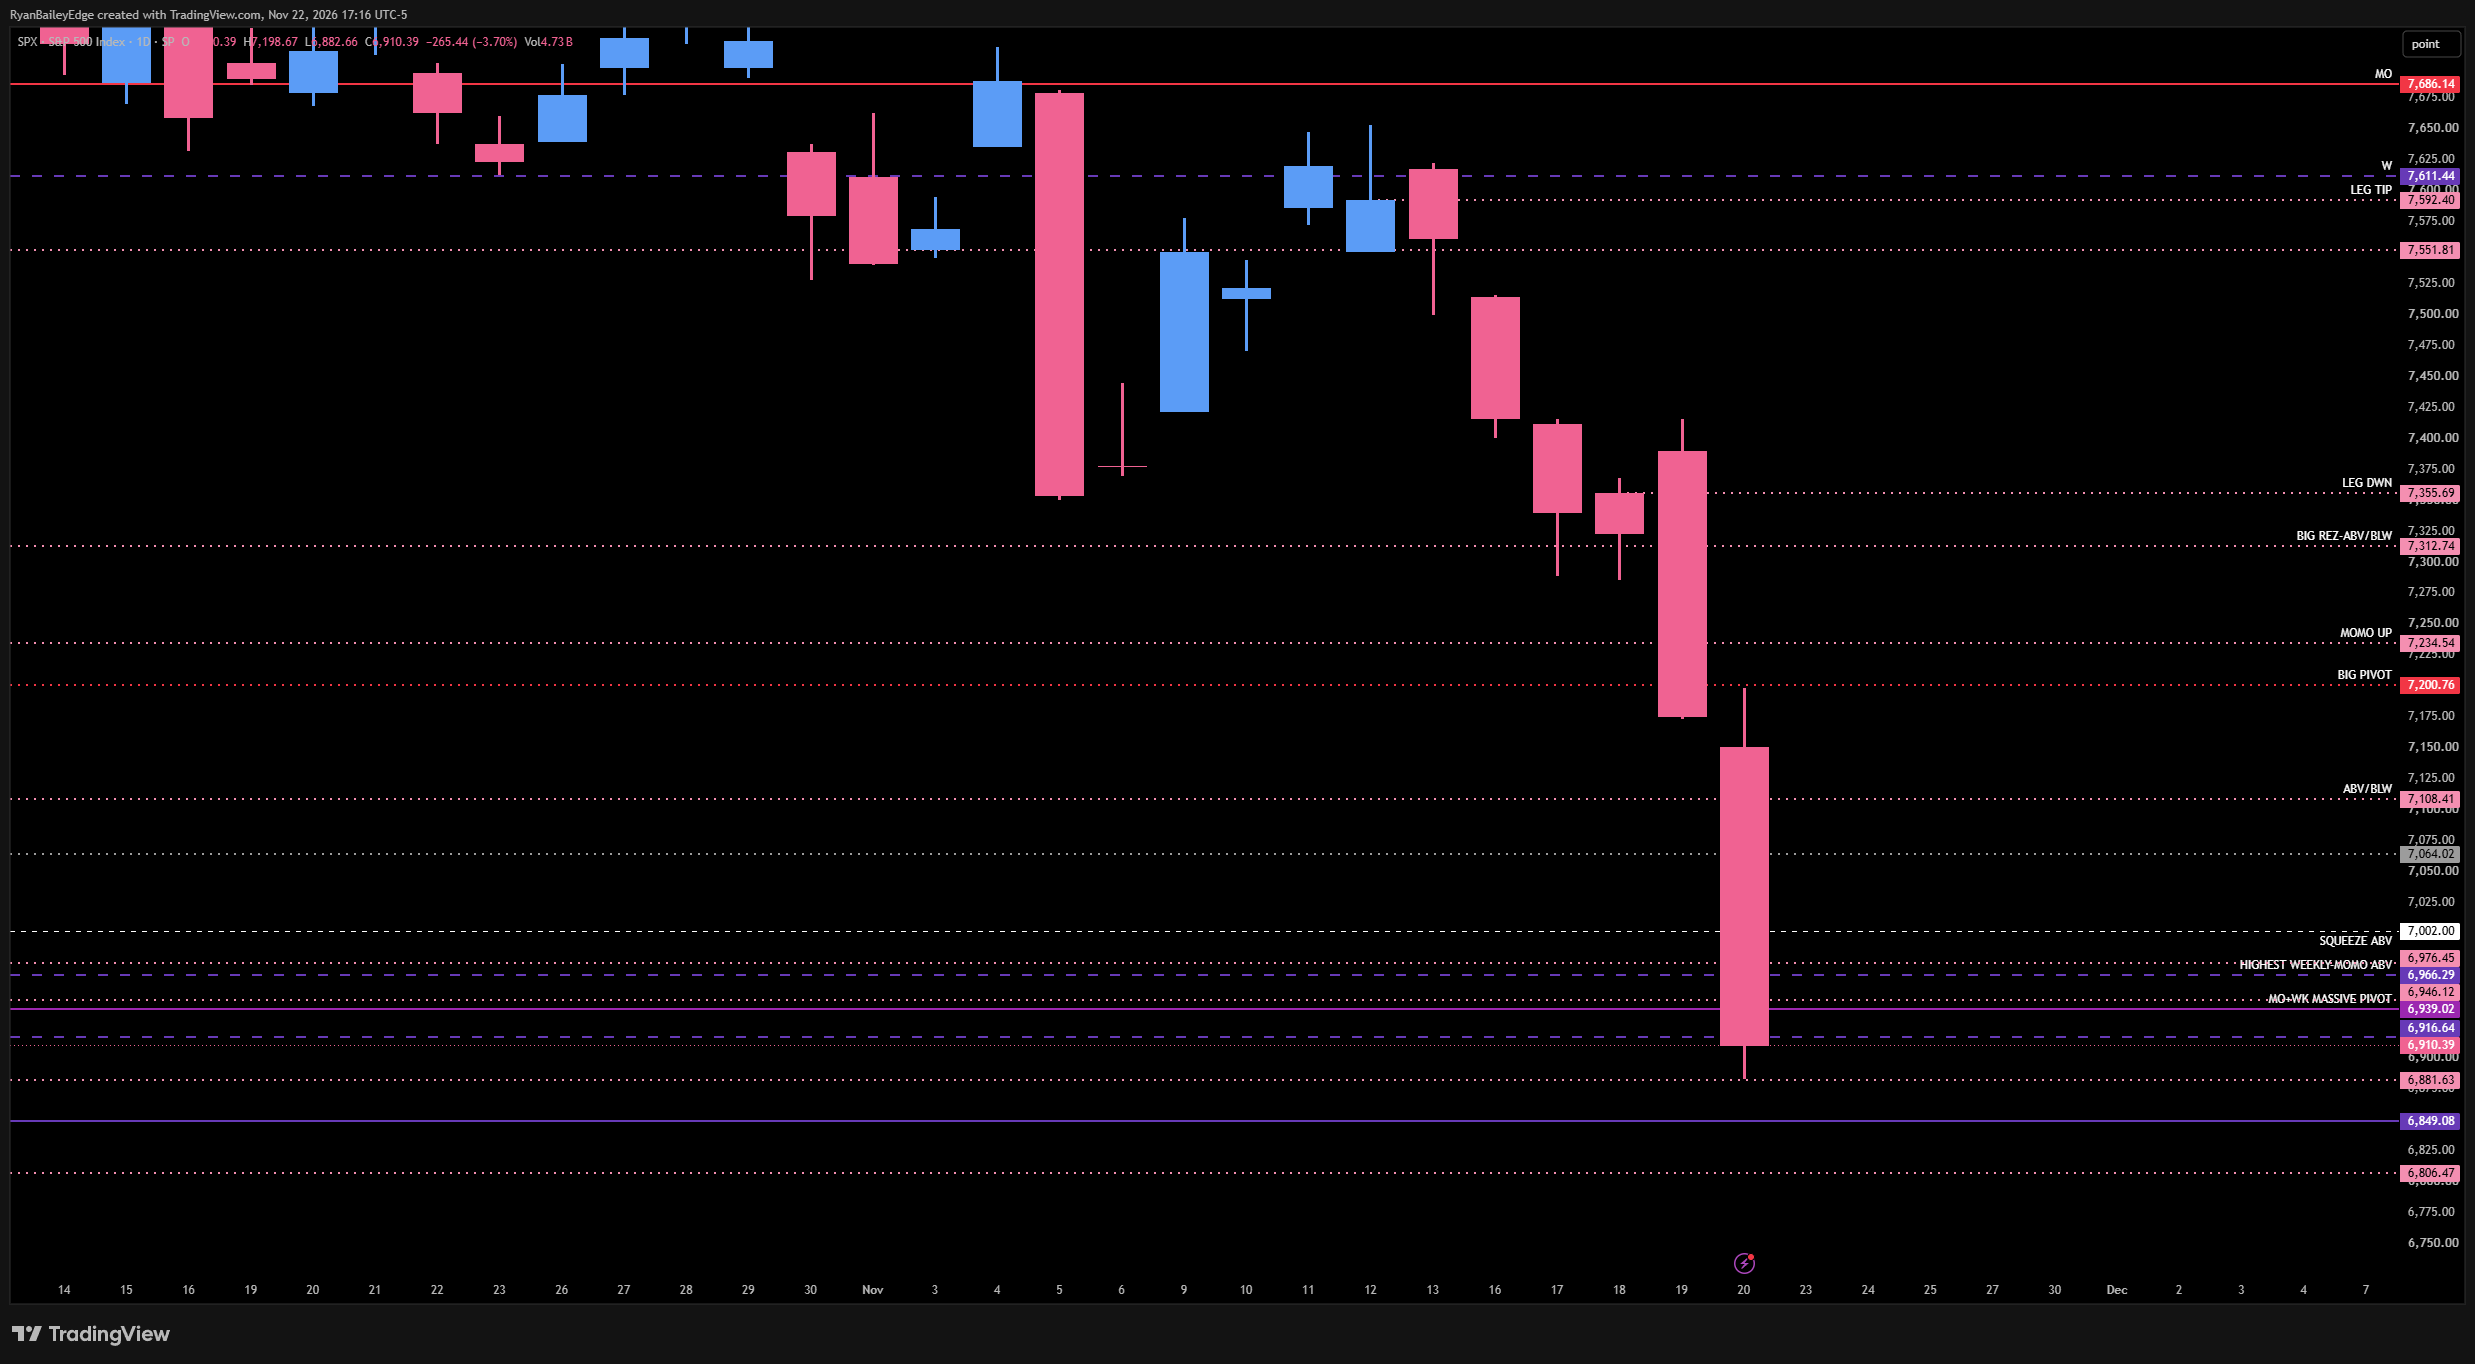
On the SPX weekly chart, we had 19 weeks of balance before this move. The 6849 monthly was the lowest one we really wanted to see them hold, and they did not quite get there. Instead, they played the daily, filled the gap, and popped. To start the week off with a squeeze, we need to be back above 6966 / 6967 — the highest weekly and daily — and really get back above 7002. But the more important level is our big above/below daily at 7108. It played beautifully from the bottom up multiple times, and it is going to be a big pivot for us for a long time. I anticipate it getting a smack, and we have a spot on ES that lines up with it. If they push above 7108, we get kind of bullish — this is the leg down, and once they get above it, they have permission to squeeze to the leg end. Above that, the 7200 daily is tested, and the 7234 daily is untested — it was the support that took us up to a previous all-time high. If 7234 plays and we get back below 7200, it should give it up. Above 7234, we go to 7312 and then our big prime spot — our leg down at 7355. Above that, we are actually kind of bullish: we start closing on the daily and rotate back up into that 19-week balance. If we are going to continue the downside, we stay below 7355. If they come lower, the 6849 monthly is first, and below it we have to get concerned. Our last major supports — and some of the best — are the big shoulders between 6715 and 6602, a 100-point pocket of massive support. If 6715 does not hold, we push swiftly into 6602 to fill the gap and try the last untested area. Reclaim 6715 and it goes. Get rejected, and it’s pretty much over. But our statistics say we are more likely to get a drop in VIX and a pop in the indices on Monday.
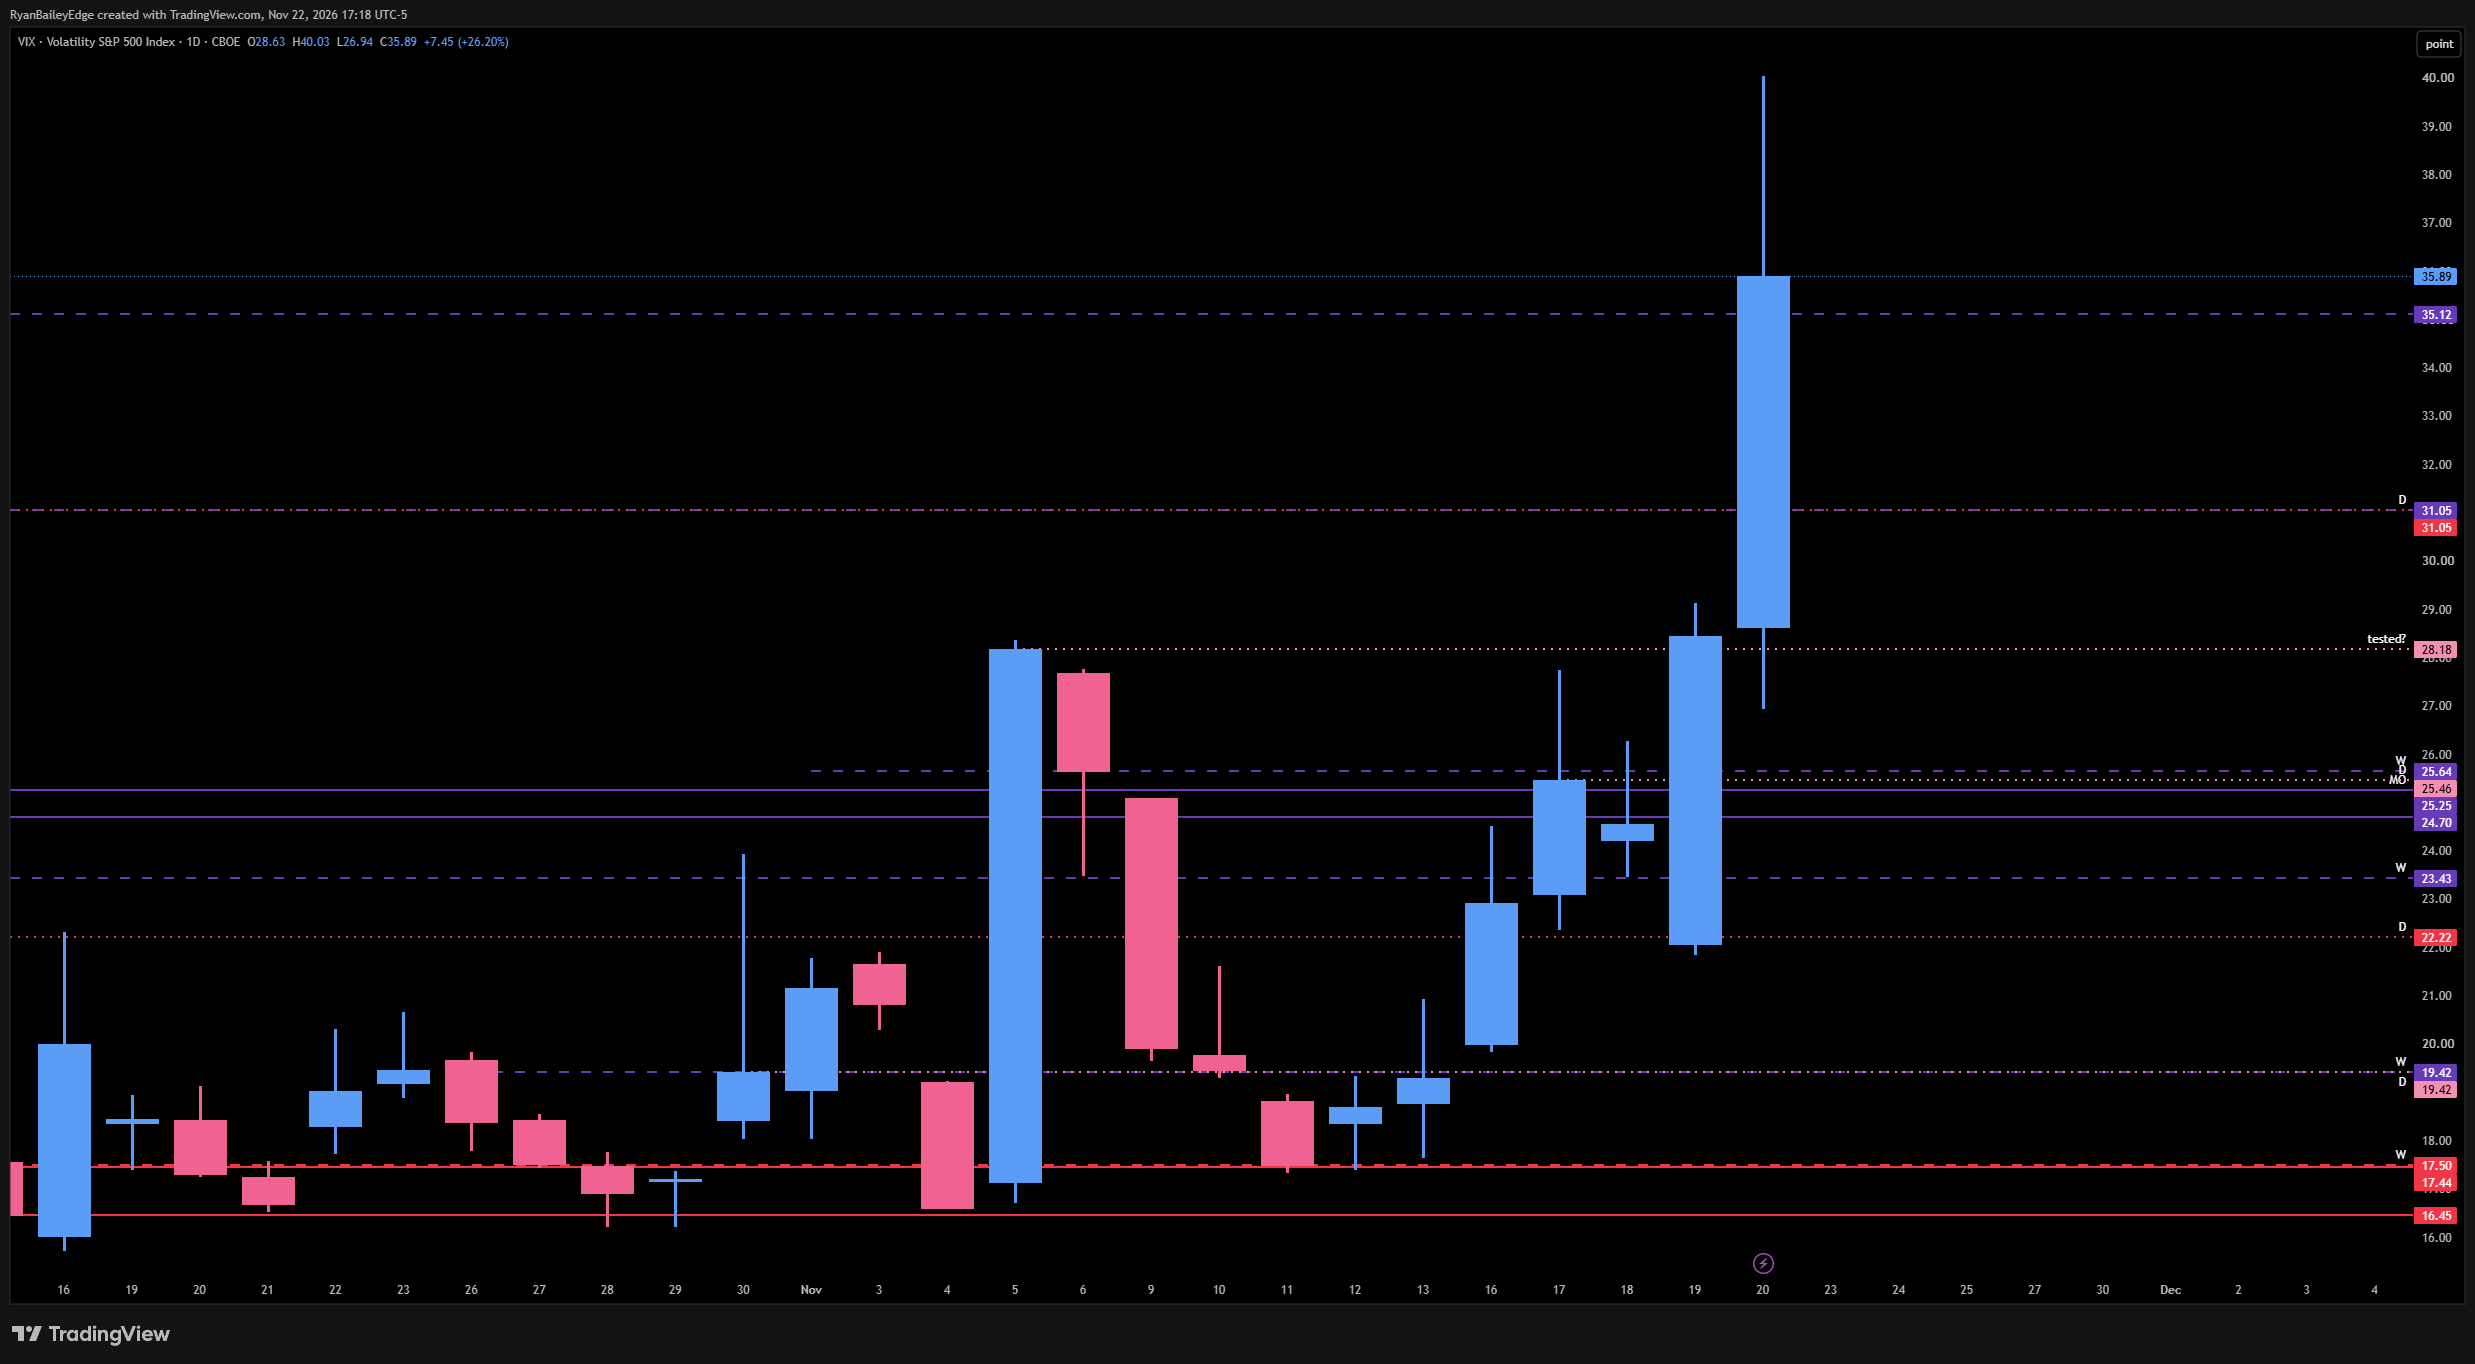
🚨 VIX Analysis: The 35.12 Relief Pivot
VIX has been our ultimate guide through this massive move. While other people were still looking higher in the indices, we were monitoring VIX at the 17.50 spot for weeks — an absolute monster that catapulted VIX off that last touch all the way to the highs.
The Breakout: VIX soared well above our $35 weekly, my final target, and touched $40. It gained on the weekly for the first time in a very, very long time, which means it can come higher if it pulls back and plays some areas first.
The Relief Pivot: 35.12 (Weekly). This is our first initial relief pivot. Above it, we keep the pressure on the indices. Below it, the indices get some relief.
The First Major Support: 31.05 — the daily has been tested, but the weekly has not. I am really looking at the $31 handle to play for support, because I think the indices pop — we are due, and it is a natural reaction at this point after getting this oversold. If it fails, we can expect higher in the indices and lower in VIX.
The Daily: 28.18 (Daily). It certainly looks tested to me, but I am keeping it on the chart.
The Big Support: 24.70 - 25.64. This is a massive support area — a daily, a weekly, and two monthlies from the top down — the $25 handle that was so big when we pushed through it from the bottom side. I think VIX more than likely pulls back into something like this before it finds support, but that is speculation. On first touch, we get a reaction — I just do not know which level it comes from.
The Leg End: 23.43. We have played it a few times, and it is our true leg end. Underneath 23.43, it’s over — VIX comes back to 19.42, and the indices catch a mad bid just from VIX failing to hold it.
The Upside: On the weekly, my higher resistance is all tested — 45.31 and 53.54 — and I have nothing untested until $60. We have not seen that since the tariffs. If VIX gets that high, we look to short VIX and get long the indices.
🎯 Detailed Actionable Trade Plan (ES Futures)
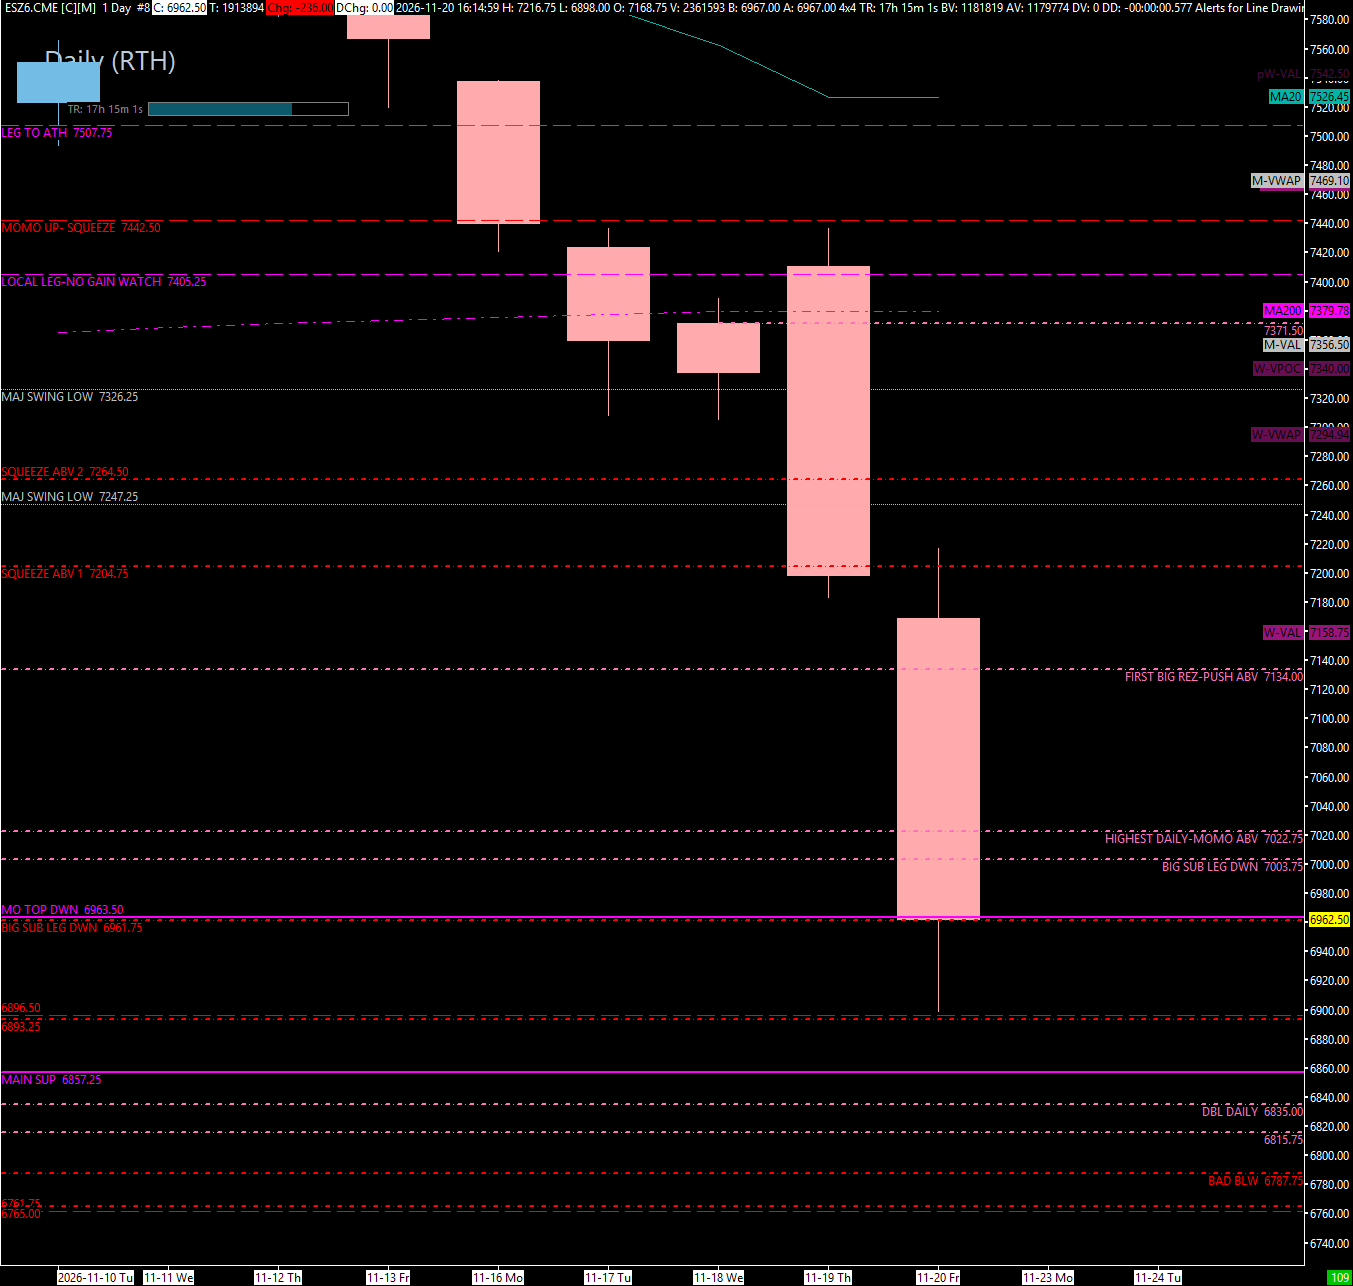
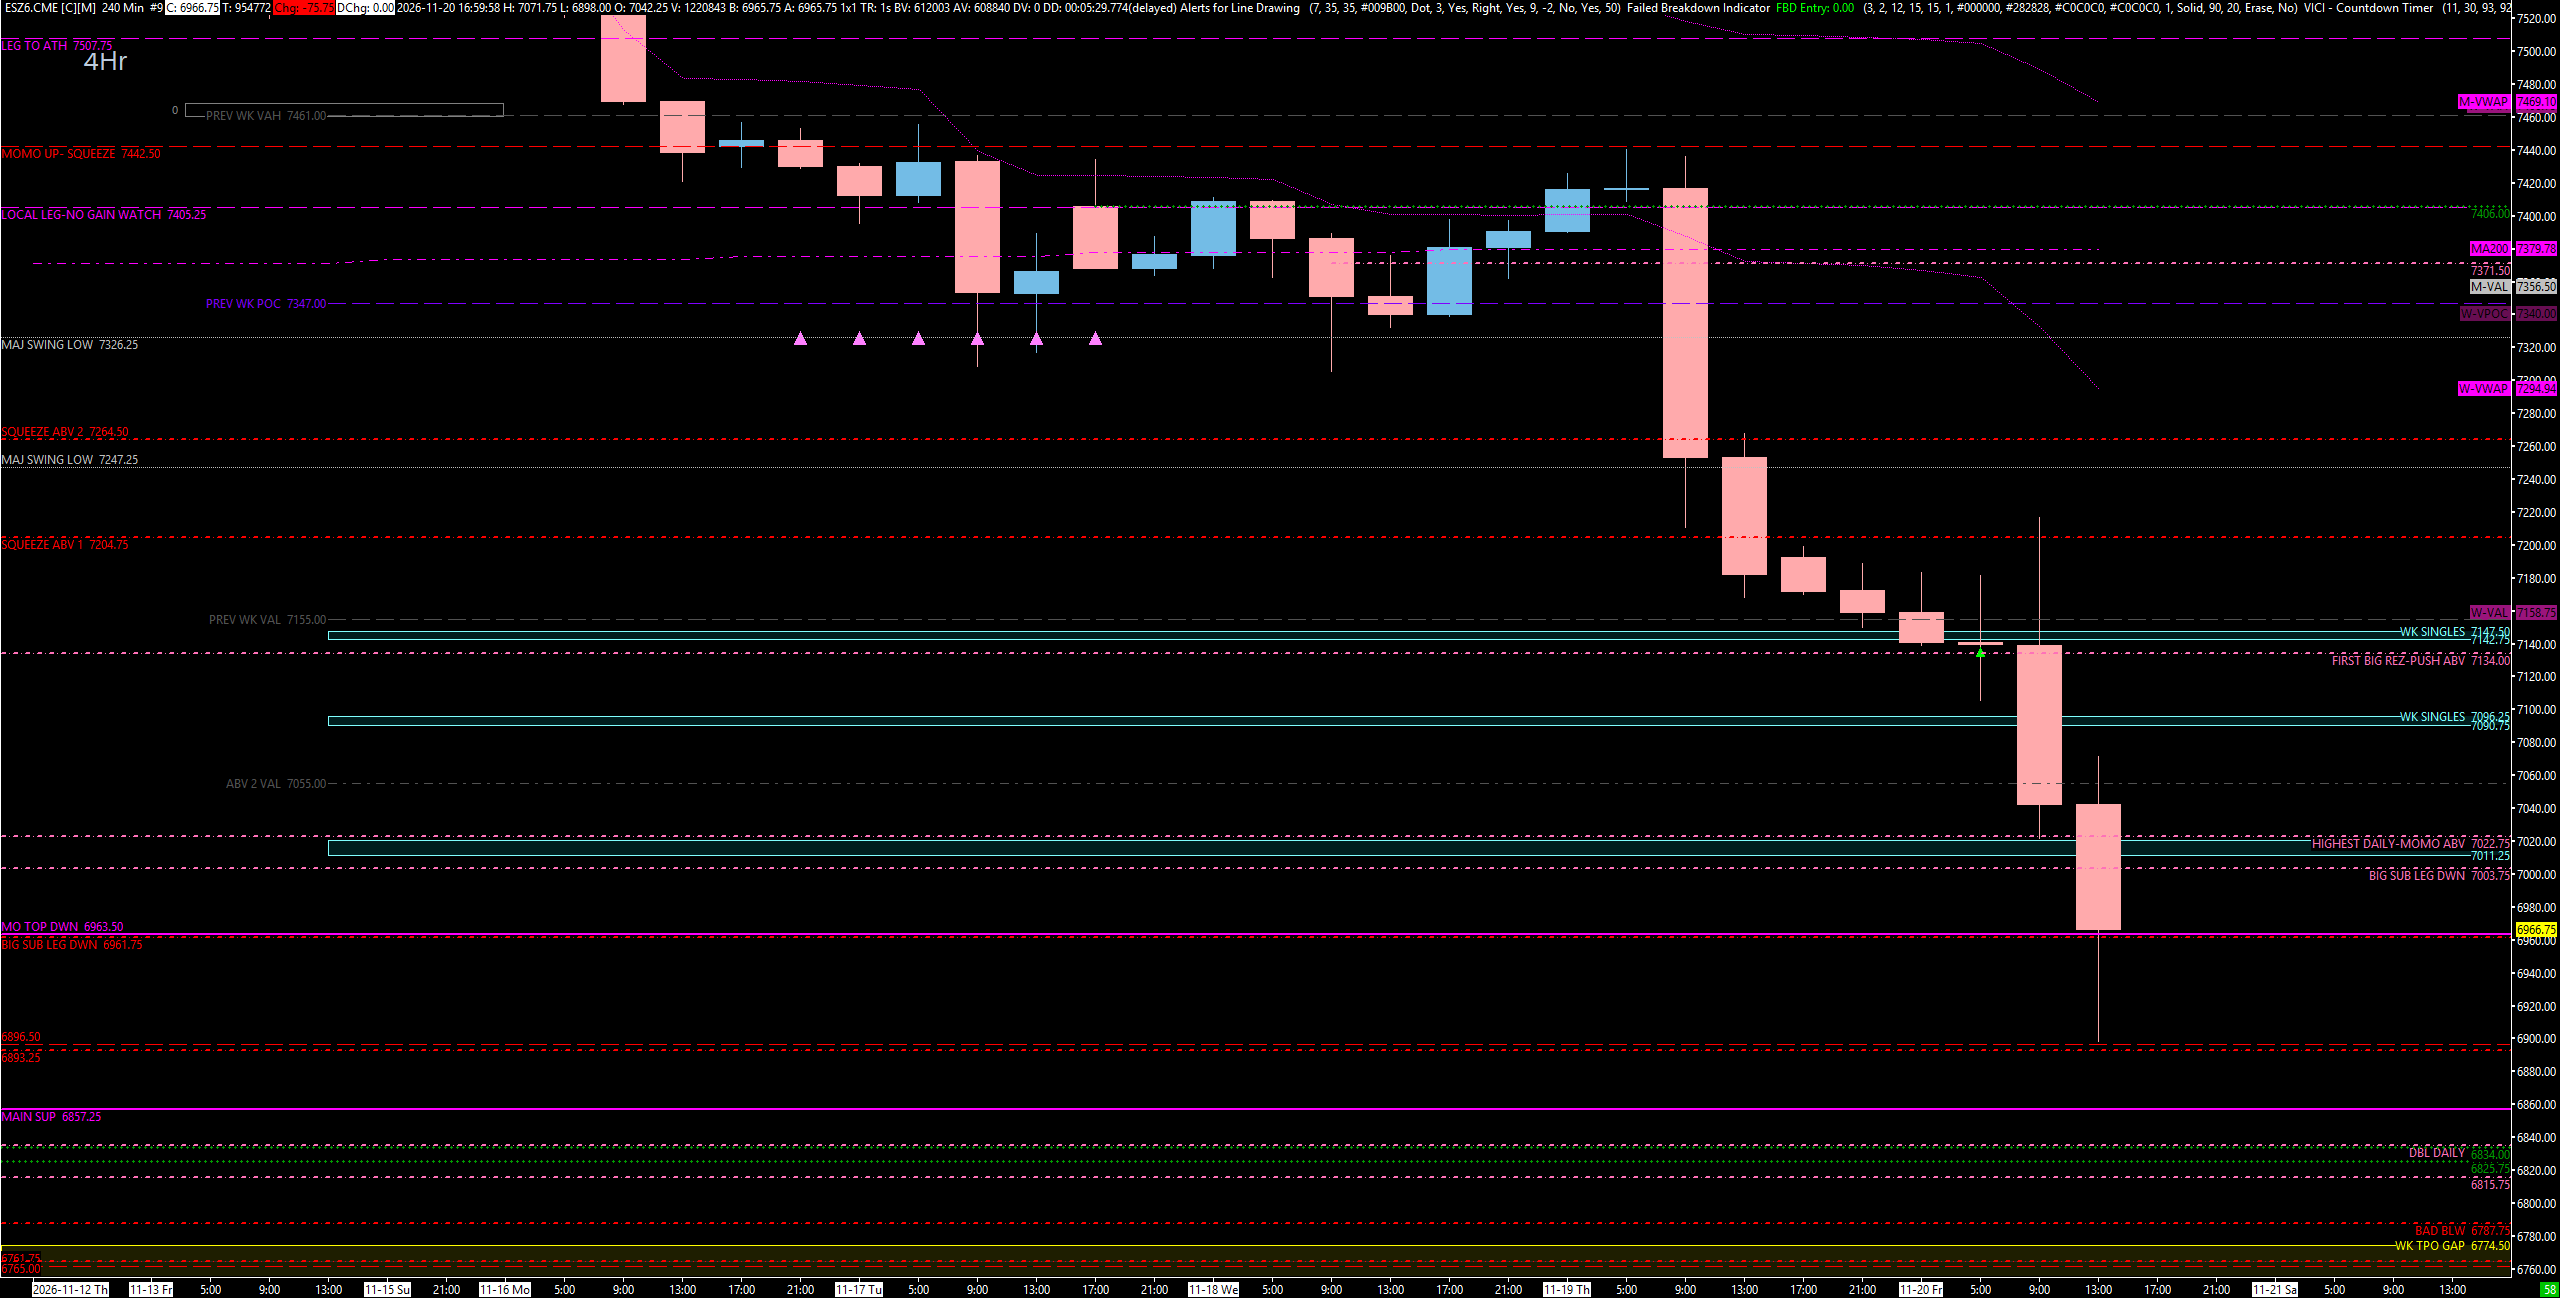
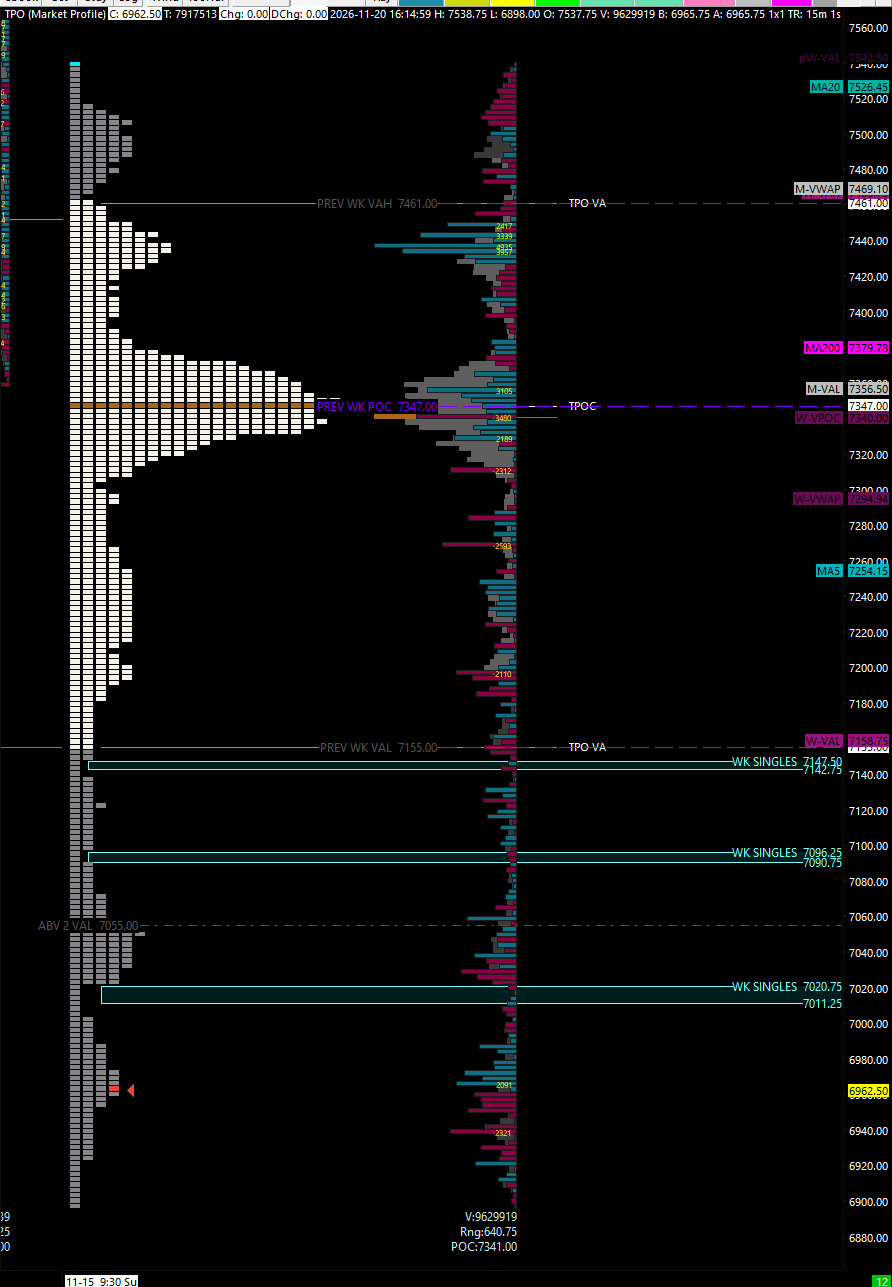
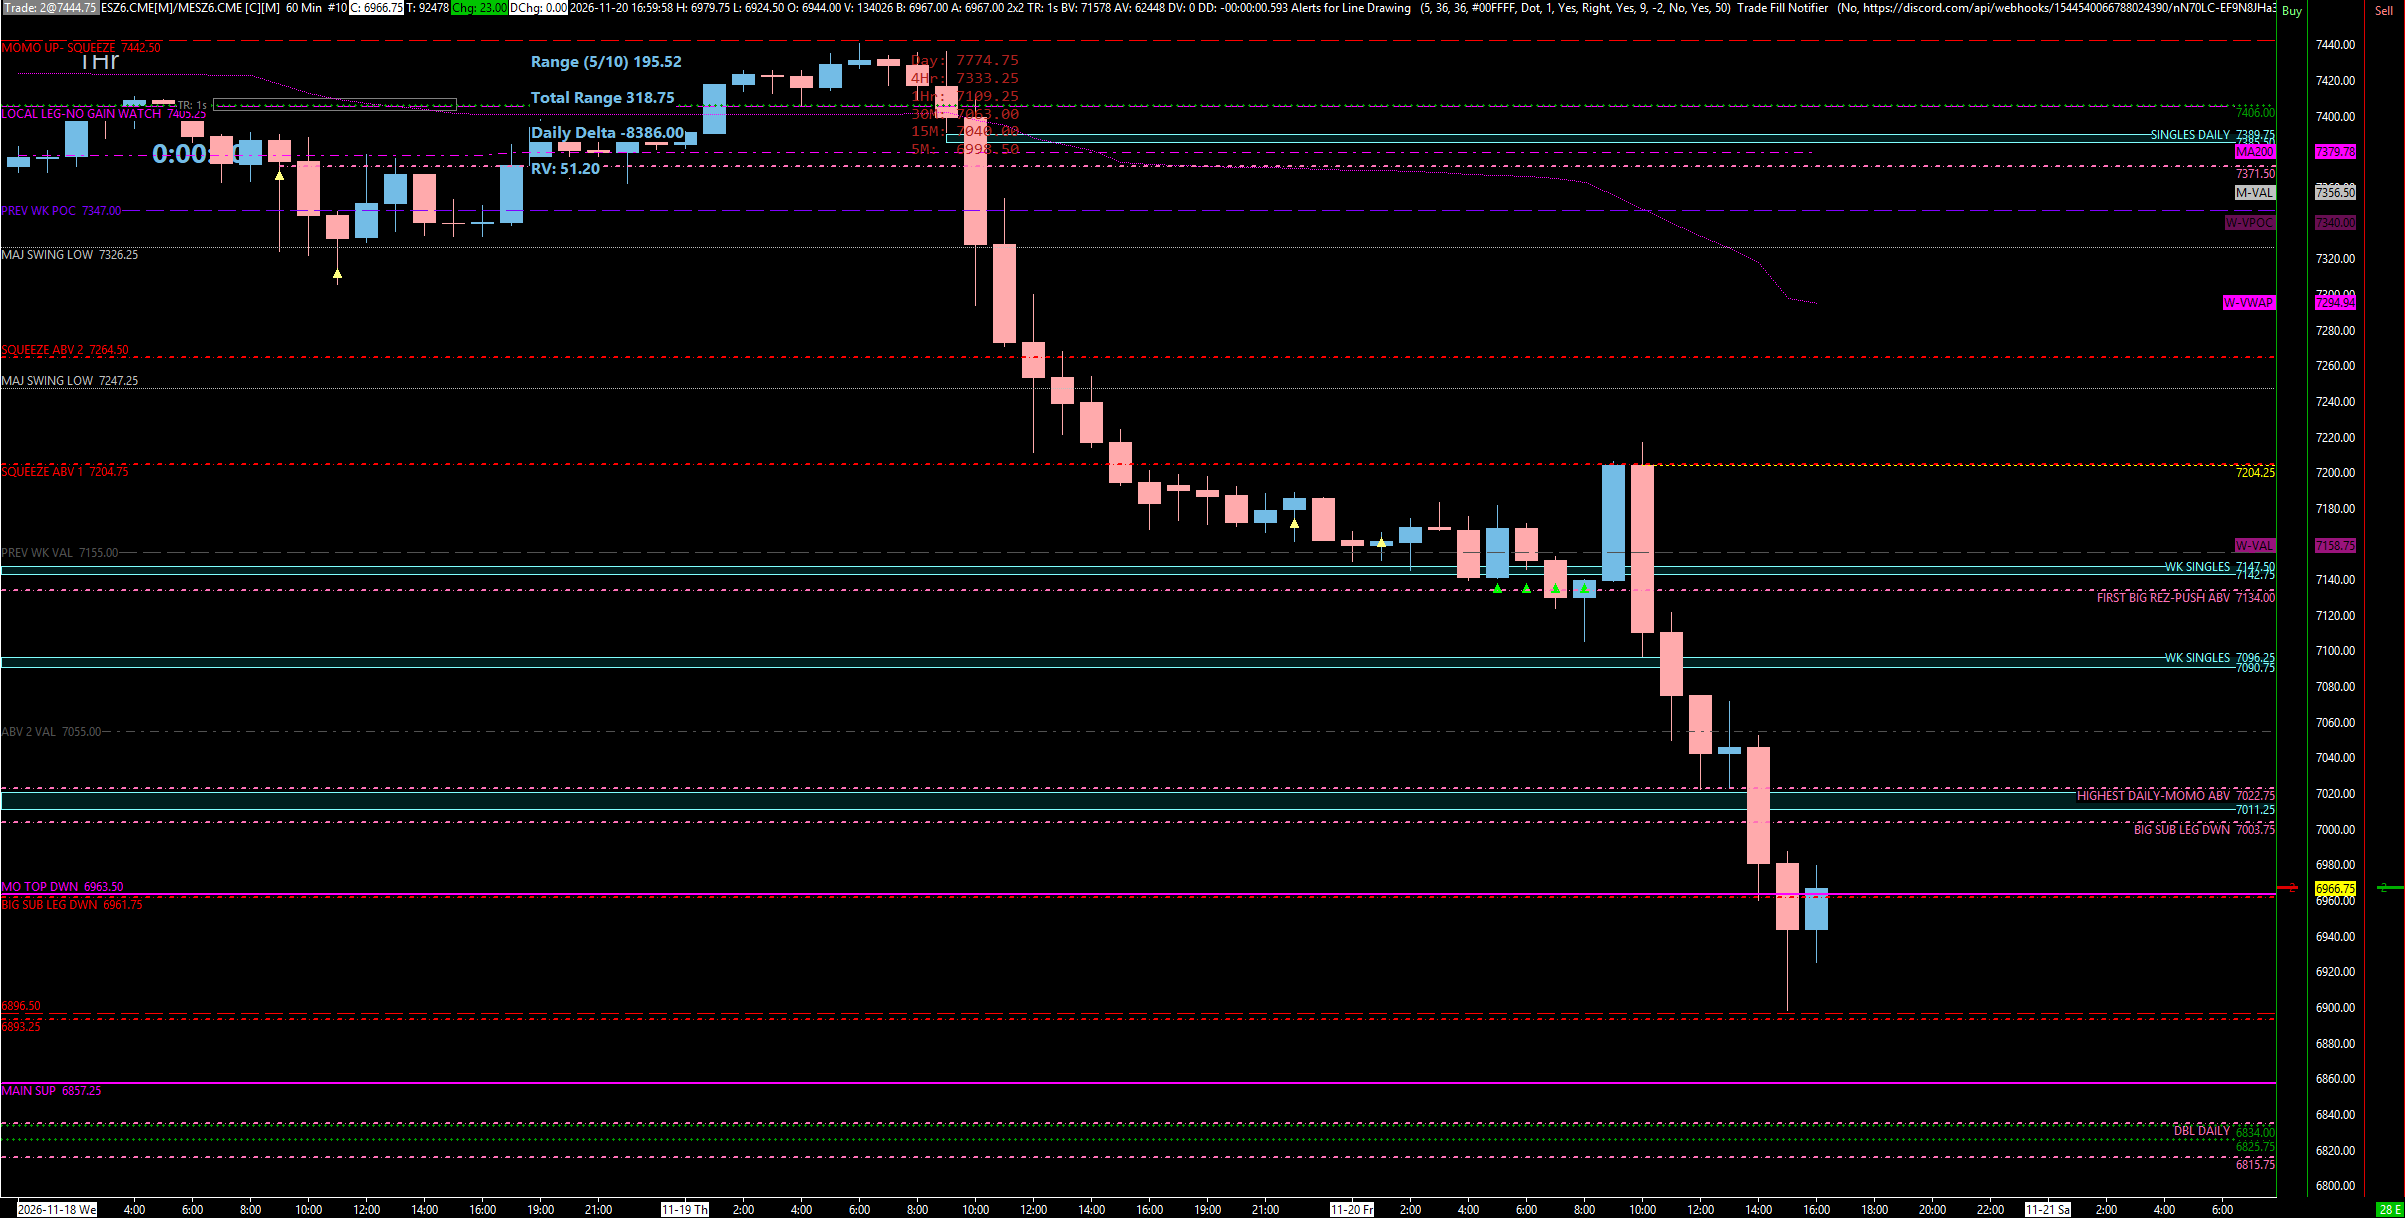
The process still points down on all timeframes, so I will respect it and play untested levels for shorts. But we just hit every high-timeframe target, played the 6896 weekly with precision right into the 6963 monthly, VIX closed up 26%, history says gap up, and Bitcoin is opening strong — so I am no longer aggressively looking for shorts. These levels are for our Monday / Tuesday initial move, up or down. Back above the 6963 monthly and the 6961 sub-leg is our first pivot to get higher. The first resistance is the 7003 / 7022.75 dailies: fill the single prints, get back below 7003, take targets at 6963, and look for runners lower. Above 7022.75 and the 7055 profile spot, we squeeze into the 7134 daily — my first big short — with singles up to 7147 and the previous weekly value area low at 7155. Above 7155, I think we squeeze 200 more points toward the previous weekly point of control at 7347, past the 7204 daily we played for Friday’s big short and the 7264 tested daily, and into the 7371 - 7406 leg down under the 7442 weekly. Ideally, they come all the way up there, hit it, and then go fill the 6705.75 weekly gap. On the downside, we want to stay above the 6857 monthly fail-safe. Below it, we have only the 6835 double daily and the 6815 daily left untested, then the 6765 tested weekly, the gap, and the 6623 - 6627 shoulder. In my opinion, we either hold the 6900 spot, or we come all the way to 6623.
🔴 Key Resistance Zones & Setups
THE FIRST HURDLE — Two Dailies & The Singles: 7003.00 - 7022.75
7022.75 (Tested Daily — Highest Daily, Momentum Above), 7003.00 (Daily), plus the 7055 profile spot above.
Context: This is our first and most immediate resistance. We have two dailies here, and I like the higher one much more — 7022.75 is labeled “highest daily, momo above,” and it also played from the bottom side. There are single prints in here that need to get cleaned up. Above it, the 7055 area is the first spot on the profile where I think they could get squeezy.
Actionable Setup: Short Setup: Look for 7022.75 to fill in, clean up the single prints, and get back below the 7003 daily — take targets at 6963 and look for runners lower if that is what you think happens right away.
Warning: 7022.75 is the beginning of our first push higher. Above it and above 7055, they could squeeze — at least up to the previous week’s value area low, which is 100 points.
THE FIRST BIG SHORT — Daily, Singles & P.W. VAL: 7134.00 - 7155.00
7155.00 (Previous Weekly Value Area Low), 7147.00 (Top Of The Weekly Singles), 7134.00 (Daily — First Big Resistance).
Context: 7134 is the first big daily and the first big resistance area I will be looking for. There is no reason not to like this spot. They do have singles slightly higher, up to 7147, and the previous weekly value area low sits at 7155 — our next big hurdle. Underneath 7155, we are very bearish.
Actionable Setup: Short Setup: I am looking to short 7134. It is the above/below for the inception of our next big push higher.
Warning: Above the previous weekly value area low, we start to get bullish, and I think we squeeze 200 more points toward the previous weekly point of control at 7347.
Friday’s Short & The Tested Daily: 7204.00 - 7264.00
7264.00 (Tested Daily), 7204.00 (Tested Daily — Friday’s Big Short).
Context: 7204 is the daily we played on Friday for the big short — an incredible call in the trade plan, and we dusted it right from there. Above it, the 7264 daily is also tested.
Actionable Setup: Reaction Watch: Both are tested, so watch for reactions, but if they push above 7155 and the momentum carries, these become stepping stones toward the leg down.
Warning: Above 7264, they can come all the way up into our big leg down.
THE LEG DOWN — P.W. POC, Daily Leg & Weeklies: 7347.00 - 7442.00
7442.00 (Weekly — Thursday’s First Push-Down Call), 7406.00 (Daily Leg Down), 7371.00 (Weekly), 7347.00 (Previous Weekly Point of Control).
Context: This is our ES daily leg down. Up top is the 7442 weekly — the big one we called on Thursday for the first initial push down. Between 7406 and 7371, we have a massive area of resistance, and right under it is the previous weekly point of control at 7347 — very close to our major leg down, and a massive reactionary spot. Above or below 7347 is fairly bullish or bearish.
Actionable Setup: Short Setup: This is the ideal spot for me. I hope we come all the way up here, hit it, and then go get the 6705.75 gap. But we do not always get what we want.
Warning: Above this area, the leg down is reclaimed, and the bearish thesis is in real trouble.
🔵 Key Support Zones & Setups
THE TARGET THAT HIT — Tested Weekly, Monthly & Sub-Leg: 6896.00 - 6963.00
6963.00 (Monthly), 6961.00 (Sub-Leg Support), 6896.00 (Tested Weekly — Played With Precision).
Context: This is where we called it. I kept saying we would catch a bid somewhere between 6850 and 7000, and they played the 6896 weekly perfectly, right into the big 6963 monthly area, for a healthy reaction of well over 65 points. This is a previous leg down from January through March — I am pulling levels from almost a year away — so being above 6961 is pretty bullish.
Actionable Setup: Above/Below Pivot: We are back above the 6963 monthly and the 6961 sub-leg — that is our first pivot to start to get higher. Above it, the 7022.75 daily comes into play.
THE FAIL-SAFE — Monthly, Double Daily & Daily: 6815.00 - 6857.00
6857.00 (Monthly — The Fail-Safe), 6835.00 (Untested Double Daily), 6815.00 (Untested Daily).
Context: The 6896 weekly is big — it is the leg end. If they slip below it, the 6857 monthly is the fail-safe. This is really where we want to see them stay above. If they do not, we only have two more untested levels: 6835, a double daily I like, and 6815, a daily I do not really like.
Actionable Setup: Sweep & Reclaim Watch: 6857 will be the deciding factor if they pull back a little lower and try to reclaim from Friday’s low. Slip below, then get back above and go.
Warning: Under 6815, it goes bad. Below this monthly, we have an opportunity to come down another couple hundred points.
The Gap & The Shoulder — Tested Weekly, Gap Fill & Weekly/Daily Shoulder: 6623.00 - 6765.00
6765.00 (Tested Weekly), 6705.75 (Weekly Gap), 6627.00 (Daily — Big Shoulder), 6623.00 (Weekly — Big Shoulder).
Context: If we lose the fail-safe, we could slip below the 6765 tested weekly and fill the massive 70-point weekly gap at 6705.75 — don’t think they can’t come lower, because they certainly can. Below that is the 6623 / 6627 weekly/daily shoulder, which would be massive support. I actually like this spot quite a bit.
Actionable Setup: Reaction Watch: Watch for a potential reaction at 6627. We either hold the 6900 spot, or we come all the way down here.
Warning: A true liquidity break could still flush another 10%. Let the process tell you when it is time.
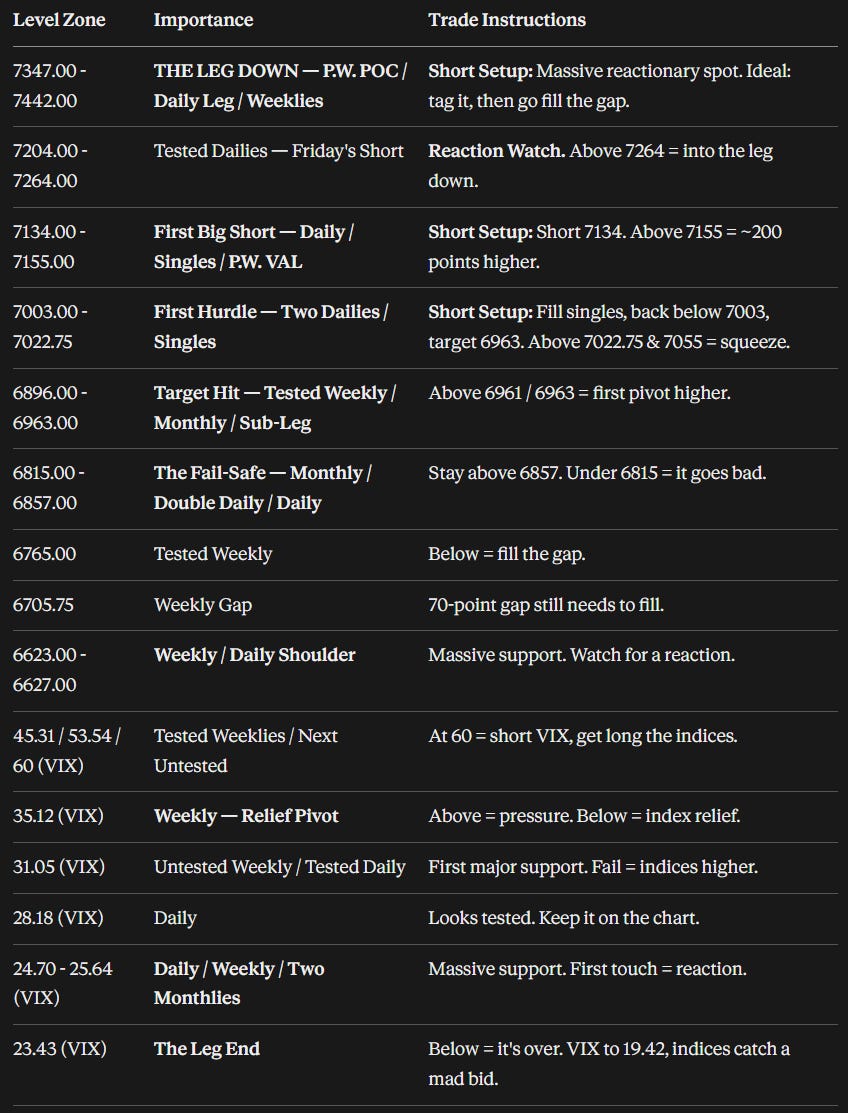
📌 Cheat Sheet – Key Levels Recap
🧠 Final Thoughts
We hit every high-timeframe target. We played the 6896 weekly with precision, VIX closed up over 26%, Bitcoin is opening strong, gold is sitting on massive support, and history says gap up. Everything is lining up for at least a momentary bounce. But we are still pointed down on all timeframes, so respect the process: play the untested levels for shorts, take profits as they come, and do not chase. Back above 6963 is the first pivot higher, 7003 / 7022.75 is the first hurdle, 7134 is my first big short, and above 7155, we could squeeze 200 points into the 7347 - 7442 leg down. On the downside, 6857 is the fail-safe — below it, it is the 6835 and 6815 dailies, the 6765 weekly, the 6705.75 gap, and the 6623 - 6627 shoulder. On VIX, watch 35.12 for relief, the $31 handle for support, and the 24.70 - 25.64 stack below that. Underneath 23.43, it’s over for VIX — and the indices catch a mad bid.
🏆 Celebrating The Room: We set some personal records in the Inner Circle this week, and I want to salute these people like I always do, because they deserve it 1000%. TML — this man will follow me to the pits of hell — took a small put position into a massive Thursday, and we had not even finished the last 300-point push into our target area. Lucid had a huge day. Bart stacked big day after big day all week. I pulled 100 points myself on the 19th. And then there is Jesse. He came into the room about two months ago and said, “Ryan, I need some help,” while he was deep in the red. In less than two months, he has turned it all the way around — big week, big month, and now green on the year. He told me, “I always knew I could do it. I just needed to find the right plan.” That is what this is about. I have been trading for 20-plus years — I am supposed to make money. These guys have been trading less than a year or two, and they follow the plan, follow the process, and it works for them. If you are a Trade Plan subscriber and you are not in the room yet, hit me up and I will get you in there. The plan is where it starts; the room is where the real structured process begins, and you get to see exactly how we execute, hands-on.
I know this one ran long — 43 minutes when I usually try to keep it under 20 — but there was a lot to cover: Bitcoin, gold, VIX, SPY, SPX, and ES. Thank you for joining me. Cheers, and have a good one.
Until next time—trade smart, stay prepared, and together we will conquer these markets!
Ryan Bailey, VICI Trading Solutions.
📊 Indicator String
Copy and paste the levels below into your S&P Edge Levels indicator to automatically plot today’s key levels on your chart:
7442.00|WK|W
7406.00|D|D
7371.00|WK|W
7264.00|Tested D|TD
7204.00|Tested D|TD
7155.00|P.W. VAL|GD
7134.00|D|D
7022.75|Tested D|TD
7003.00|D|D
6963.00|MO|M
6896.00|Tested WK|TW
6857.00|MO|M
6835.00|D|D
6815.00|D|D
6765.00|Tested WK|TW
6627.00|D|D
6623.00|WK|W


