

Welcome back, everybody — it is time for the Weekend Review. Today is Sunday, October 25th, and I’ll tell you what, it was an amazing week for the trade plan. As many of you know, it was ridiculously spot on — and I’m not just talking about one day. Every single day, including Friday, where the plan played absolutely perfect around 12:30 with the high of the day. We called the prime short and brought it right down into the pocket for well over 35 points. It has just been back-to-back hits lately. We have had a lot of money being made in the Inner Circle and a lot of thank-yous and DMs coming in from Trade Plan subscribers — you guys are so welcome. Don’t worry, we are going to do it all again this week. This is what we do. It’s not me — it’s the process. I follow the process, I give you the same type of detail every single week, and you better believe we are going to do it once again.
Now we finally have some volatility in the air. We got our pullback, VIX is elevated, and one thing is for sure — we are out of the summertime doldrums and getting some serious ranges, which leaves us with a lot of opportunity. As of this writing, the Sunday open has popped off the lows exactly like I figured it would, bumping right up into our 7697.00 Daily and almost grabbing the 7701.00 4-Hour — and we are already getting a little reaction there. Those of you who collected 10 points on that, congratulations. I don’t trade the overnight session, so this is really something I am looking for in the cash session. As usual, we are going to walk through VIX, SPX, and ES so we can conquer the markets on Monday.
📧 IMPORTANT — Check Your Spam Folder. Please whitelist rbailey@vicitradingsolutions.com and info@vicitradingsolutions.com, mark them “Not Spam,” and add them to your contacts so every trade plan and brief lands in your inbox.
📈 The New & Improved SPX Morning Brief — Free. Seats are limited and they will fill up fast. Grab yours now: https://go.vicitradingsolutions.com/spx-brief
A Note on This Week’s Market:
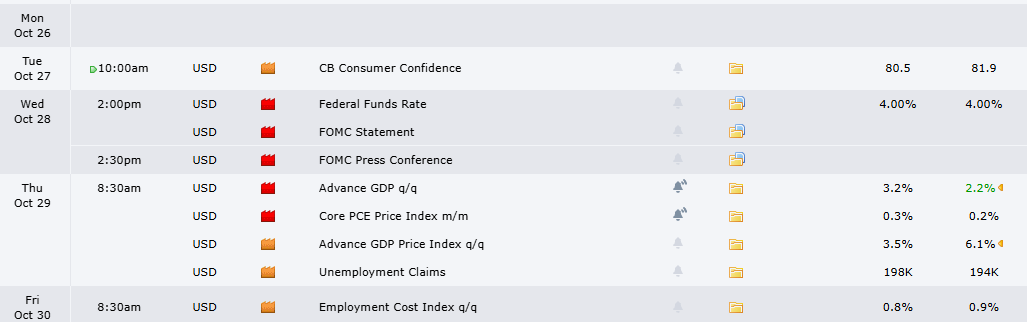
News:
Range: We are out of the summertime doldrums and printing serious ranges again. More range means more opportunity — and more reason to only engage at our levels.
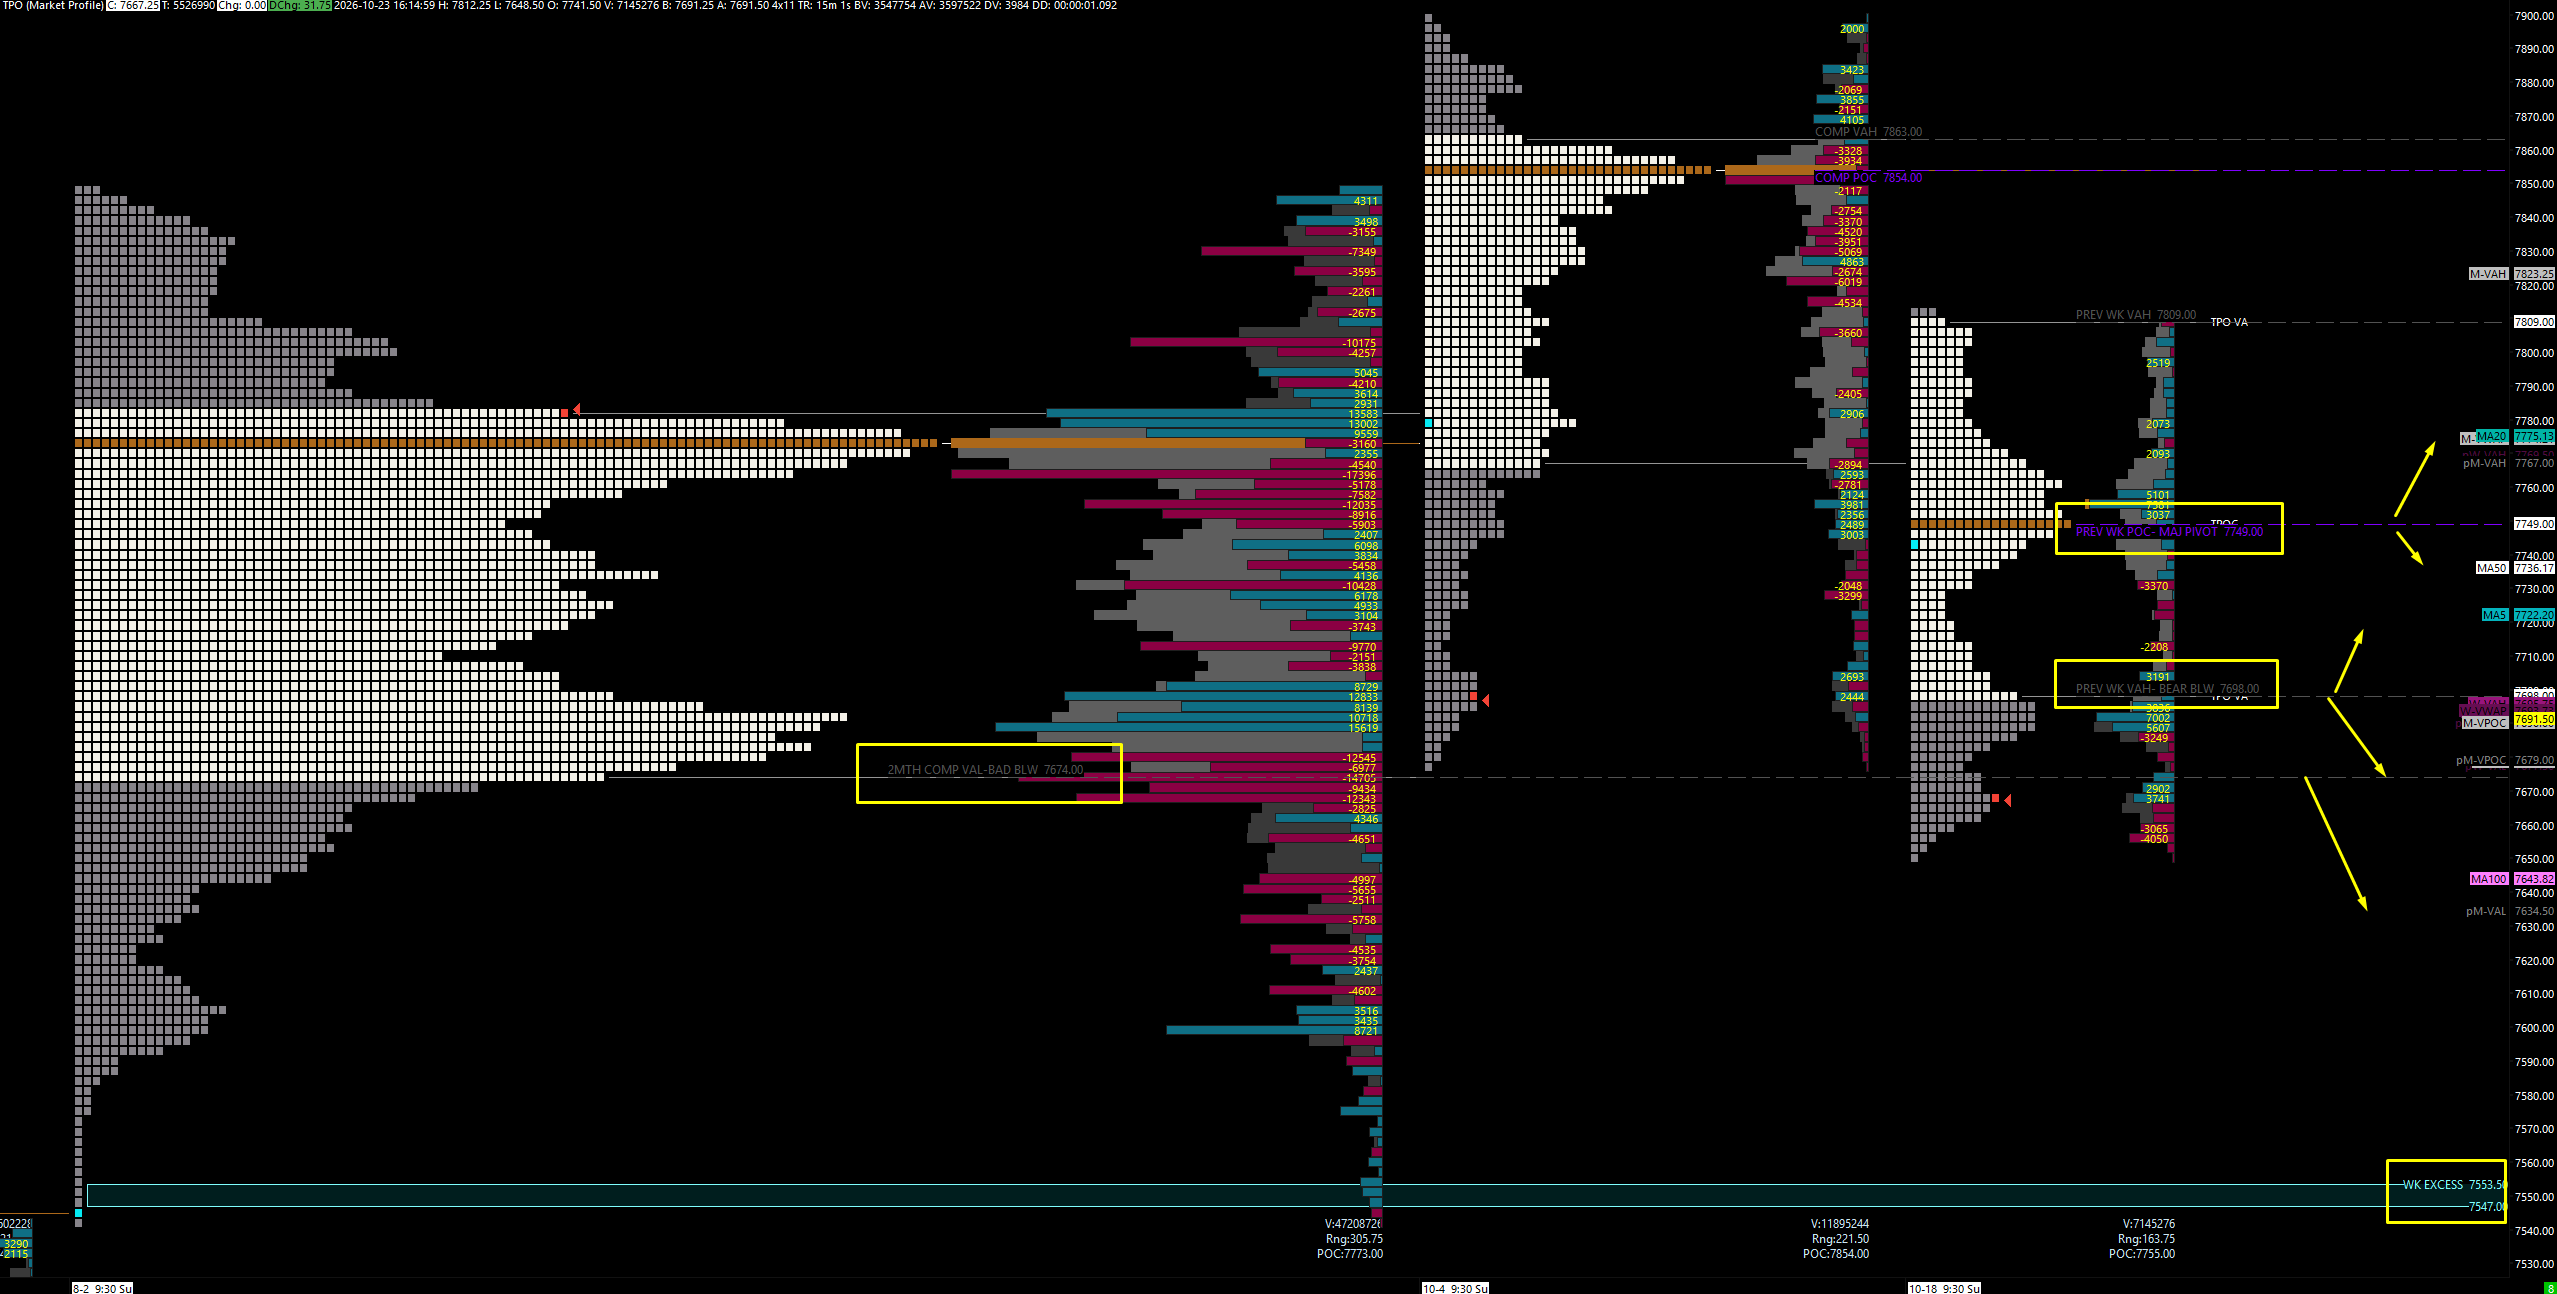
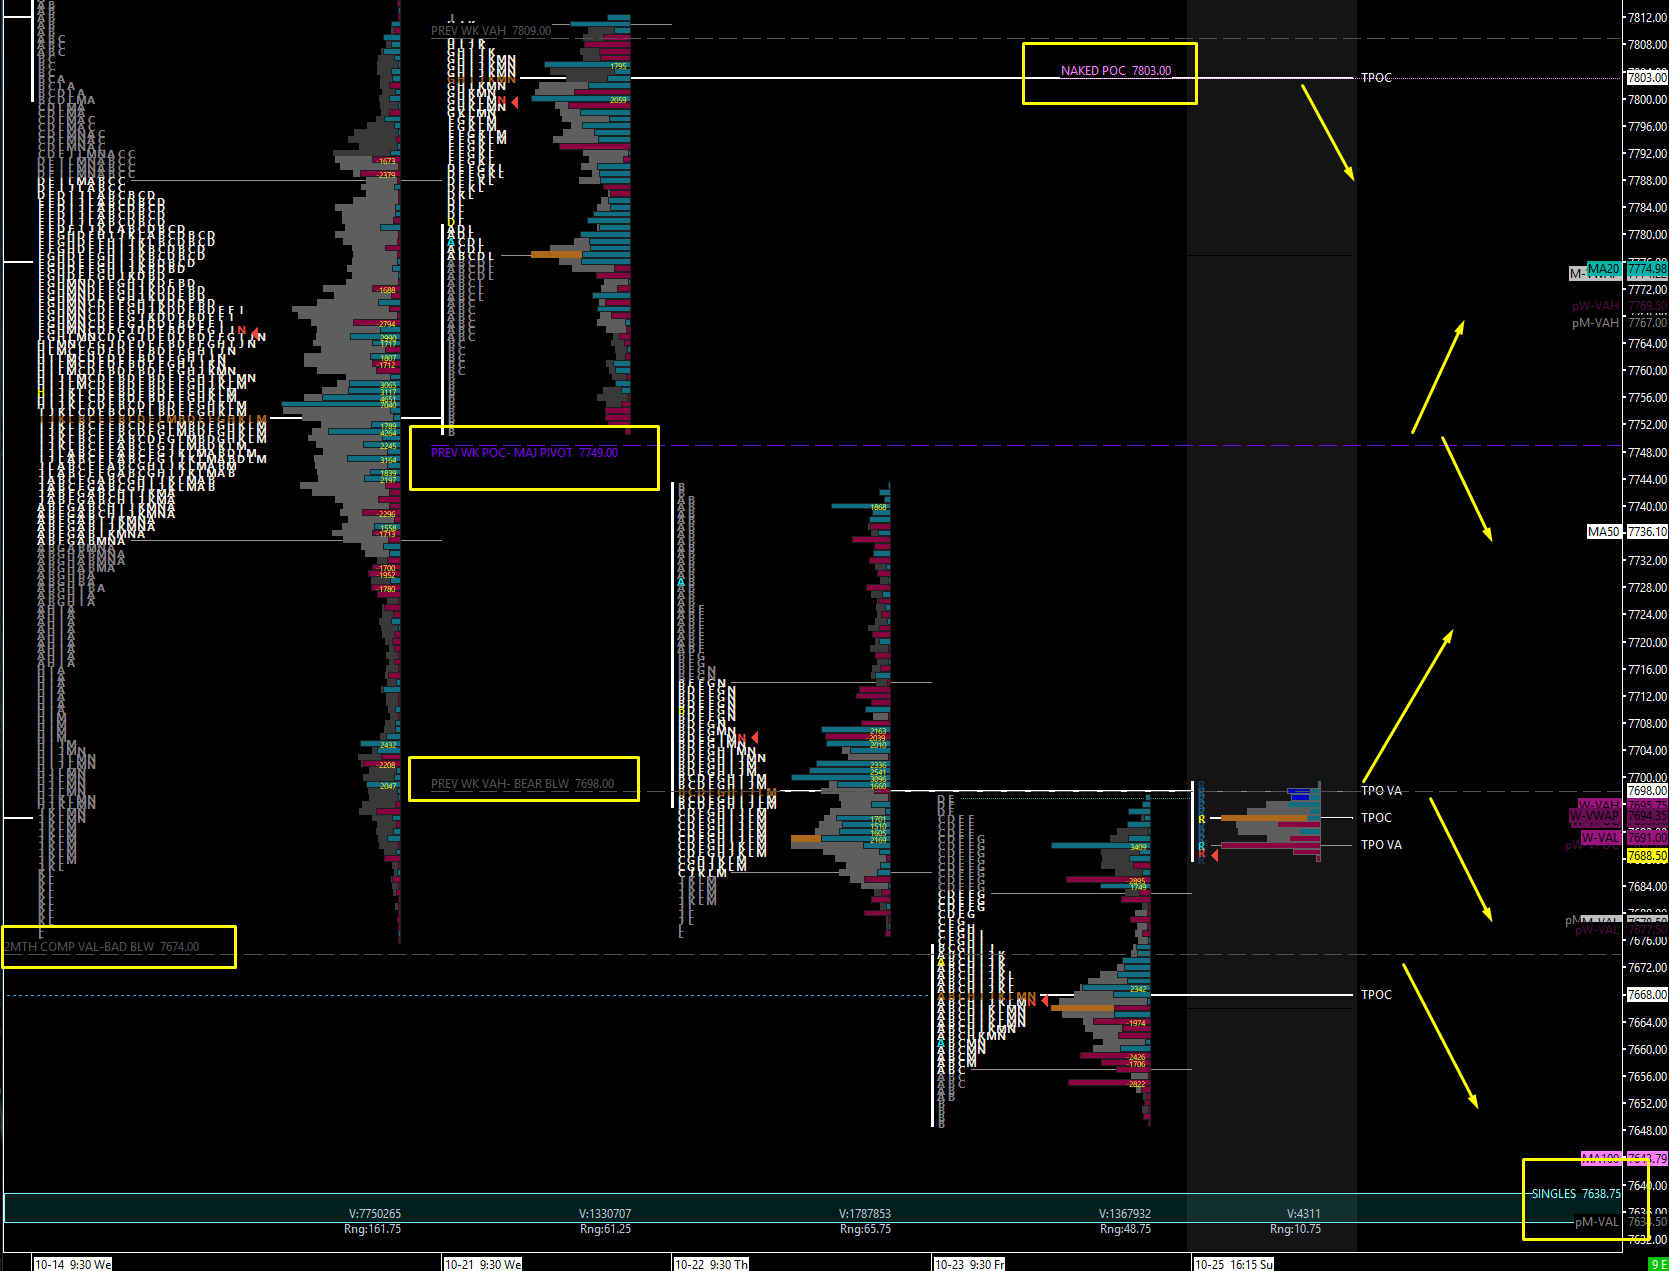
Value: Two weeks combined into a monster composite of overlapping value. The two-month composite value area low at 7674.00 lines up perfectly with our big Weekly at 7673.00 — below it, things look grim. The previous weekly value area low at 7698.00 is our bull/bear line, lining up with Thursday’s point of control at 7697.00.
Inefficiencies: The daily profile has singles all the way down to 7634.00, and there is huge excess on the weekly profile at 7547.00. There is a lot of imbalance down there that will more than likely get flushed out.
Trend: Pointed down on all timeframes. When we are pointed down, my process tells me not to take longs — I am only looking for shorts. That can squeeze first, but the lean is clearly to the downside.
🧠 Current Market Context
The Higher-Timeframe Picture: Lost on the Weekly Once Again
I am still very much leaning to the downside. We have lost on the Weekly timeframe once again, and the close below 7673.00 tells me exactly where we are headed: I am looking for our weekly target to be below 7575.00, and I will continue to look for this target until we get it. All last week I was calling for a target, and we came pretty stinking close. It doesn’t have to be in a straight line — I really think it is possible for us to get a little pop, maybe even a squeeze, and play with people’s heads a bit. But ultimately, this is where my process tells me we should end up before it is over.
The higher-timeframe line in the sand has not changed: as long as we are underneath 7803.00, we remain bearish, and that continues to be the theme of the week. I don’t anticipate them getting all the way back up there, but from a higher-timeframe perspective, that is where things either break to the upside or the downside. Closer to home, the previous weekly value area low at 7698.00 is the trigger — getting back above it is what could squeeze us all the way back into the previous week’s point of control at 7749.00 and the huge 7753.50 Daily. Continue below the 7698.00 area and ultimately below the 7674.00 composite value area low, and we take the next stage down. The daily singles down to 7634.00 are one of our ultimate big targets from the daily timeframe — a big inefficiency that needs to get cleaned up, and we are so close to it now that I think it can happen.
I also want to point out the 100-day moving average. I don’t really care about moving averages on their own — the only reason I watch them is because the big players do: hedge funds, CTAs, etc. What I care about is when they line up with one of our levels, and the 100-day lines up perfectly with 7644.00. That confluence, along with SPX playing its Weekly flawlessly, is exactly why the Sunday pop did not surprise me. We are not the only ones watching these massive levels, so a squeeze from here is possible — just know we are still pointing to the downside.
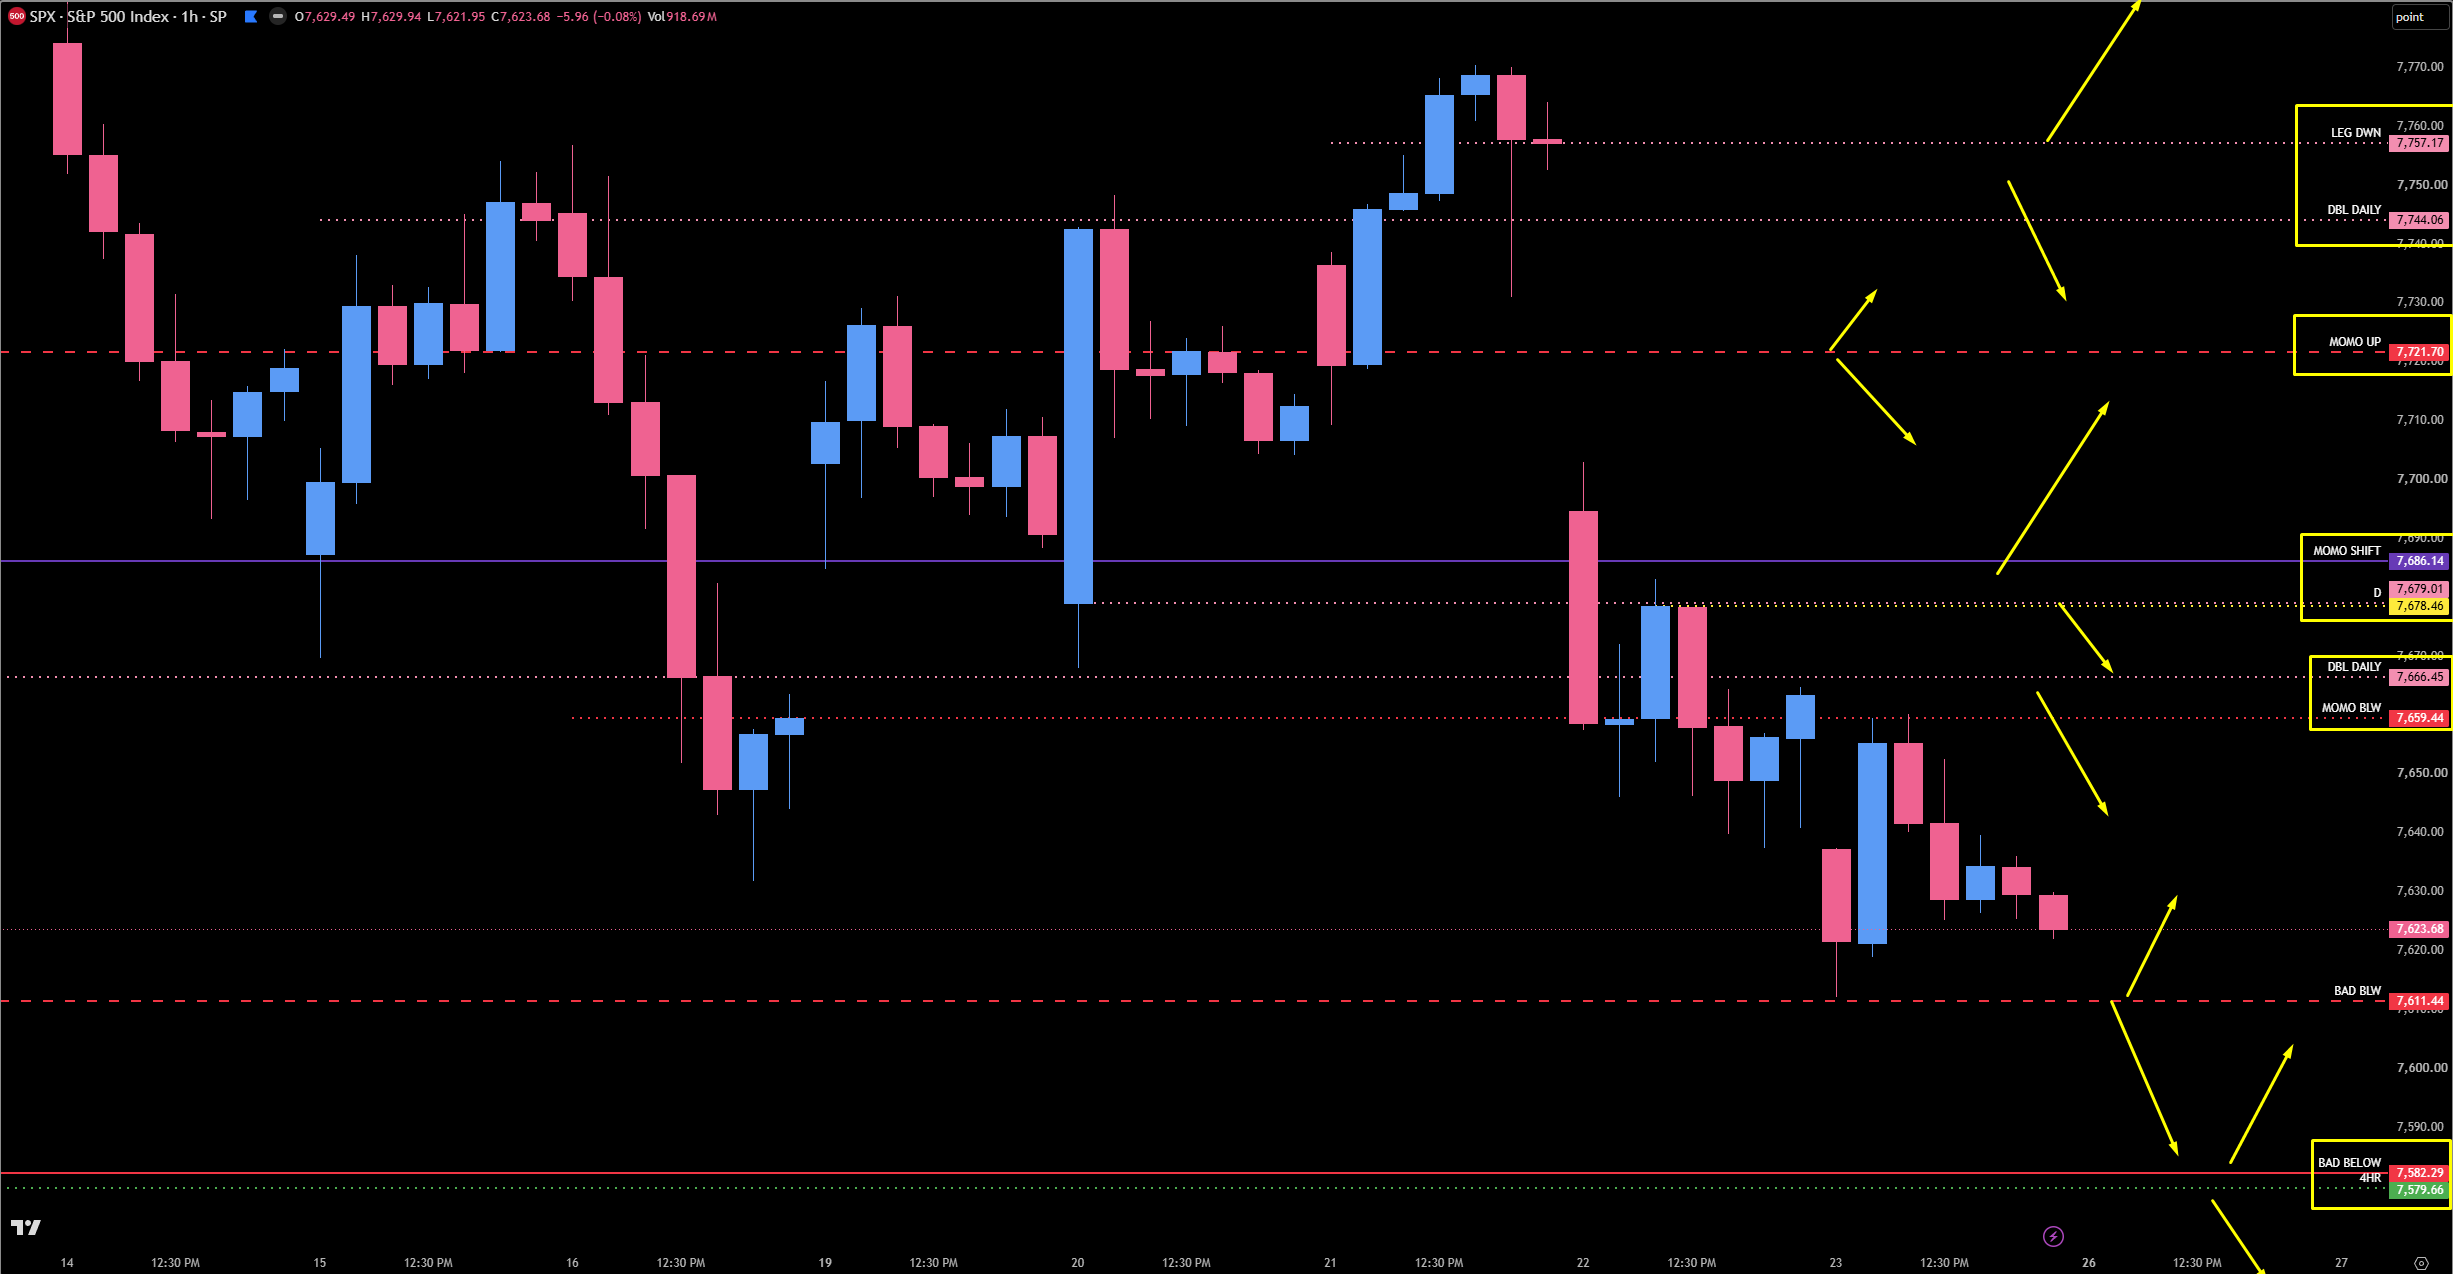
SPX: The 7611.44 Weekly & The 7686 Momentum Shift
SPX is down on the Weekly, Daily, and 4-Hour timeframes, telling us we can still move lower. However, we have to be very careful: the Weekly at 7611.44 is very significant. Friday’s low played it to the tick and popped us right up into our Daily at 7659.44, which then let us down 35 points into the lows. I’m not saying this Weekly holds the whole market up, but it is significant enough that if they want to hold it, maintaining here at least temporarily is certainly possible. We’ll see where we open.
On the resistance side, the Daily at 7666.45 was a huge pivot not once but twice — the must-hold level that played for well over 100 points a few weeks ago and then again last Tuesday for well over 110 points. It is still very much untested and we will not take it for granted. If price moves back up and plays 7666.45, I am looking to get short — essentially a 7-point stop that could pay well over 30–40 points or more on continuation lower. Above that, we have one more giant area: a Daily/1-Hour level that aligns beautifully with the monster untested Monthly at 7686. This is our big momentum shift pivot. Anything above 7686 (call it 7685 for giggles) and we start to squeeze, potentially all the way back up to 7721 or even higher into our highest, most untested levels at 7744 and 7757. That is a highly reactionary area and I will be looking to short it without a doubt — but once we are above the Monthly, we have upside momentum and need to be very concerned about shorts. The Bears just don’t have the same grip on the downside move they used to.
Below, the 7611.44 Weekly is labeled “bad below” because momentum shifts greatly underneath it — and now that it is very much wiped, a move below could send us into the tested Monthly at 7582, which also has a 4-Hour at 7582. That area could get a reaction, but we would want to see it play and get back above 7611.44 to even consider anything — and more than likely 7611.44 becomes a big stonewall. Our last and final spot is the leg to the all-time high at 7551, both a 4-Hour and a Daily. It looks very attractive, but by then we have moved below all of our massive momentum shift levels, so we would have a bearish lean and need to be very careful playing longs. That said, the best squeezes come in bear markets. Conditional Long: if 7551 plays, take big profits at 7582 (roughly 30 points) and look for runners into 7611.44 for another 30 — a potential 60-point trade with a 30-point first target. Use VIX as your tell. Below 7551, it gets very hairy, very fast: there is nothing left untested until 7464, which is a real possibility. I am expecting lower — no question about it — but that doesn’t mean we can’t squeeze first, and I see no reason we can’t eventually get down to 7551.
🚨 VIX Analysis: The 17.50 Bull/Bear Line
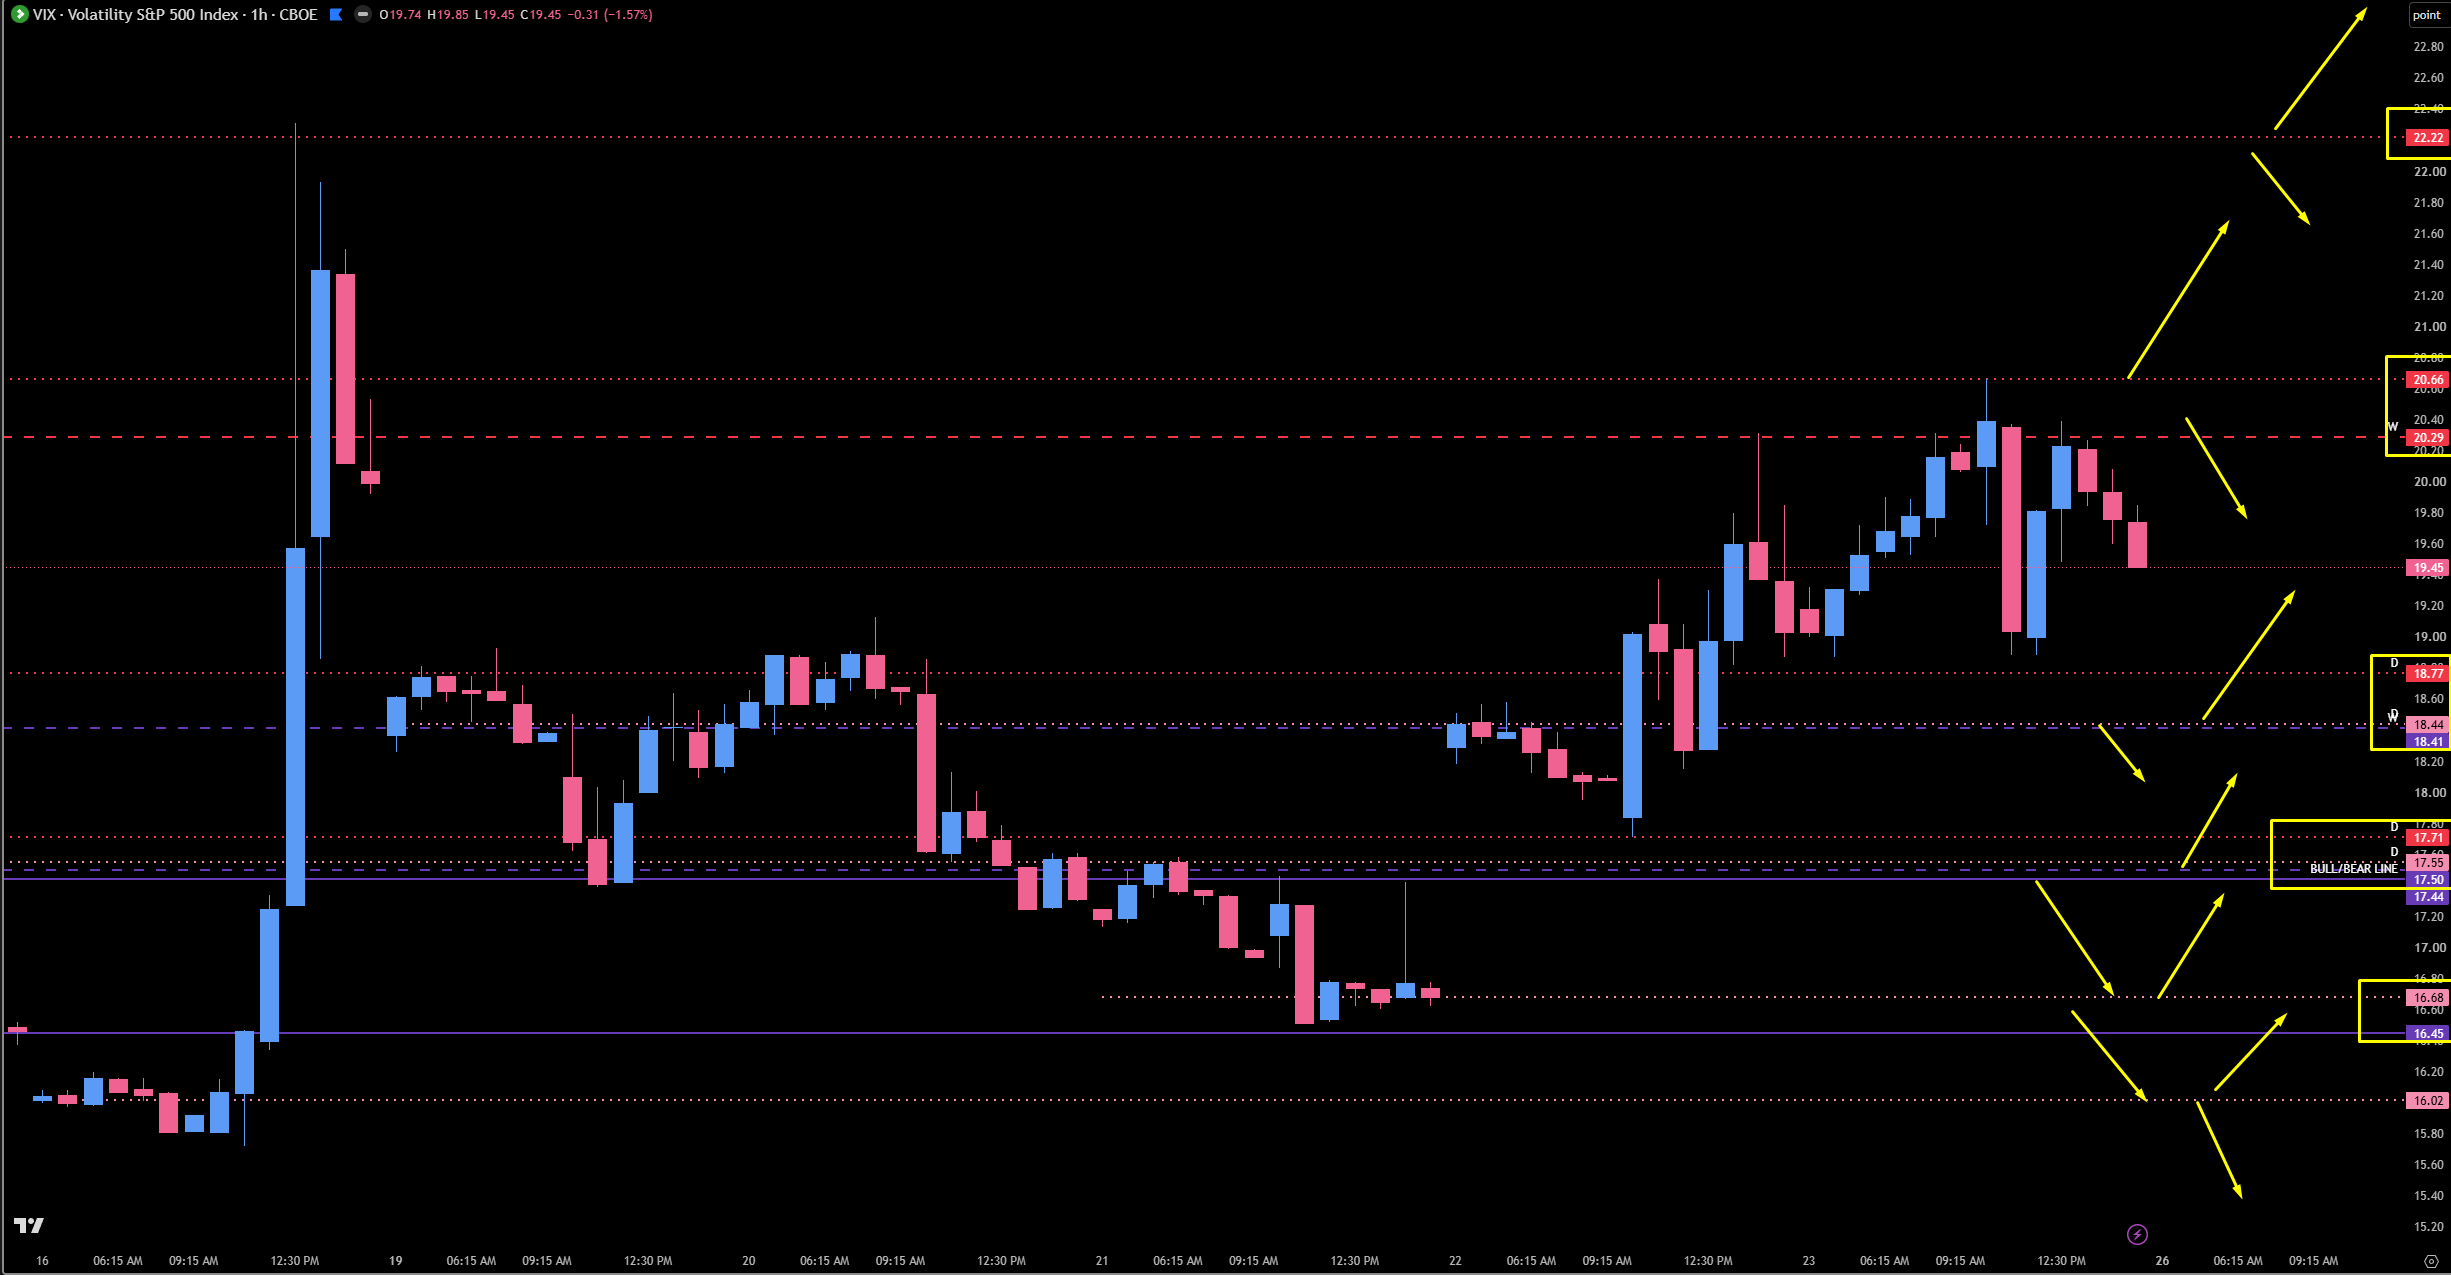
As promised, we always start with VIX — and VIX had a fantastic week. The level we have watched for quite some time is 17.50, our true bull/bear line. I have said over and over again that we are inherently bullish on the indices below 17.50 and bearish above it. We stayed above 17.50 for most of the week, which gave us our nice little pullback. We tinkered with the 18.41 spot, and 18.77 ended up being the big breakout pivot that took us right up into our 20.29 Weekly on Thursday and the 20.66 Daily on Friday. With VIX still very much above 17.50 as of this writing, we remain inherently bearish on the indices. Remember — VIX is our tiebreaker.
The Breakout Pivot: 20.29 – 20.66
Looking to the left on the chart, the 20.29/20.66 area continues to get lots of love from the bottom side, and it did it once again. This is a huge momentum pivot, and 20.66 is our big breakout pivot. A push above 20.66 wipes this Daily and the highs, and VIX could go much higher — easily into the big Monthly at the 22.22 area we have been watching since the spring, which played to perfection on the last spike up. It has been a long time since we revisited that area, and I anticipate a massive reaction there. That would be a great spot to look for an inverse long on the indices if VIX does move up into it.
The Pullback Trigger: 18.41 – 18.77
The 18.41 Weekly / 18.44 Daily spot has clearly played very well multiple times and is tested. It has a Daily trigger above it at 18.77. If VIX comes down and holds 18.41 – 18.44, getting back above 18.77 is the confirmation that sends VIX squeezing much higher — a massive headwind for the indices. If we revisit this area, I have to believe VIX eventually moves higher from it.
The Bull/Bear Floor: 17.44 – 17.71
Even lower, our 17.44 / 17.50 / 17.55 Monthly/Weekly/Daily area is tested and comes with its own Daily trigger at 17.71, which played very nicely midweek. If the 17.50 area plays and VIX gets back above 17.71 — back above support and back above a previous day’s low — VIX could squeeze right back into the levels above and much higher. Once VIX comes off these areas they don’t provide much resistance, but they provide support once back above. Keep an eye on both spots for a VIX squeeze higher.
The Relief Scenario: Below 17.50
If the indices catch a bid and VIX moves below 17.50, the whole bearish thesis is off the table. VIX relieves the pressure off the indices and gives us an opportunity to squeeze higher.
🎯 Detailed Actionable Trade Plan (ES Futures)
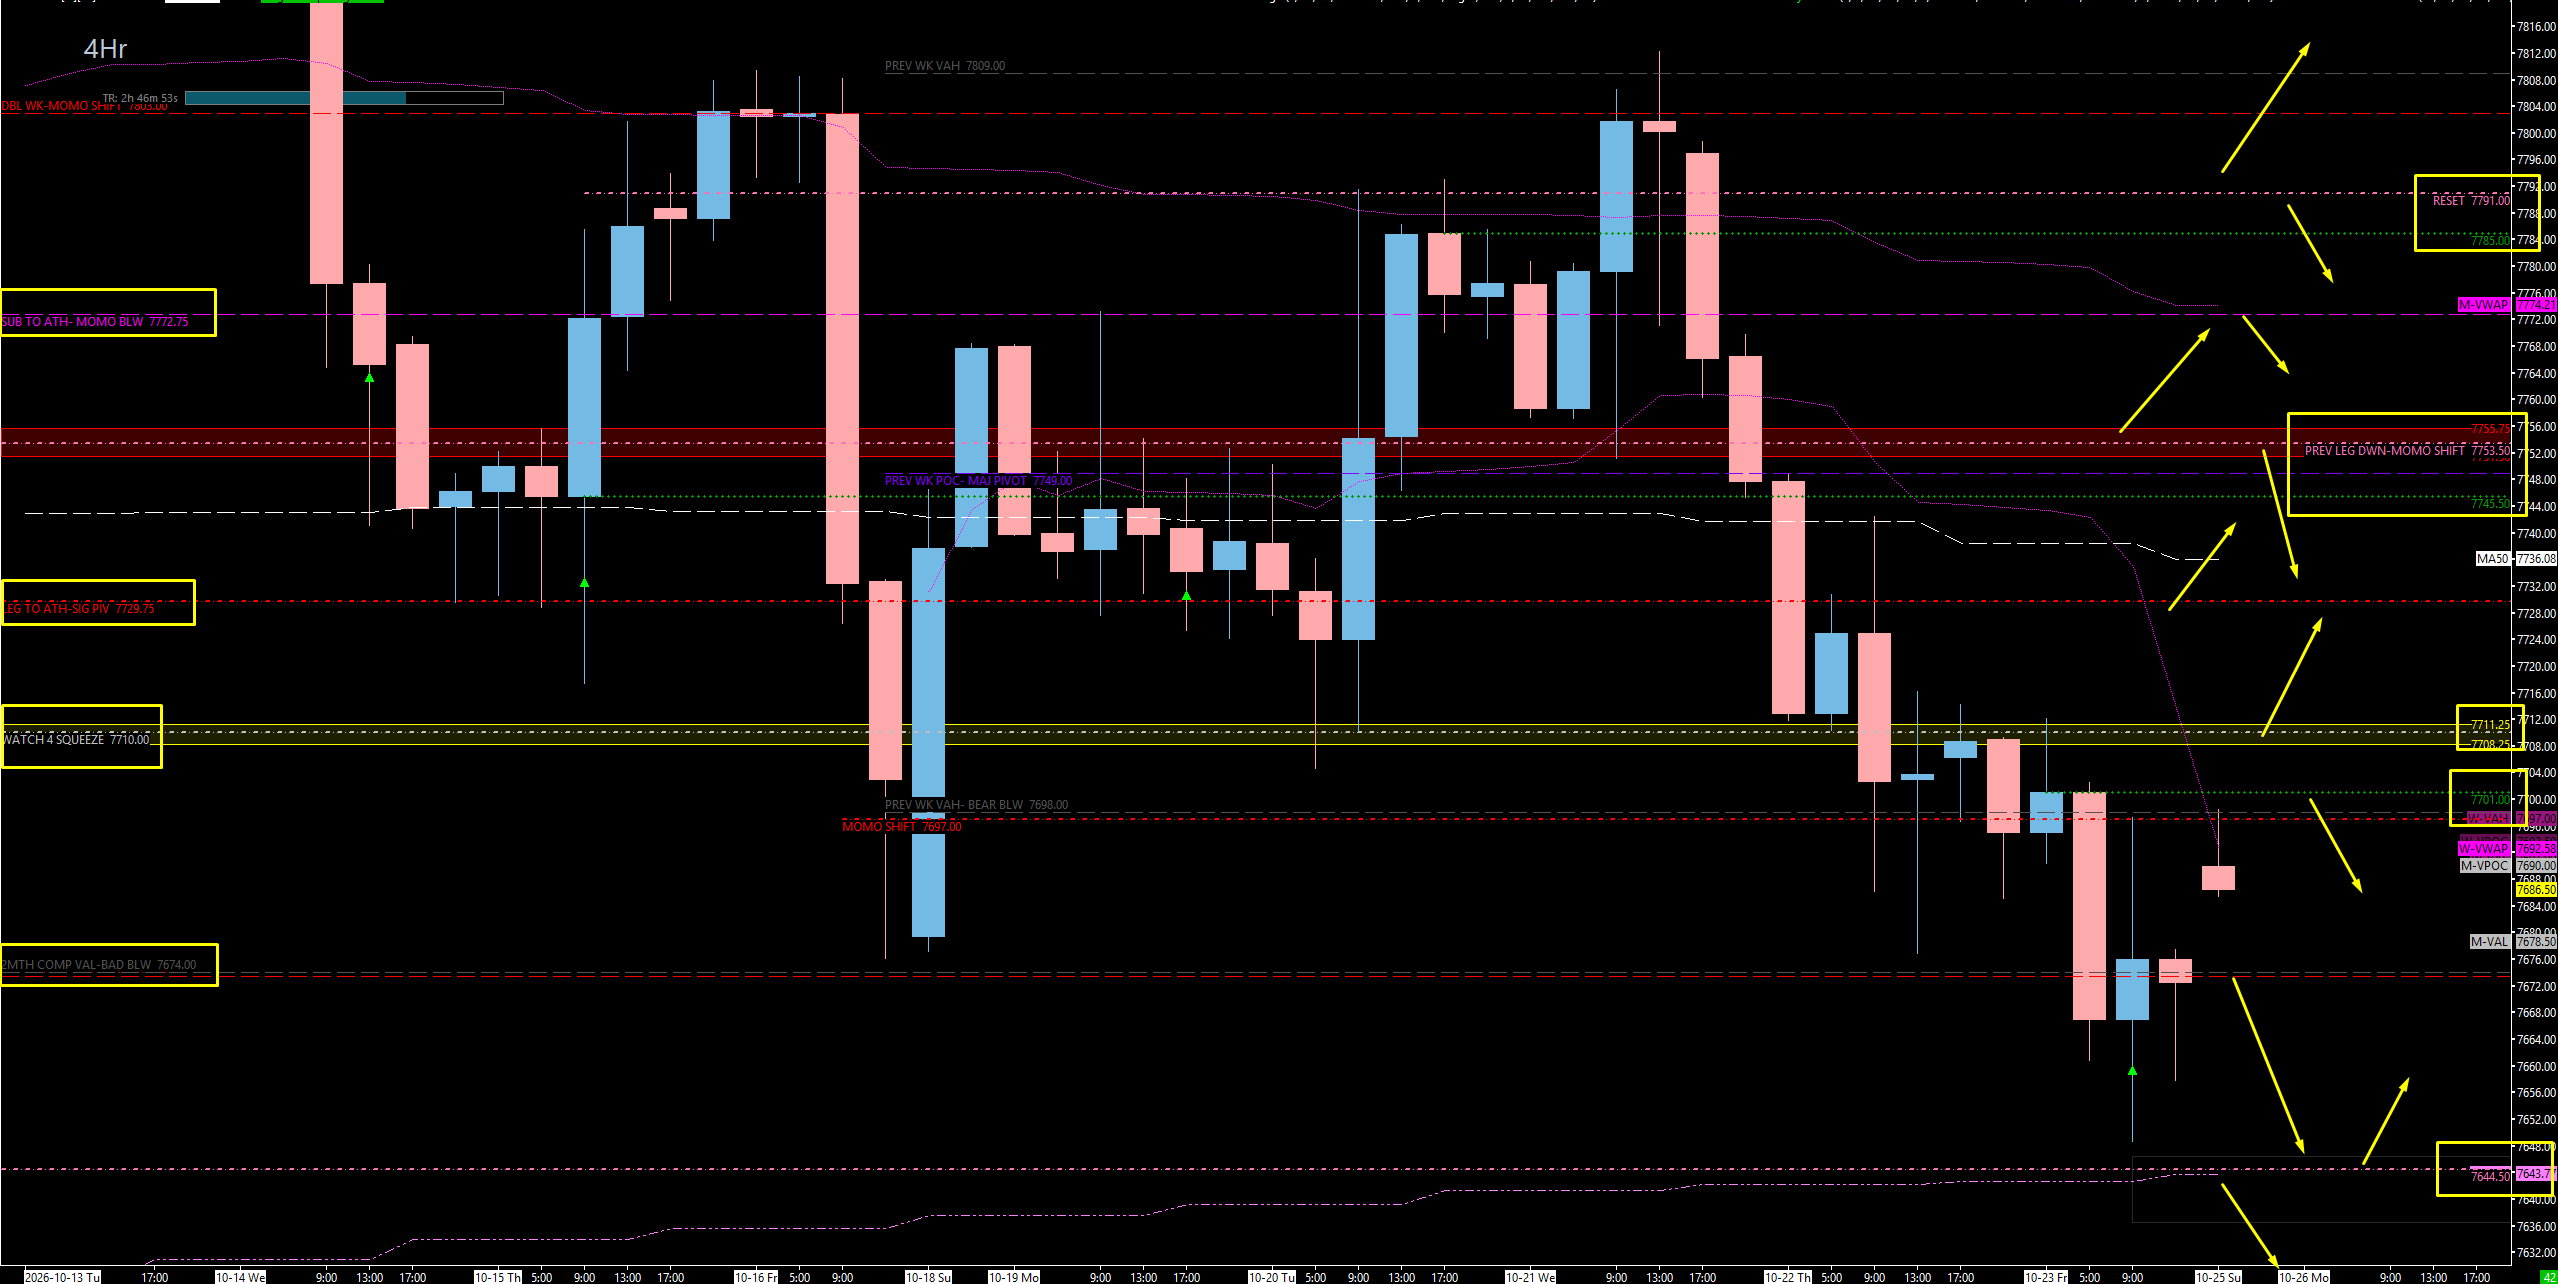
We are pointed down on all timeframes, which means I am only looking for shorts — support zones this week are profit targets, not buy spots. Our big above/below is the 7697.00 – 7701.00 stack built around the 7698.00 previous weekly value area low, with 7710.00 as the spot where things squeeze. Below 7753.50 I am very, very short; above it I am still not bullish, but I am not aggressively shorting. The higher-timeframe line in the sand is 7803.00, and our weekly target is below 7575.00.
🔴 Key Resistance Zones & Setups
The Short Trigger & Bull/Bear Line: 7697.00 – 7701.00
7701.00 (Tested 4-Hour), 7698.00 (Previous Weekly VAL / Bull-Bear Line), 7697.00 (Tested Daily / Thursday’s POC).
Context: This was right in our trade plan title — the short was 7701.00 through 7697.00, our big above/below spot. The 7698.00 previous weekly value area low is the bull/bear line and lines up with Thursday’s point of control at 7697.00, with four 1-hour opens and closes around 7701.00. The Sunday open bumped right into 7697.00 and almost grabbed 7701.00 — there is a very good chance this plays and rolls.
Actionable Setup: Short Setup: I would love to see this area play and get back below the Daily at 7697.00 for a short. Target the 7673.00 – 7674.00 Weekly and two-month composite value area low as the ultimate target, and try to ride runners lower into the Daily below. If we stay below this area, we could come down and fill Friday’s open gap pretty swiftly.
Warning: Even though this area has provided massive resistance and support, it is now very much tested — watch for a squeeze. If they push above 7701.00, be careful. If we start Monday above this stack, and really truly above 7710.00, we need to watch out.
The Squeeze Pivot: 7710.00
7710.00 (Tested Daily).
Context: A significant Daily we have watched play over and over again, and it is very tested. This is where things squeeze — we want to see price stay below it.
Actionable Setup: Below 7710.00, the short thesis stays aggressive. A push above opens the door through the tested Daily at 7729.00 and into the 7745.50 4-Hour. On shorts from above, this is your next profit target after 7729.00.
The 50-Day Alignment: 7729.00 – 7736.00
7736.00 (1-Hour / 50-Day Moving Average), 7729.00 (Tested Daily).
Context: The 7729.00 Daily was tested. The 7736.00 1-Hour aligns with the 50-day moving average — it is very clear and very clean.
Actionable Setup: I will more than likely not be taking 7736.00, because I truly believe we could squeeze into something more higher-timeframe — the 4-Hour at 7745.50. Use 7729.00 as the first profit target on shorts from above.
The Prime Short Zone: 7745.50 – 7753.50
7753.50 (Daily / Big Midpoint Pivot), 7749.00 (Previous Week’s POC), 7745.50 (Untested 4-Hour).
Context: 7745.50 is the big 4-Hour we were waiting for on Thursday that missed us by 3 points — without a doubt still very much untested. The 7753.50 Daily is our big midpoint pivot; it has played so nicely so many times it is ridiculous, it is once again untested, and it aligns perfectly with the previous week’s point of control at 7749.00.
Actionable Setup: Short Setup: Look for this area to play and get back below 7745.50 — and back below Tuesday’s high, which is our trigger. If they push into the 7753.50 Daily, you know what to do: get back below 7745.50 and Tuesday’s high as we continue our progression down. Profits into 7729.00, profits into 7710.00, ride runners down.
Warning: As long as we stay below 7753.50, I am very, very short. Above it, I am still not bullish, but I am not aggressively shorting like I would be below 7753.50 and ultimately below 7710.00. Use caution once we poke above.
The Monthly Value Zone: 7772.00
7772.00 (Untested Weekly), with the monthly VWAP and the previous week’s value area high in the same area.
Context: A very significant area — this is the monthly value. There is a lot of confluence here and some beautiful touches, with a clean smack and a clean pop off this area before. Don’t ignore it.
Actionable Setup: Watch for this area to play — it could get a reaction.
The Highest Untested Daily: 7785.00 – 7791.00
7791.00 (Daily), 7785.00 (Daily).
Context: Our last and highest untested area. This level has played true so many times — we shorted it last Tuesday, once and maybe twice.
Actionable Setup: Short Setup: A prime reaction area to look for shorts if we get all the way up here.
The Higher-Timeframe Line in the Sand: 7803.00
7803.00 (Higher-Timeframe Bearish Line).
Context: As long as we are underneath 7803.00, we remain bearish. This is the big higher-timeframe spot where things either break to the upside or the downside.
Actionable Setup: I don’t anticipate them getting back up here. Above 7803.00 they could break higher — do I think that happens? No. But anything is possible.
🔵 Key Support Zones & Setups
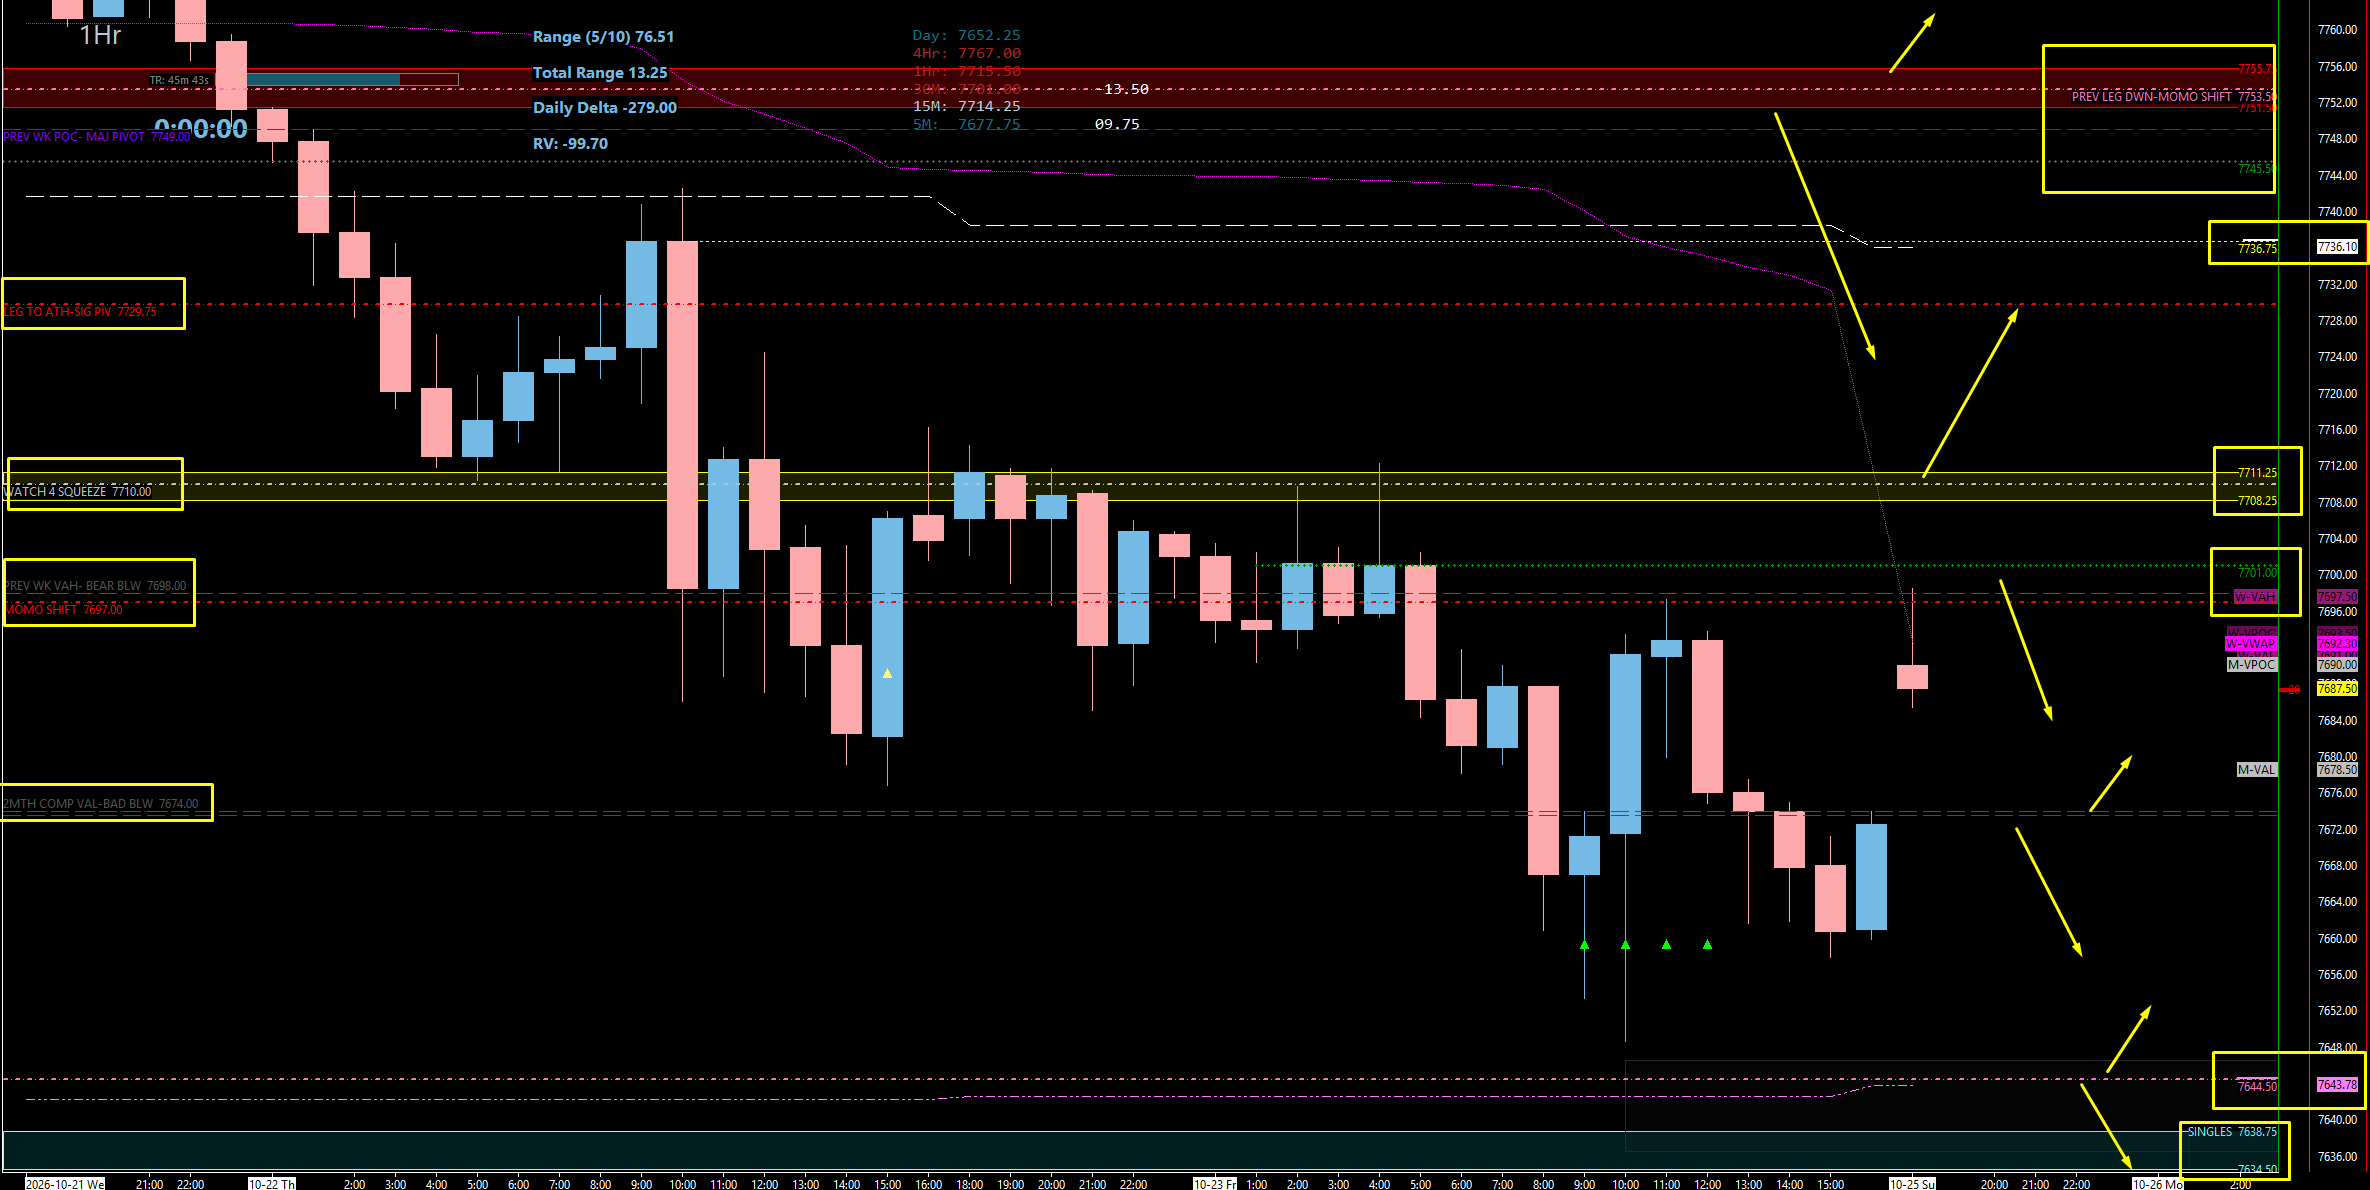
The Big Weekly & Two-Month Composite VAL: 7673.00 – 7674.00
7674.00 (Two-Month Composite Value Area Low), 7673.00 (Weekly).
Context: This is the line where our antennas go up and we get cautious on shorts. The weekly close below 7673.00 is what points us to our weekly target, and it lines up perfectly with the two-month composite value area low. Below this Weekly, things look rough in general — and the market profile confirms it.
Actionable Setup: The ultimate target on shorts from 7697.00 – 7701.00. Be careful pressing shorts here — there is nothing untested for almost 45 points, so this could squeeze.
Warning: Below this Weekly and composite value area low, we have already wiped 7644.00, and there is very little left to hold us up.
The 100-Day Alignment & Daily Singles: 7634.00 – 7644.00
7644.00 (Level aligned with the 100-Day Moving Average — already wiped), 7634.00 (End of the Daily Singles).
Context: 7644.00 is our level lined up with the 100-day moving average that the big players watch, and it has already been wiped. The daily singles run all the way down to 7634.00 — a big inefficiency that needs to get cleaned up.
Actionable Setup: A profit target, not a long. The singles to 7634.00 are one of our ultimate big targets from the daily timeframe.
The Tested Daily: 7621.00
7621.00 (Tested Daily).
Context: This Daily was ultimately tested. I have it on watch and it could provide a reaction — just not something I’m interested in buying myself.
Actionable Setup: Use it as a target only. I will be taking profits into this area — no longs here while we are pointed down on all timeframes.
The Weekly/Monthly Combo: 7596.00 – 7599.00
7599.00 (Big Weekly), 7596.00 (Monthly).
Context: The big Weekly at 7599.00 goes with the Monthly at 7596.00 — another big weekly area that also shows up on the weekly profile.
Warning: It is really ugly below this. I’m just going to be frank with you — really ugly.
The Weekly Target: 7575.00
7575.00 (Weekly Target).
Context: With the weekly close below 7673.00, my process tells me our weekly target is below 7575.00.
Actionable Setup: A runner target. I will continue to look for it until we get it.
The Weekly Excess: 7547.00
7547.00 (Weekly Profile Excess).
Context: Huge excess on the weekly profile — a lot of imbalance that will more than likely get flushed out.
Actionable Setup: As long as we stay below 7710.00, I think we can easily come down and fill that excess at 7547.00.
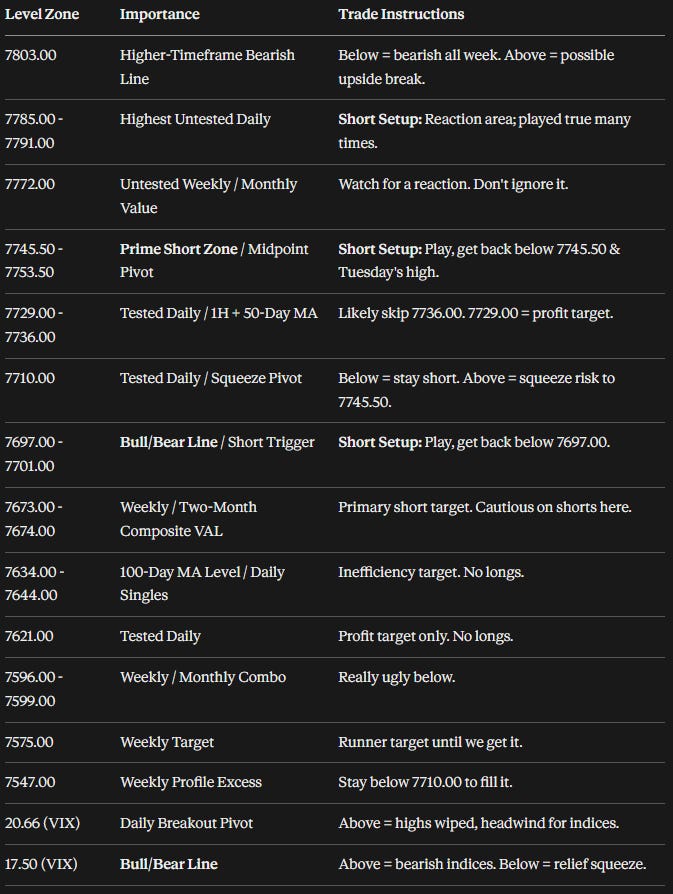
📌 Cheat Sheet – Key Levels Recap
🧠 Final Thoughts
We are pointed down on all timeframes, and I am still very much leaning to the downside. My process is simple: when we are pointed down, I am only looking for shorts. The weekly close below 7673.00 puts our target below 7575.00, and I will keep looking for it until we get it — but it doesn’t have to come in a straight line, and a squeeze first would not surprise me one bit. Your make-or-break levels are the 7697.00 – 7701.00 short trigger and bull/bear line, the 7710.00 squeeze pivot, and the 7753.50 midpoint — below it I am very, very short. On SPX, watch the 7611.44 Weekly underneath and the 7686 momentum shift overhead. And keep your eyes on VIX — above 17.50 we stay inherently bearish, and a reclaim of 18.77 or 20.66 only adds fuel. Be patient, let the levels play and prove themselves, and take your edges where the plan tells you to.
These levels should carry us into Monday and even Tuesday, and I’ll keep you dialed in on the intraday setups through the trade plan. Last week was incredible — we had people on the free trial and in the Inner Circle who made enough to pay for the Inner Circle for ten years. If you are a Trade Plan subscriber and you are not in the Inner Circle, hit me up and I’ll get you in on a free trial. It’s a good crew, we have a good time, and we print cash like it’s our job — because it is. I’ll see everybody in the room at 8:30 a.m. Monday and at 5:30 for the post-market breakdown. Enjoy the rest of your Sunday and go touch some grass.
Until next time—trade smart, stay prepared, and together we will conquer these markets!
Ryan Bailey, VICI Trading Solutions.
📊 Indicator String
Copy and paste the levels below into your S&P Edge Levels indicator to automatically plot today’s key levels on your chart:
7791.00|D|D
7785.00|D|D
7772.00|WK|W
7753.50|D|D
7745.50|4HR|4H
7736.00|1HR|1H
7729.00|Tested D|TD
7710.00|Tested D|TD
7701.00|Tested 4HR|T4
7698.00|P.W. VAL|GD
7697.00|Tested D|TD
7673.00|WK|W
7621.00|Tested D|TD
7599.00|WK|W
7596.00|MO|M


