
The 30-Year Market Pattern Nobody Wants to Talk About Right Now
Historical data across 8 midterm election cycles reveals a stunning — and uncomfortable — playbook for what could be coming in 2026.

If you’ve been trading long enough, you develop a healthy respect for patterns. Not because the market is scripted — it’s not — but because human behavior tends to repeat, especially when the same catalysts show up on a predictable schedule.
And right now, we’re staring directly at one of those catalysts.
2026 is a midterm election year. If that doesn’t immediately put you on alert, it should. Because going back 30+ years and spanning eight completed midterm cycles, the S&P 500 has followed a remarkably consistent script: sell off hard, scare everyone out, and then claw its way back to roughly flat by year end.
I wrote about this earlier this year — that there’s roughly a 70% chance of a meaningful pullback during midterm years. Twelve out of seventeen midterm cycles since the S&P 500’s creation in 1957 have produced corrections of 10% or more. That’s not a coin flip. That’s a near-certainty.
But here’s the thing about market statistics — people forget them the moment they start losing money. So let’s revisit this with updated, real-time data off the SPX and make sure you’re prepared for what’s likely coming.

The Stat That Should Be Pinned to Every Trader’s Monitor
Here’s the headline number, confirmed across 8 completed midterm election years dating back to 1994:
Average maximum drawdown: -18.7%.
Average year-end return: +1.7%.
Read that again. The market, on average, pulls back nearly 19% during midterm years — and then finishes almost exactly where it started. If that doesn’t change the way you think about positioning in 2026, nothing will.
The Full Breakdown: Every Midterm Cycle Since 1994
Let’s put the data on the table. Every single midterm year, the president in office at the time, and what the S&P 500 actually did:
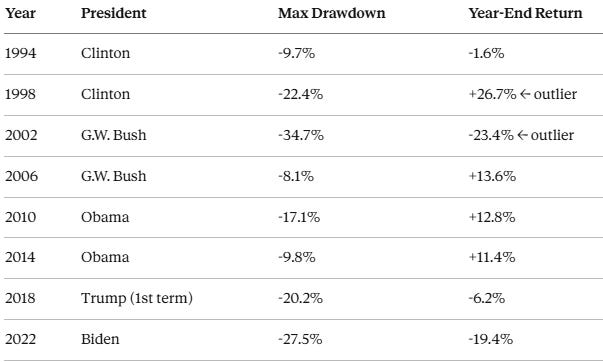
A few things jump off the page here.
It doesn’t matter who’s in office. Democrat, Republican, first term, second term — the midterm effect doesn’t care. Clinton saw a -22% drawdown. Bush saw -34%. Obama got off relatively easy with -17%. Trump’s first term delivered -20%. Biden got hit with -27.5%. The political party is irrelevant. What matters is the cycle — the uncertainty that midterm elections inject into the market.
Every single cycle produced a meaningful pullback. The mildest was -8.1% in 2006 (when we were deep in the housing boom and nobody thought the music would ever stop — spoiler alert, it did). The worst was -34.7% in 2002, amid the dot-com implosion. But the average? Almost exactly 18%.
The outliers actually reinforce the pattern. If you strip out the two extremes — 1998 (which rebounded +26.7% largely due to the late ‘90s tech mania) and 2002 (which fell -23.4% because the dot-com bubble was still unwinding) — the numbers get even tighter. Without those outliers, the average drawdown comes in at roughly -14.4% and the average year-end return sits at approximately +1.7%. The pattern holds across every market environment.
Why Does This Happen? It’s Not Complicated.
Midterm elections create uncertainty — and markets despise uncertainty above almost everything else.
The party in power almost always loses seats in Congress. Investors are left guessing about the future direction of fiscal policy, regulatory changes, tax law, and trade. Capital freezes up. Institutional money goes defensive. Retail traders panic.
But here’s the second half of that equation, and it’s just as important: once the election is over, the uncertainty evaporates — fast. Historical research from Carson Investment Research shows that the six-month period after midterm elections (November through April) is the single strongest stretch of the entire four-year presidential cycle. The S&P 500 has averaged roughly a 14-15% return in those six months alone. That’s nearly double the long-run annual average — compressed into half a year.
The pattern is clear. Sell off into the election. Rally hard once the results are in. And if you weren’t ready for the volatility, you probably sold at the worst possible time.

Where 2026 Stands Right Now
Here’s the part that should have your full attention.
As of this writing, the S&P 500 hit its all-time high of approximately 7,008 on January 28th — the same day the Fed held rates steady. Since then, the index has pulled back to around 6,632 as of March 13th.
That’s a maximum drawdown of roughly -5.4% from the high.
If the historical pattern holds, we’re potentially not even close to the bottom yet. An average midterm drawdown of -18.7% from the January high would put the S&P somewhere in the neighborhood of 5,700. Even the more conservative -14.4% average (stripping out the outliers) would take us down near 6,000.
And consider the timing: six out of eight midterm years bottomed between April and October. We’re in mid-March. If history rhymes — and it usually does — the real volatility hasn’t even started yet.
Layer in the current macro backdrop — geopolitical tensions in the Middle East driving oil prices higher, elevated valuations with the CAPE ratio still hovering near dot-com-era levels, a Fed that’s been reluctant to cut, and ongoing tariff uncertainty — and you have a cocktail of catalysts that could easily push us toward that historical average.
So What Do You Actually Do With This Information?
This is not a prediction that the market will drop 18%. Past performance doesn’t guarantee future results, and I’m not in the business of crystal ball readings. But I am in the business of preparation, and there’s a massive difference between the two.
Here’s how I’m thinking about it:
Don’t panic — prepare. The traders who get destroyed in midterm years are the ones who are over-leveraged and under-prepared. They don’t have a plan for drawdowns, so they sell at the lows and miss the recovery. Don’t be that trader.
Respect the seasonality. If the lows typically arrive between April and October, the smart play isn’t to go all-in right now hoping for a V-bounce. It’s to keep your powder dry, stay nimble, and wait for the market to show you its hand.
Understand the opportunity on the other side. This is the part most people miss. Midterm pullbacks aren’t just something to survive — they’re something to capitalize on. The post-midterm rally is one of the most consistent return windows in market history. If you’re positioned correctly heading into November, you could be looking at a very strong close to 2026 and an even better 2027.
Have a daily plan. This is exactly why we publish the S&P Edge trade plans every single day and run a live trading room — so you’re never guessing. In volatile, headline-driven markets like this, the traders with a structured plan will always outperform those trading on emotion.
The data is clear. The pattern is proven. And the clock is ticking. Whether this midterm cycle delivers a -10% correction or a -25% gut punch, the playbook says it’s coming. And just like every cycle before it, the market will eventually recover and push higher.
Your job isn’t to predict exactly when or how deep. Your job is to be ready.
Until next time—trade smart, stay prepared, and together we will conquer these markets!
Ryan Bailey, VICI Trading Solutions.