

Top of the Sunday, everyone, and welcome back. It is time for the Weekend Review, and you better believe it is time to conquer the markets again. We absolutely crushed it last week. I made some pretty outrageous calls, and we did not quite hit the big one — but we caught every single rotation, longs and shorts. And to be frank, I do not think we are done coming down.
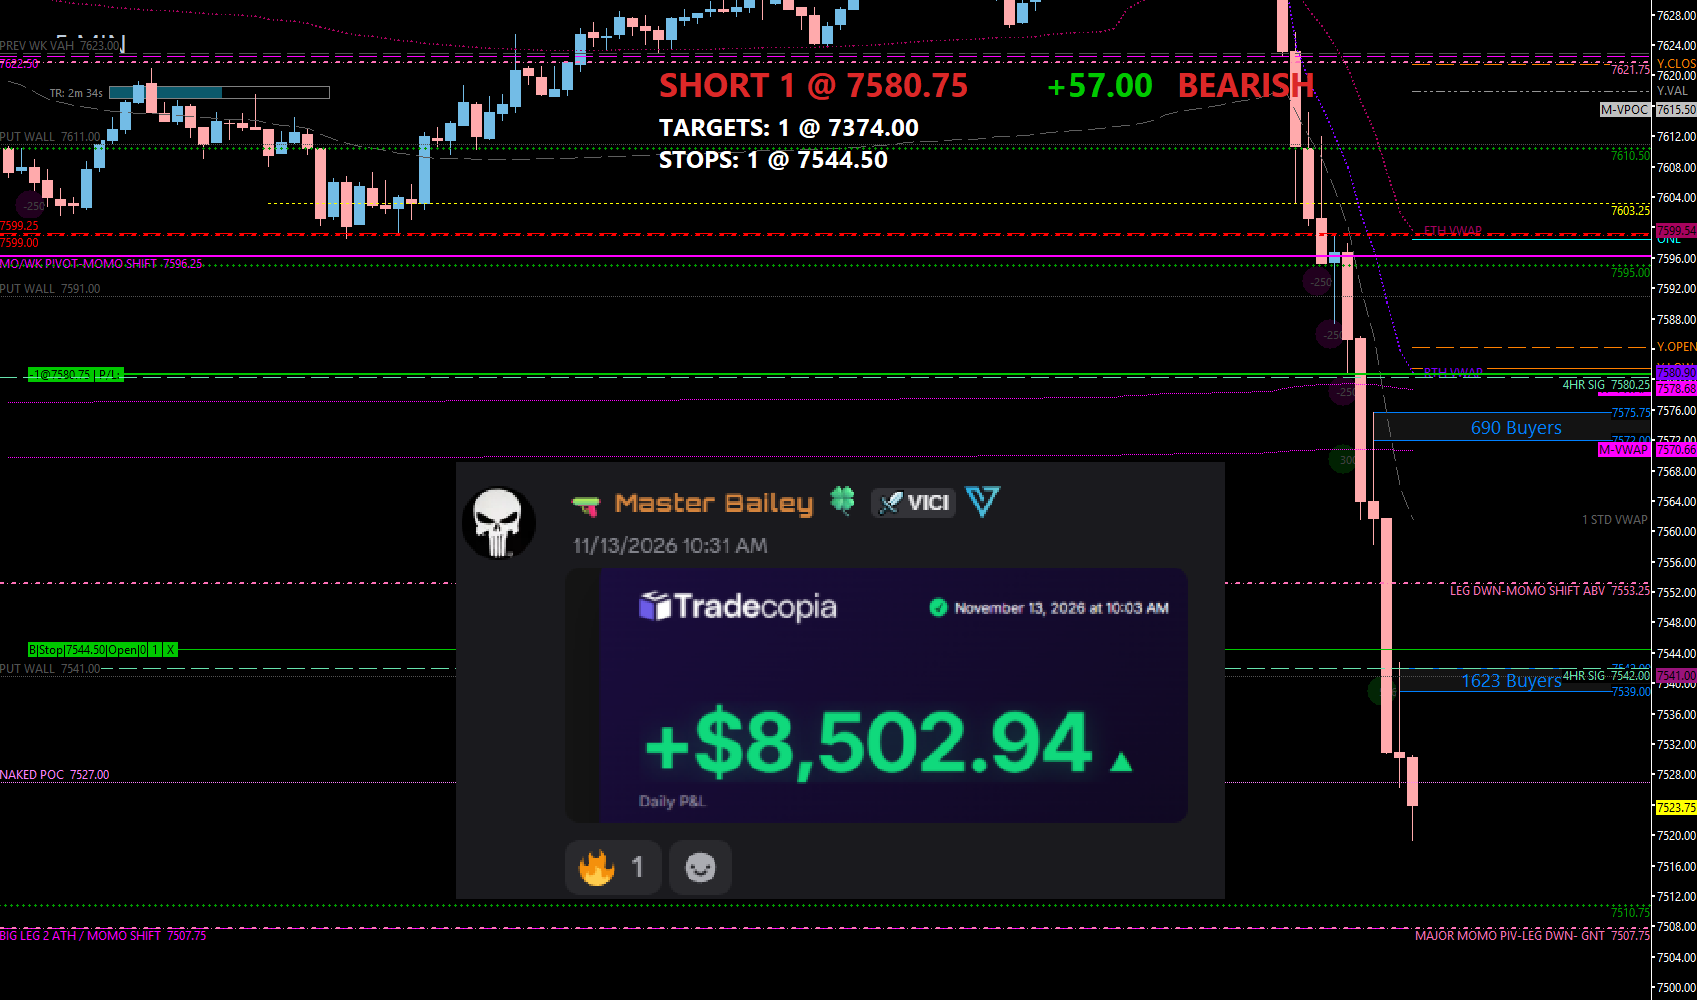
On Friday we caught the awesome short below our 7599 level, then got short again below 7580, and took it way down. My runner was up about 57 points at the 7520 low. I gave about 25 points back and stopped out around 7545 — I was really trying to give it room to go. But I was not the only one. A ton of people in the room made a ton of money on Friday, so congratulations to you guys. We called this short, we waited on it, we were thirsty for it — and it worked out exactly the way our process told us it should. We maintained our downside position, and we were paid handsomely for it.
📧 Check Your Spam Folder Follow-ups and SPX Brief emails are landing in spam. Look for rbailey@vicitradingsolutions.com and info@vicitradingsolutions.com, mark them “Not Spam,” and add them to your contacts so you keep getting them.
☕ FREE — The New & Improved SPX Morning Brief SPX value levels, 150+ indicator prediction assessments, and the day’s top news — in your inbox before the bell. Completely rebuilt and completely free. Seats are limited and they fill up fast. Get your seat now → https://go.vicitradingsolutions.com/spx-brief
A Note on This Week’s Market:
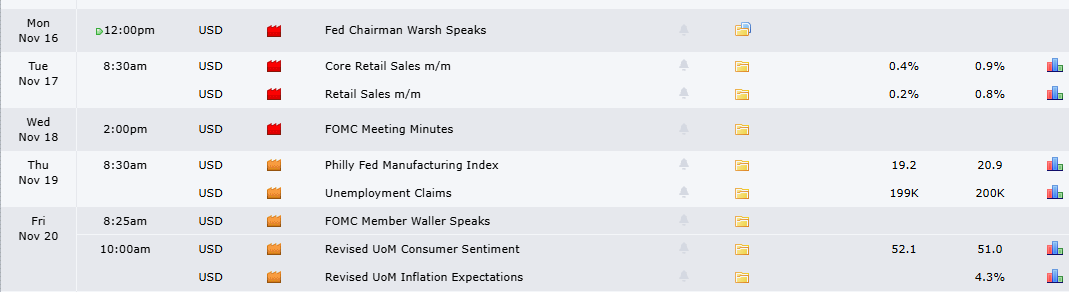
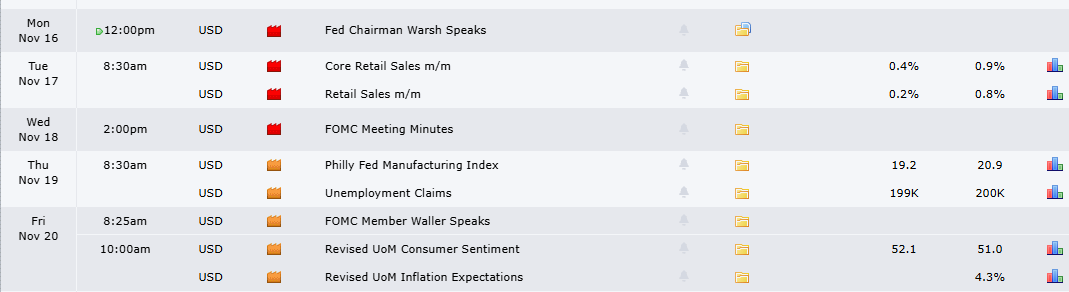
News: Friday’s PPI number delivered the smack we were expecting. I told you they would likely sit up at the highs and wait for the big news on Friday, and that is exactly what happened. The midterms are over, but the odds that these markets puke were around 75% with the midterms, and I do not think that is over yet. No specific calendar events were called out for this week — but you can never count out the bulls, and you can never count out Trump saying something crazy.
Data — History Says: These posts came out almost every single day last week, and they have been spot on. Friday’s post says we have a 74% chance of moving 0.61% higher on Monday. That is not crazy: 76 points is 1%, so we are talking about 35 to 40 points — easy, given the ranges we have had.
Range: We moved 150 points on Friday. A few months ago in the summertime, we were nudging each other to stay awake. Now they are putting up triple-digit ranges, and it feels so good to be back. This does not last forever — capitalize on the volatility. I am always looking for the banger. Nothing feels better than a home run to set your month off.
Volatility: VIX is still on the rise. As long as VIX holds above 17.50 — and especially if it marches above the 19.42 weekly — we keep a lot of pressure on the indices. I think we have a spicy week ahead.
Trend: We still have not gained on the weekly, daily, or four-hour. I am still pointed down on all timeframes. This move up accomplished absolutely nothing — zero, zilch, nada. Per the process, we are short-only.
🧠 Current Market Context
Still Pointed Down — The Move Up Accomplished Nothing
Here is how the week played out. We came down and swept the June lows after calling that killer short on Thursday, then balanced sideways. On Monday I called for a squeeze back up to the leg, and where did we go? Straight to 7600 — or as you guys know it, 7599. That was our major win. We smacked it on Monday morning, and on Tuesday it paid 100 points. When they could not give it up, I told you we would probably keep retracing higher, and on Veterans Day they squeezed like the bejesus — absolutely nuts, on low volume — all the way to the 7673.50 weekly, which we played not once, not twice, but three times before it got smacked Friday on PPI. Now, I am no genie. I do not know exactly when this stuff happens, and the progression took longer than we thought. But I still believe we take out last week’s lows and get underneath the November 5th low down around 7320, potentially early this week. My big target is still 7247.
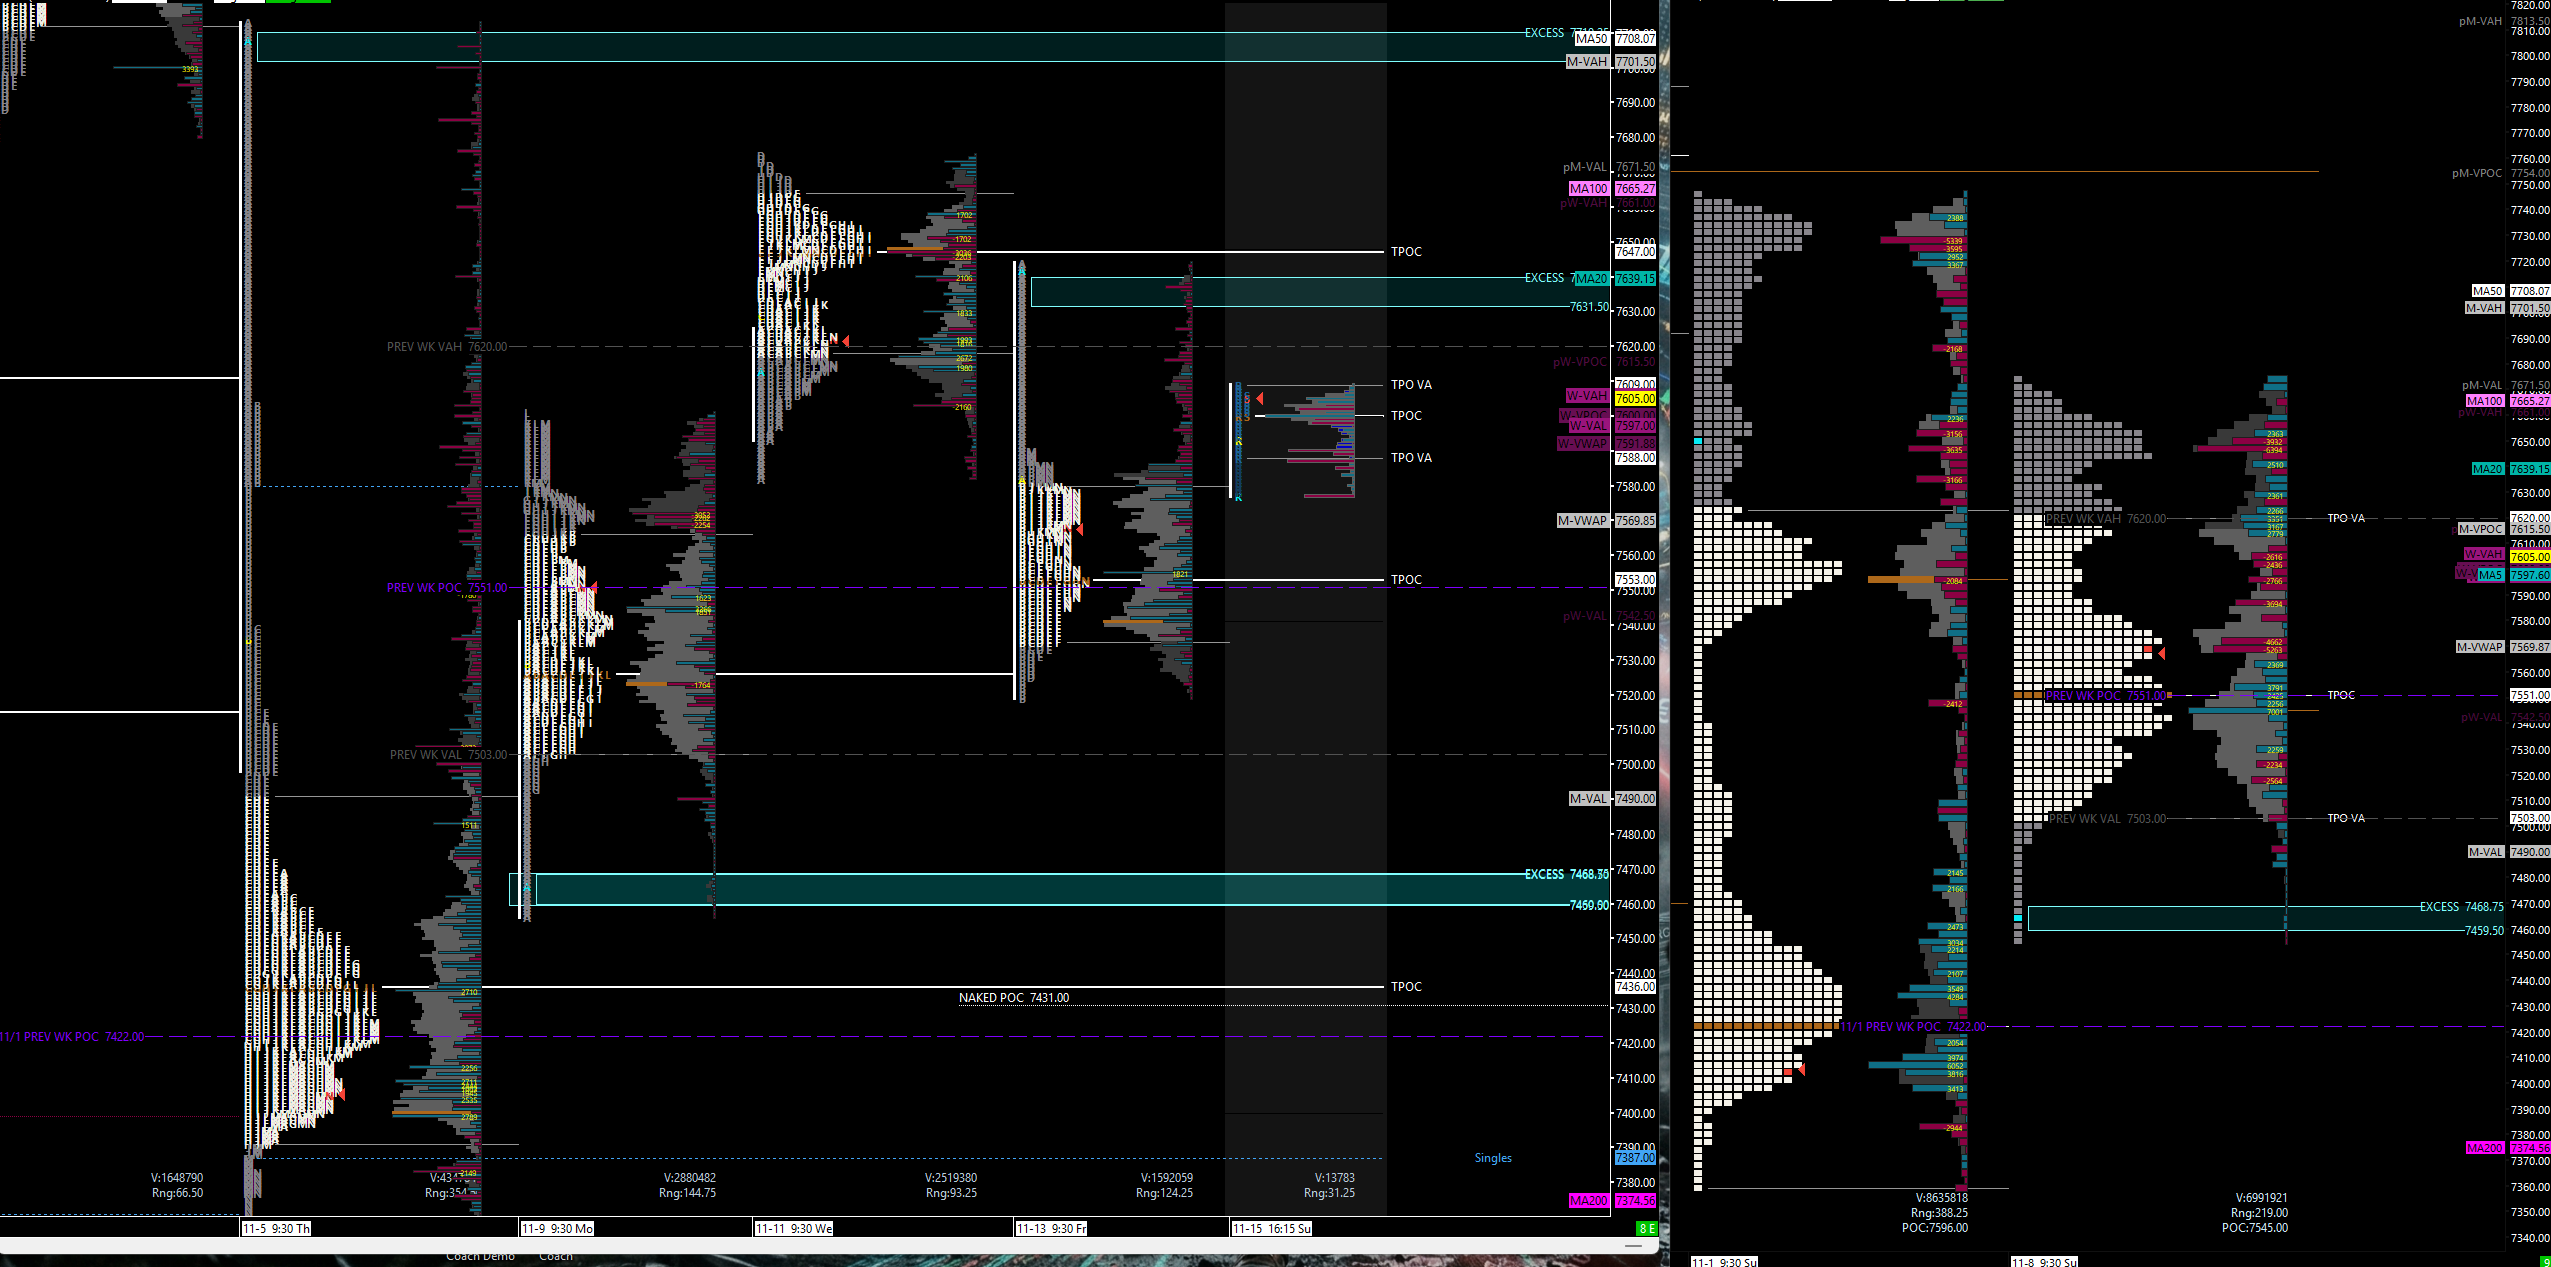
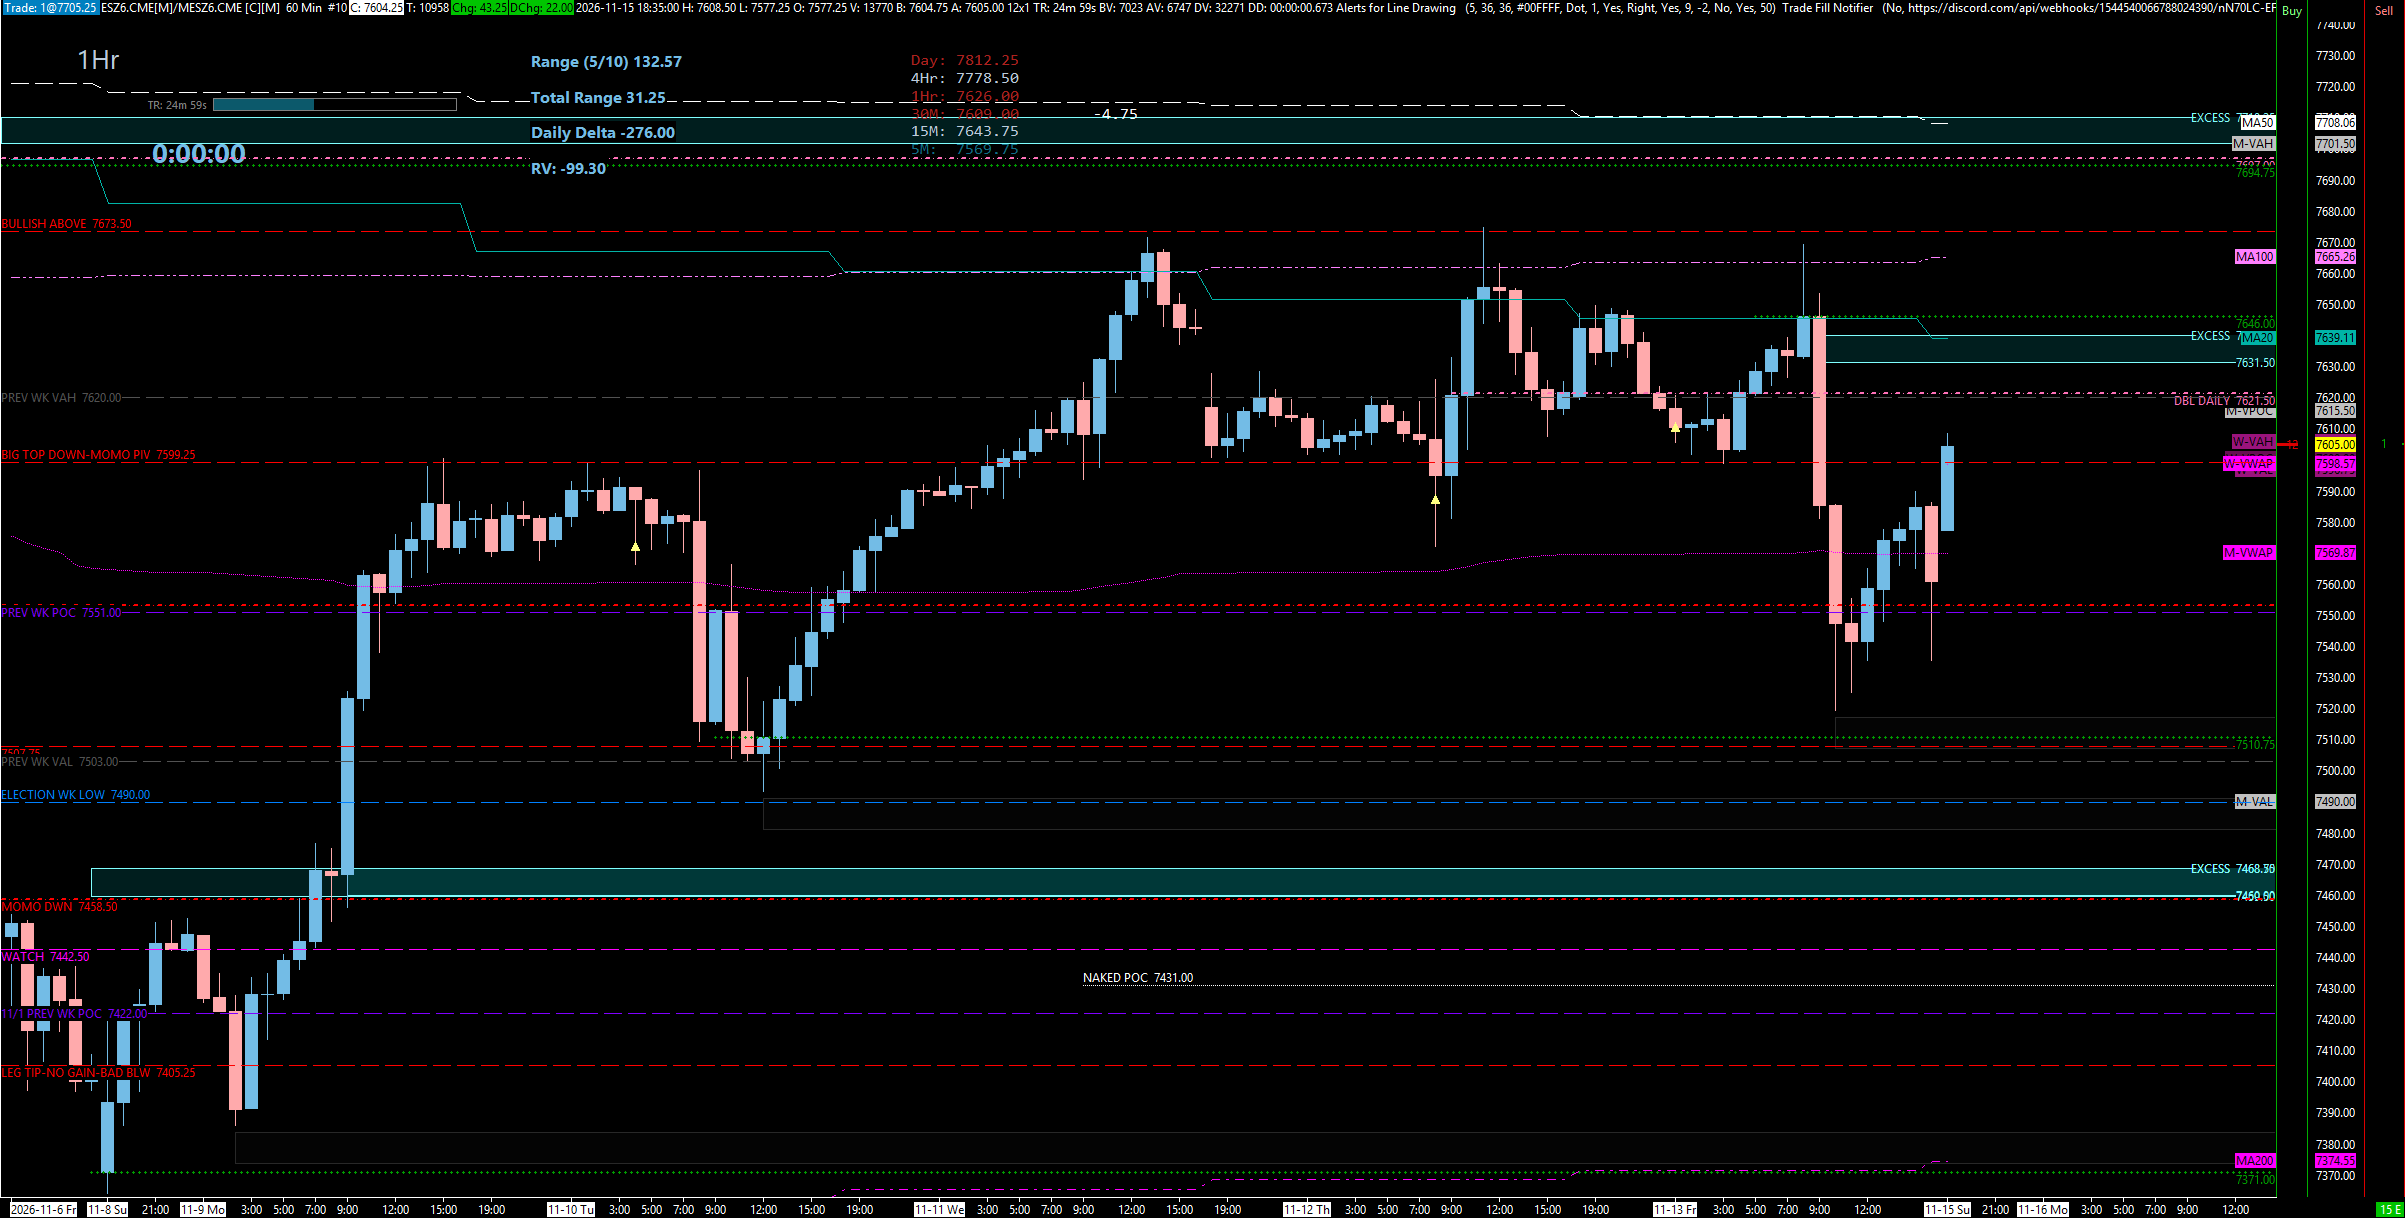
The ES weekly TPO is super clean this week. The week before had a massive inefficient area that we said needed to get filled in — and surprise, surprise, that week’s value area high and the previous week’s value area high are aligned perfectly, because we sat inside and filled it all in. Put them together, and the inefficiency is filled except for a little bit left lower. There is also excess further down on the weekly profile — price moved up very fast there, and it will more than likely get cleaned up. That is a great target for one of our shorts, and it lines up perfectly with the daily profile. Now look at the confluence. The previous weekly value area high is 7620 — lined up to the tick with our current daily leg down at 7621.50, and with the value area high from the week before. The weekly point of control is 7551, right with the 7553 daily we have been messing with for quite some time. The previous weekly value area low is 7503, right with the 7507 weekly/daily that played a couple of times last week. Below 7503 we are pretty bearish, and the tractor beam brings us down to clean up that weekly excess and into the naked point of control at 7422 — right where we started Thursday and Friday after the massive move down. The downside really begins underneath 7551, and momentum stays down as long as we are below 7620. On the daily profiles, Friday’s move down left excess all the way up to 7638, and Thursday’s left it up to 7708. Tonight we gapped up about 20 points in the first 15 minutes.
Bitcoin Is Leading — And It Looks Rough
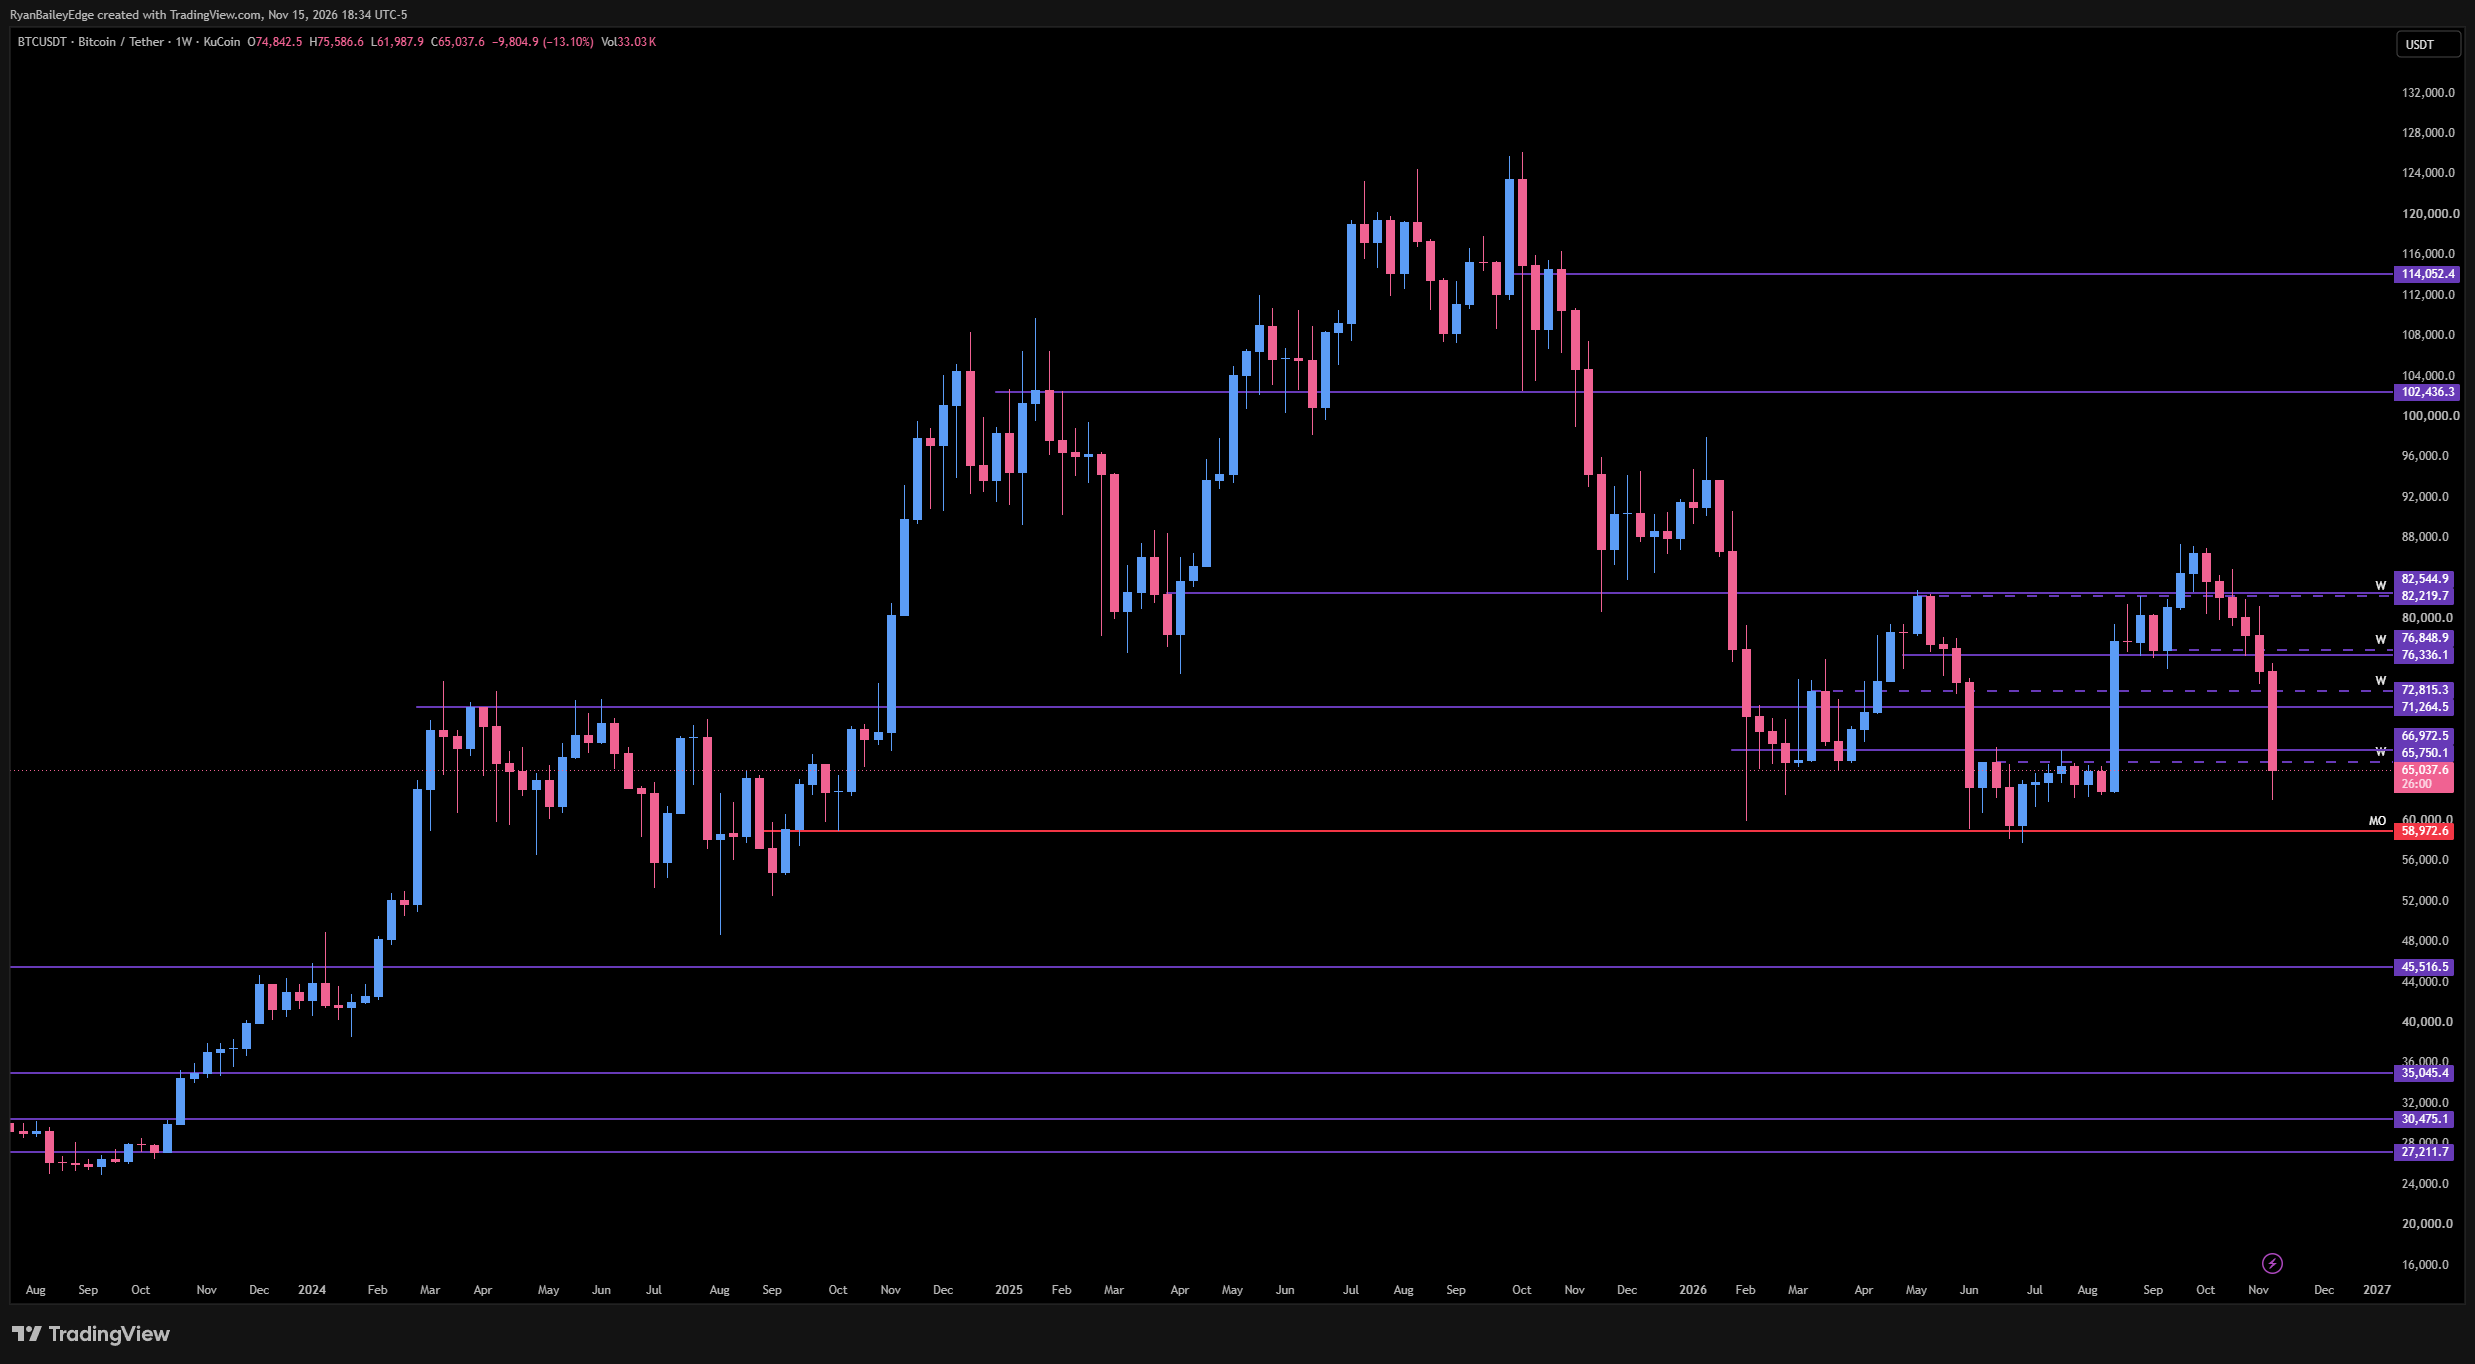
For those of you who have traded with me for a while, you know I am a Bitcoin guy. I am a Bitcoin maxi, I stack Bitcoin, and I have traded almost every cycle — I got involved when Litecoin was a dollar, Ethereum was 12 bucks, and Bitcoin was around a thousand. I have watched these cycles go up and down five times now. That $35,000 number I posted back in August is not arbitrary — I retweeted it on November 6th, and I am keeping the dream alive. Bitcoin is a high-risk asset, and when people get scared, the first thing they let go of is the highest, most volatile asset. We are also in a super cycle: it runs up, retraces its gains by about 75%, and does it all over again. I am looking to buy around $45,000, $35,000, and potentially $21,000 — and I am all about that $35,000 spot. Some of my peers were telling people to buy in the high $80,000s, and I was just shaking my head. Now Bitcoin is under $65,000 — underneath our big support at $65,750 and $66,972, call it $67,000 — and that monster spot is failing. We get a weekly close in about an hour, and it looks terrible. Even if it pops, I think it comes down further, and I am looking at $45,500. My model says that after this last pullback, we probably go to around $225,000, and the lowest we ever pull back again is about $55,000 — so the $35,000 - $45,000 range may be the last opportunity ever. My model is not perfect, and history does not repeat itself, but it does rhyme.
Here is why this matters for us: Bitcoin tracks the S&P 500 pretty well — and it actually leads. It used to lead by a couple of weeks; now it might be a month or so. Not tick for tick, but on a longer horizon, if Bitcoin keeps showing weakness over the next couple of weeks, you can be pretty sure the indices will follow — and if it gets a monster rally, the same goes the other way. I have been studying this for years. Even if you are not a crypto fan, you should be watching it.
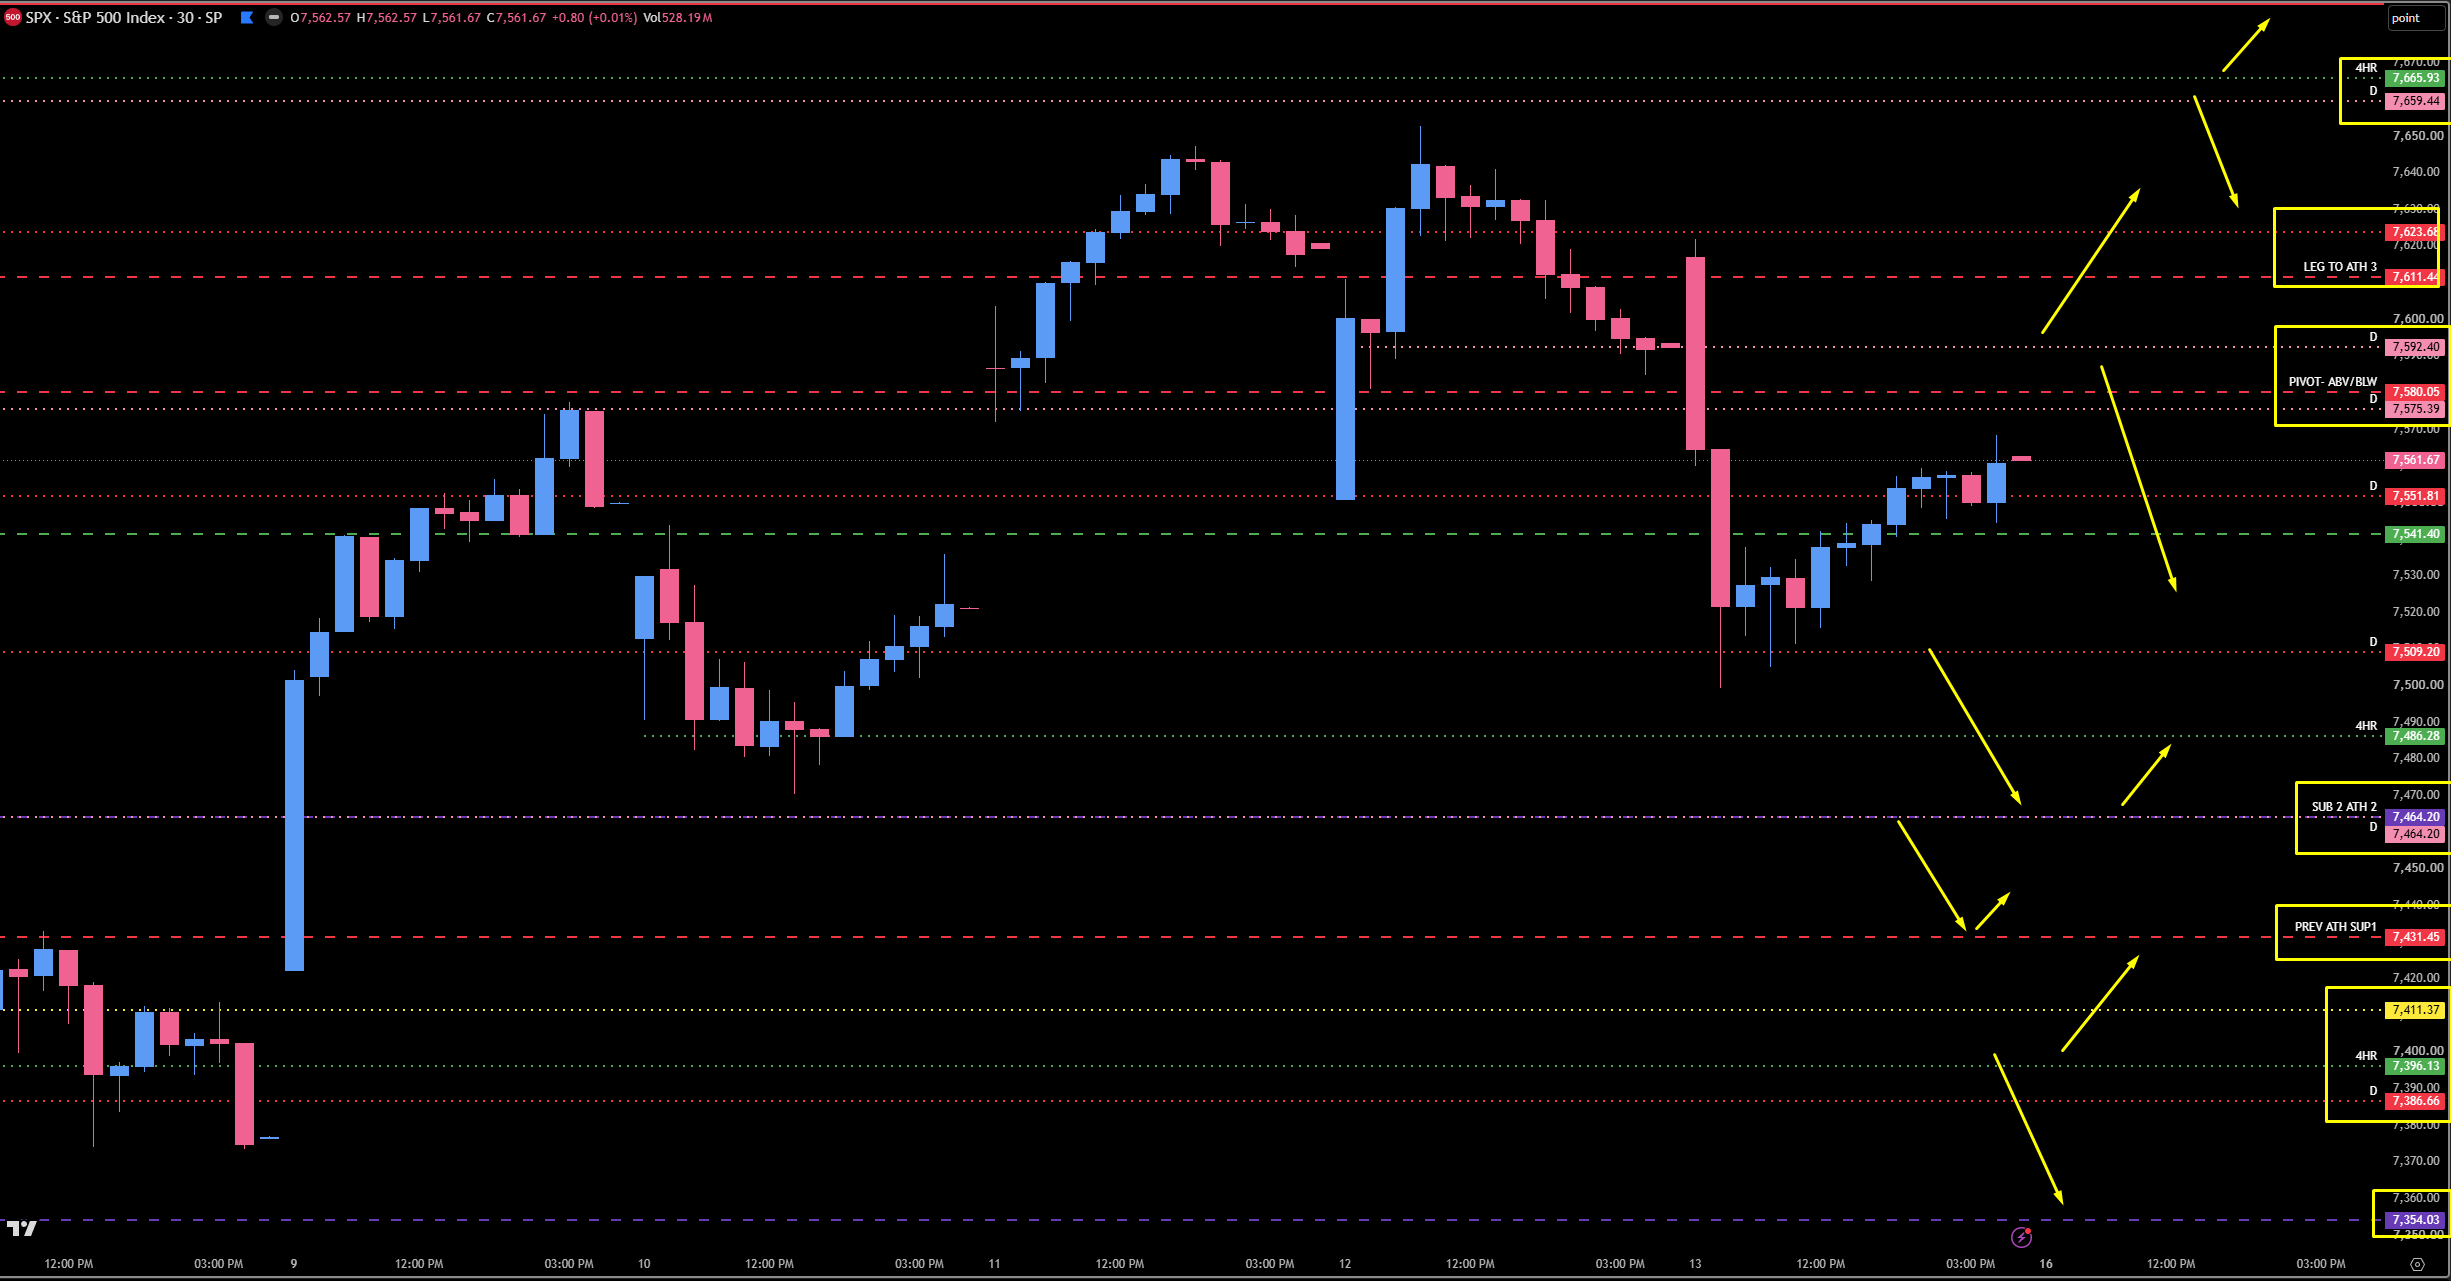
On SPX, Thursday got really close to our leg-in high at 7659 and just missed it. The beautiful part: they made another daily leg down at 7623. On Friday we opened, backtested that daily, and just flushed — our big signal to get short on the indices. We came down to 7509.20, and I told my SPX traders in the room to trim there. We sat there for two to two and a half hours before grinding higher to finish barely unchanged. Coming into the week, I have two numbers: 7592 and the 7575 / 7580 spot. We could get action off 7575 - 7580, but 7592 is my favorite — it is our current leg down. If we come up into it and get back below 7580 and 7575, this thing is a duster. Above it, we are not necessarily bullish, but that area is all tested. As long as we stay below 7592 and the 7575 area, we should make new lows and come all the way down into our 7464 daily/weekly spot — they just barely missed it on Monday, which tells me we could sweep that low and grab some liquidity. That is our first target, and it is a huge one — about 140 points. On ES, that is roughly the 7490 area. Below 7464, the 7431 weekly was important Thursday and Friday; I would absolutely take profits there and it could react, but we are pointed down on the weekly. Below that, an untested one-hour at 7411 and an untested four-hour at 7396 make the area thick with support — but we are not looking to buy support. Could they W out? Absolutely. Do I think so? No. I think we make new lows into the 7316 daily, right by the 7313 weekly T1 I called out last week. My process says 7313. Where am I wrong? 7659 is still untested if they want to try again, and 7688 is our last, highest untested level — above that, we probably make new all-time highs. Above 7623, the bulls get a little gas. They are not out of danger, but I would be cautious and wait for structure to shift back in our favor.
🚨 VIX Analysis: The 19.42 Midpoint Pivot
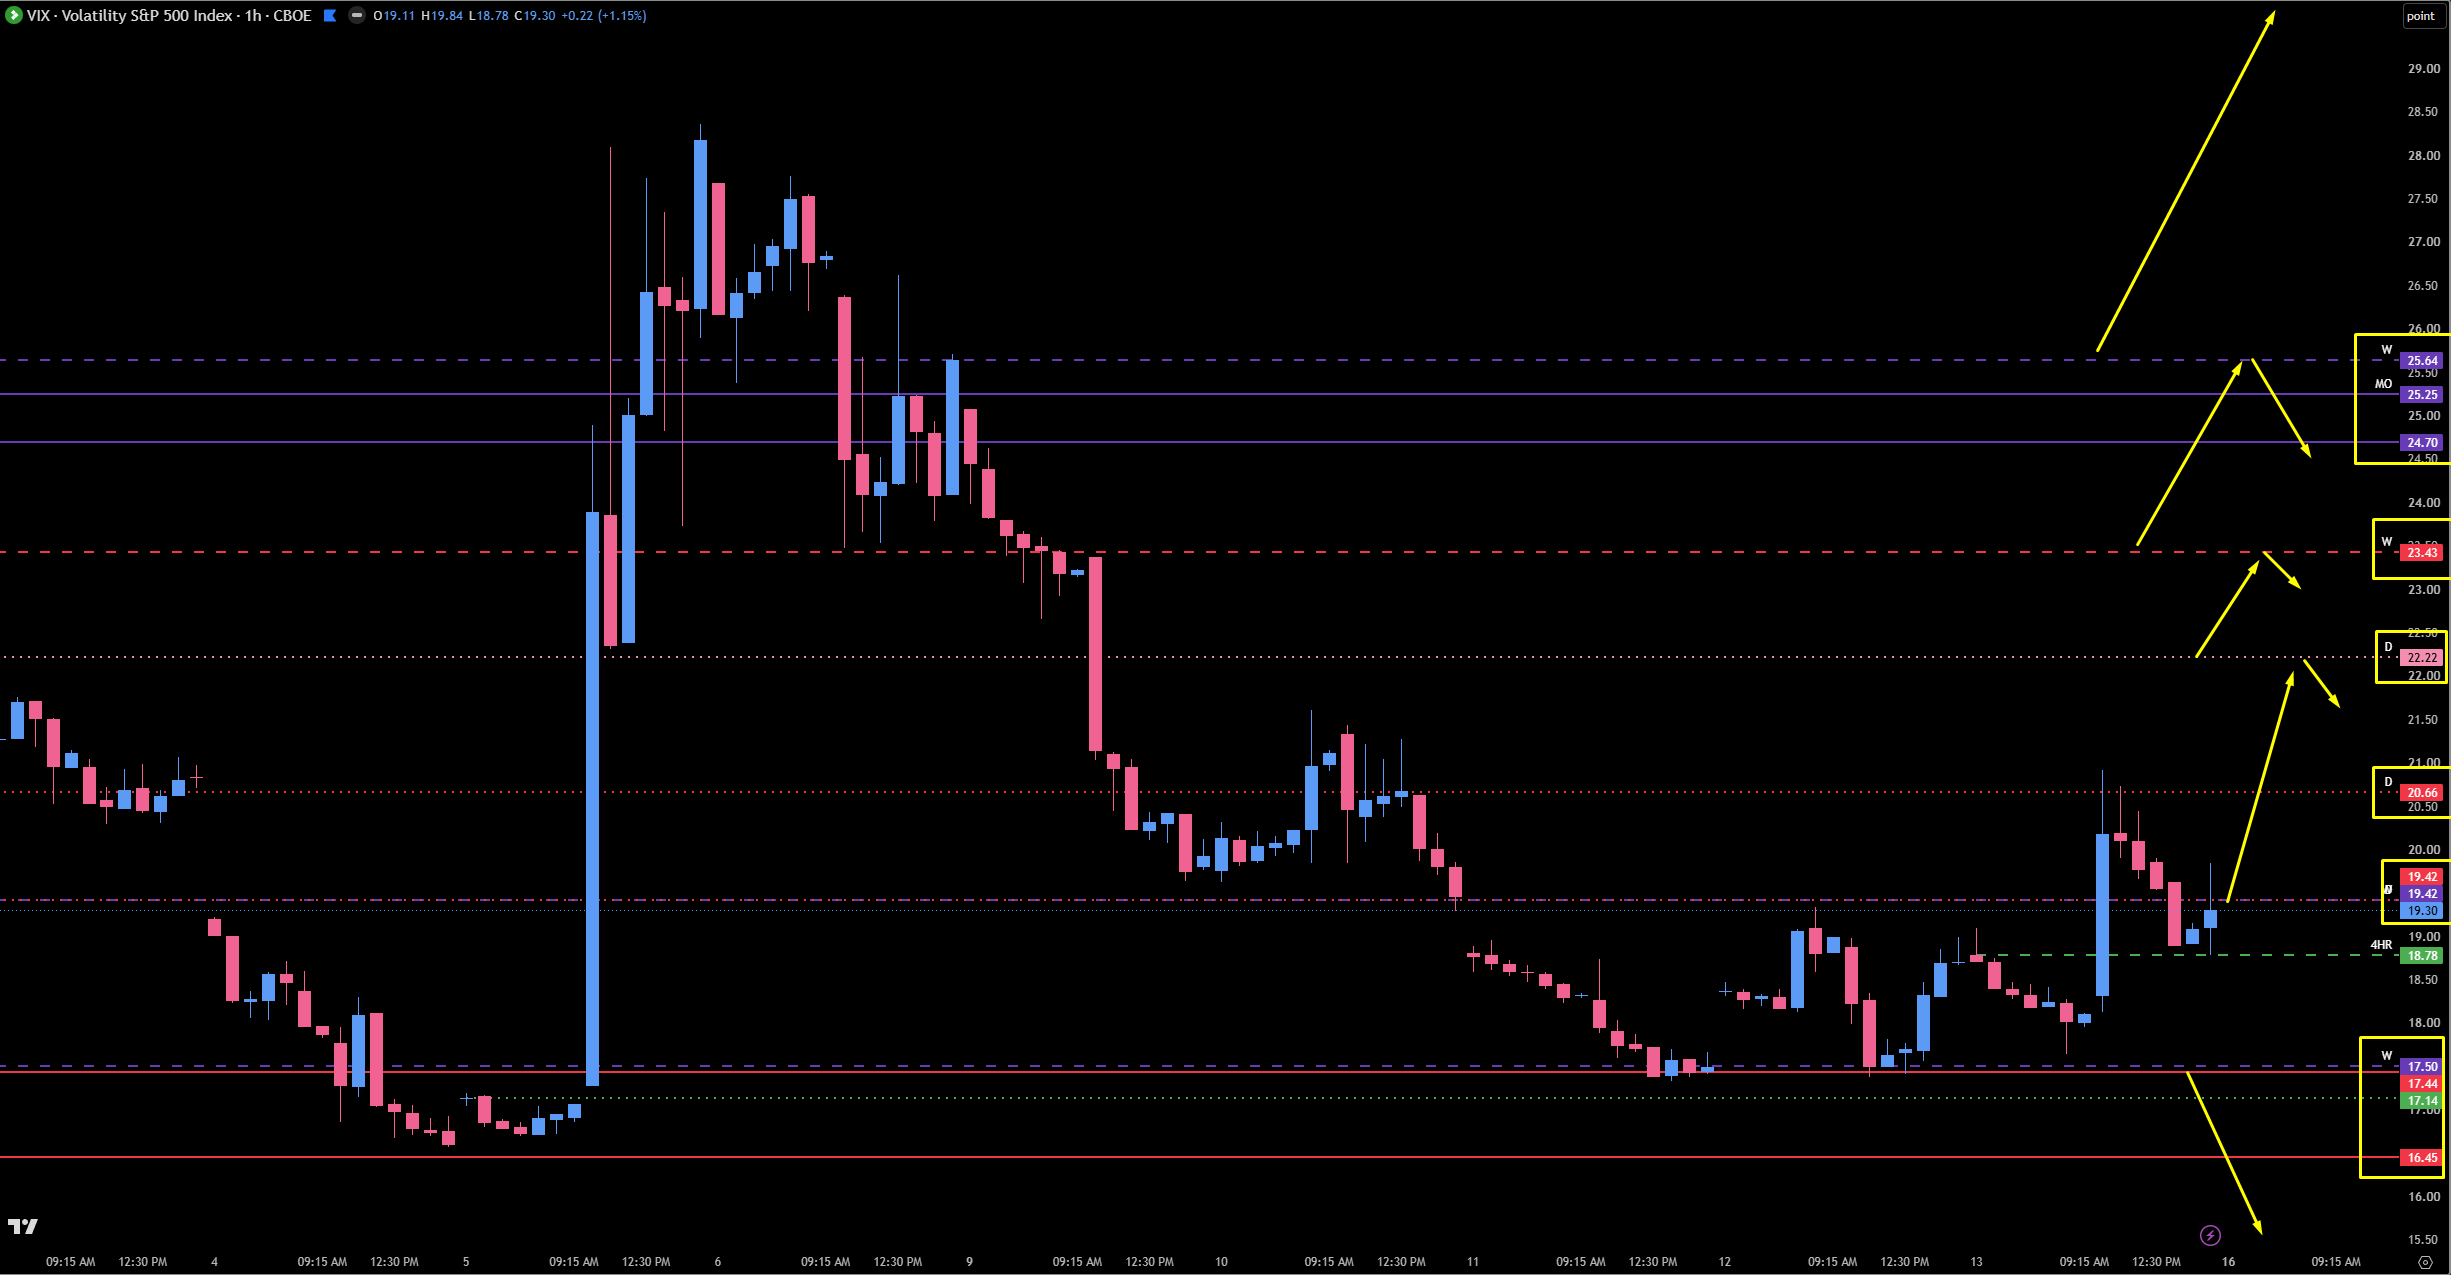
As always, we start with VIX. I gave you a killer setup a couple of days in a row around our 17.50 / 17.44 level, which has been ridiculously important since April as our above/below line for being inherently bearish or bullish.
Last Week’s Playbook: VIX held this level on Wednesday, played the highs at 19.42, and held it again at the lows. On Friday it came down for a very close retest, held, and popped — sending the indices into a big flush — only to bump its head on the 20.66 daily that we have played multiple times and that was directly in the trade plan. Once that rejected, we knew to start taking profits on the indices. I expected VIX to hold down here and take off like a rocket, and it did not — but we played our levels exactly for what they were worth.
The Bull/Bear Line: 17.44 (Monthly) / 17.50. Underneath 17.44, this market runs higher, because VIX would be lacking support and could move much lower. As long as VIX holds above 17.50, we keep the bearish pressure on.
The Midpoint Pivot: 19.42 (Weekly). We played it for support before, and then it was resistance. This is our midpoint pivot for the week. Below it, the indices start to get a little relief — and below 17.50, a lot of relief. Above 19.42, the indices feel pressure.
The Breakout: 20.66 (Tested Daily). Above it, VIX should take off into our next daily and the 23.43 weekly. 23.43 was huge two Fridays ago — VIX held and played it, then dumped underneath it on Monday. That ended the VIX bull run, gave us the big squeeze up in the indices last week, and brought us right into the spot we called for the short. It was not magic. VIX told us we were in the right place to get short.
The $25 Handle: If VIX gets above the next daily and the 23.43 weekly, watch for a big head bump in the $25 handle, with untested resistance around 25.64. Above 25.64, it takes off into the 30.04 and 35.12 weeklies. I would expect reactions there, but the indices would be in dire trouble — especially if VIX gets all the way above last Thursday’s high.
The Long Signal: I have nothing charted below 16.45, which sits under the 17.44 monthly, because we are not down there. If VIX is below 17.50, and ultimately the 16.45 monthly, you need to be getting long ES or SPX.
🎯 Detailed Actionable Trade Plan (ES Futures)
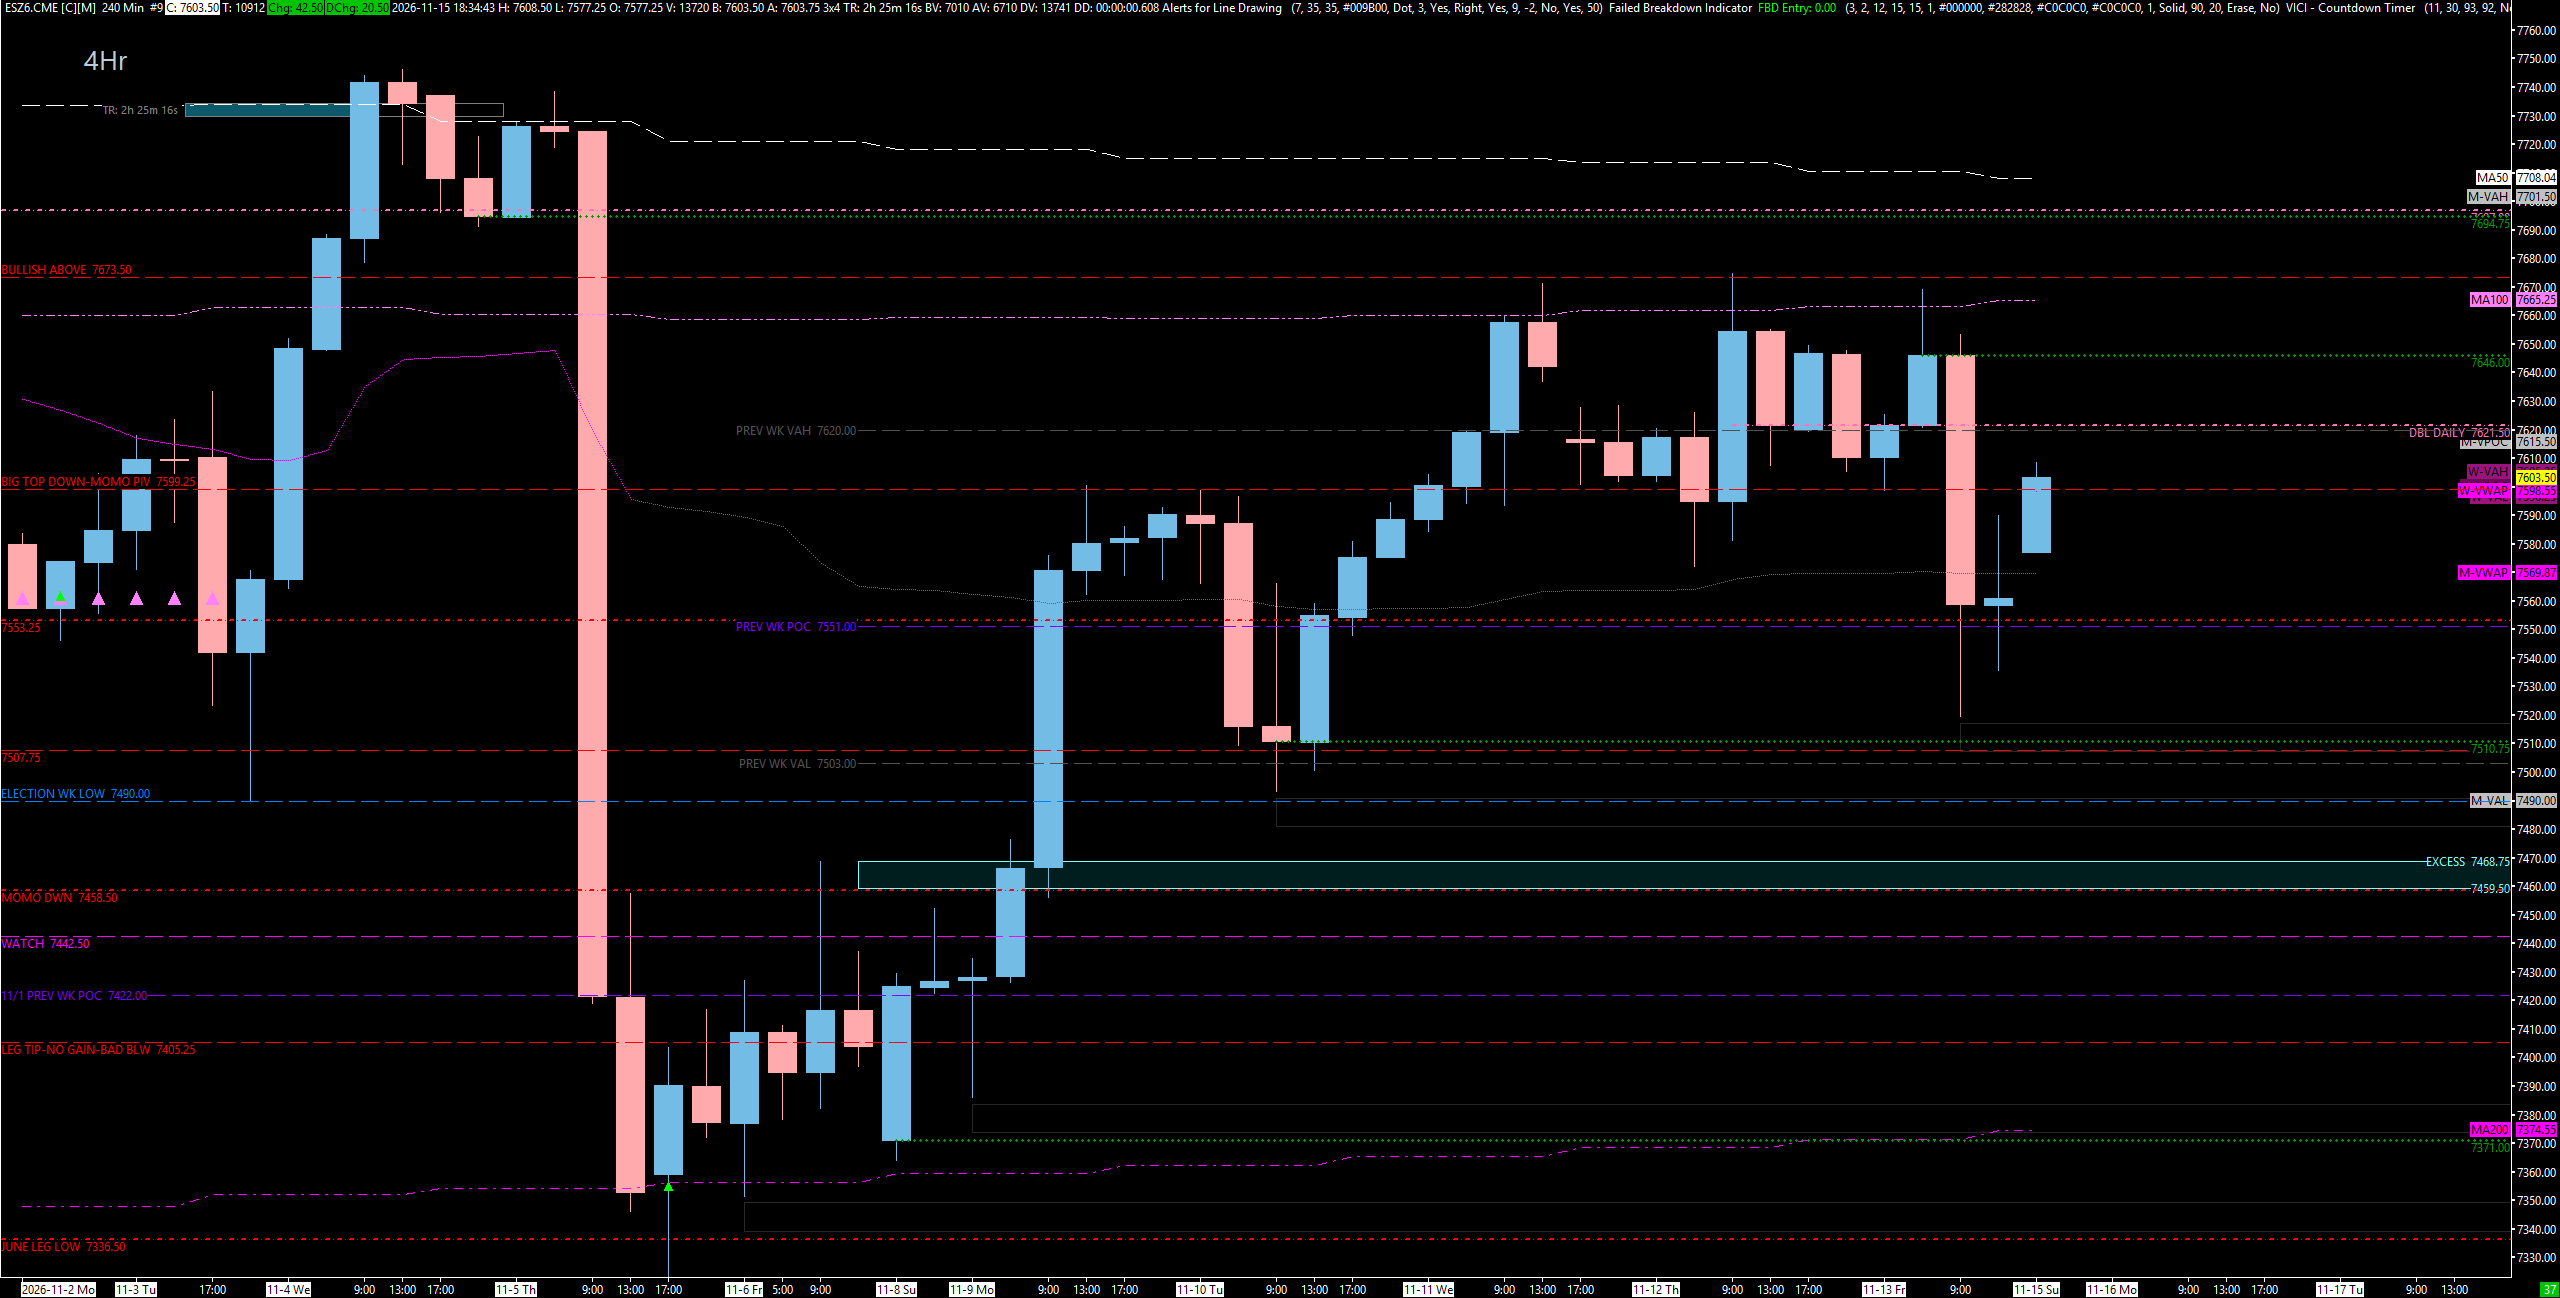
We are pointed down on the weekly, daily, and four-hour, so we are short-only. It is really that simple: if we stay below 7621.50 and the 7599 double-O pivot, we are going to come down. If we push above 7646, we catch a bid. We gapped up about 20 points tonight and History Says gives us a 74% shot at a 35-to-40-point pop, so a move up into 7620 - 7621.50 is on the table — that is the major spot I am watching coming into Monday. If it plays and they start to go, it is just going to go. If they squeeze, the 7646 four-hour is my highest untested level — I will short it, and if I am wrong, I will let them clean up Friday’s excess and short 7646 again. Play 7646 - 7621.50, get back below 7599, and we are coming down — profits at 7553, then 7510, which is roughly 90 points. Below the 7503 previous weekly value area low and the 7490 election low, we head to the 7458.50 daily, the 7442 weekly, the 7422 naked POC, and the 7371 four-hour. I still believe we see a new leg low under the November 5th low around 7320, and 7247 is still my big weekly target — and I think it is possible we come all the way down to 7000.
🔴 Key Resistance Zones & Setups
THE DOUBLE-O PIVOT: 7599.00
7599.00 (The 99 / 00s Pivot — The Double Lows).
Context: This is where I shorted on Friday. I waited for us to get below it, we shorted it, and we took profits at 7553 and more at the lows. When we swept the June lows, they squeezed straight into this 99 pivot — call it 7600, or what I like to call the 00s area — and it paid 100 points. Above it, we squeezed for 75. Above it again, 75. Hold it, 60. It has held so many times that it should be marked on your map for a long time to come. We are sitting directly at it right now — this is a big decision point.
Actionable Setup: Above/Below Pivot: No matter whether we come up to 7621.50 or 7646, the double lows are our big pivot. Back below 7599 = we are coming down. Watch it in the cash session.
THE MAJOR SPOT — Double Daily & P.W. VAH: 7620.00 - 7621.50
7621.50 (Tested Double Daily — Current Daily Leg Down), 7620.00 (Previous Weekly Value Area High).
Context: This is the major spot I am looking at coming into Monday. It is not just one daily — it is two dailies, a double daily at 7621.50. We bumped our head on it so many times during the NVIDIA sell-off and then played it once again as a pivot, above and below. It has re-manifested itself — popped up again in the exact same location on a completely different timeframe. The previous weekly value area high at 7620 lines up to the tick, along with the value area high from the week before. This is a massive potential momentum shift, either above or below.
Actionable Setup: Short Setup: I am going to be short here coming into the morning, as long as they leave it open for us. If this area plays and they start to go, it is just going to go.
Warning: We want to stay below 7620 to keep our downside momentum. Above 7620 we are not bullish, but things start to lean in favor of the bulls.
The Highest Untested 4-Hour: 7638.00 - 7646.00
7646.00 (Untested Four-Hour & One-Hour Leg Down), 7638.00 (Friday’s Daily Profile Excess).
Context: If they push higher than 7621.50, we still have a four-hour leg down at 7646 — the highest, most untested area I have. It is not only the four-hour, it is also the one-hour leg. Right under it, Friday’s profile left excess all the way up to 7638, which is certainly a possible cleanup.
Actionable Setup: Short Setup: I am looking to short 7646. If I am wrong, I am willing to let them clean up all of that excess and try to short 7646 again. If we squeeze all the way into it, I would not hesitate to take the short and ride it all the way back down.
Warning: Above 7646, we are not ultimately bullish — but they are going to catch a bid.
The Tip Of The Retracement — Weekly & Daily: 7673.50 - 7697.00
7697.00 (Daily — Tip Of The Leg-Down Retracement), 7694.00, 7673.50 (Tested Weekly — Played Three Times), plus Thursday’s excess up to 7708.
Context: Above 7646, they could easily come to 7694 - 7697. We still have a beautiful leg up here — the tip of our leg-down retracement — so if they want to get jiggy and pop up there, we have one more spot to play for a smack. That is the massive 7673.50 weekly we have been bumping our heads on: we played it three times last week, and Friday’s four-hour candles could not close higher than the one before, which was the massive weakness that told us to get short.
Actionable Setup: Sweep / Short Setup: If they push up there and get back below 7673.50, it is big-time momentum down — just get short. We have played that area three times now, and if they pop back up and lose it again, it is really overwhelming.
Warning: I would be surprised if we get up there, but anything is possible. Do not count out the bulls.
The Last Line — Weekly: 7729.00
7729.00 (Weekly).
Context: Above 7697, we push through the 7729 weekly, and then we have an opportunity to go back into all-time-high price discovery if they choose to.
Warning: This is where my bearish thesis is in real trouble. Respect it.
🔵 Key Support Zones & Setups
The Profit-Taking Shelf — Daily & Weekly POC: 7551.00 - 7553.00
7553.00 (Daily), 7551.00 (Weekly Point of Control).
Context: 7553 has been important, and it is also where the weekly point of control sits. The downside really begins underneath 7551.
Actionable Setup: Take Profits: For me, this is where I take profits. We took profits here on Friday’s short too.
THE 90-POINT TARGET — Untested 4-Hour, Weekly/Daily & P.W. VAL: 7490.00 - 7510.00
7510.00 (Untested Four-Hour), 7507.00 (Tested Weekly / Daily), 7503.00 (Previous Weekly Value Area Low), 7490.00 (The Midterm Election Low — Well Tested).
Context: Remember that 7507 spot we played last week? That is the weekly and the daily. Now it is also lined up with the previous weekly value area low at 7503, and I still have an untested four-hour at 7510 — and it would hit right after sweeping Friday’s low. Just below sits 7490, the election low from the midterms, which we played again Tuesday for the pop. In my opinion, it is well tested now and should come down.
Actionable Setup: Take Profits: If you get short up top and ride it into 7510, that is about 90 points — it does not even look like it. That is the kind of range we are dealing with. Hold your runners and take profits as they come — this is a big, major profit-taking area. On the one-hour, 7510 certainly looks untested; it would be really nice to play it and get back above the prior high for a pop of maybe 40 points, possibly back to 7553. But I still think we come lower.
Warning: Below 7503 we are pretty bearish. And if they get below 7507 and ultimately 7490, we clean up that excess on the weekly and daily.
The Excess Cleanup — Tested Daily & Untested Weekly: 7442.00 - 7458.50
7458.50 (Tested Daily — Played Last Monday At The Open), 7442.00 (Technically Untested Weekly).
Context: Below 7490, the excess cleanup brings us right down into the 7458.50 daily, which was tested last Monday when they took it up for the ride right at the open. Below that is one more weekly to watch, 7442, which is technically untested. It is not my favorite spot.
Actionable Setup: Take Profits: I am not looking for longs down here, but I would not miss the opportunity to take profits at 7442 in case they pop it. Underneath 7442, we come straight down.
The Naked POC & The 200-Day — Lowest Untested 4-Hour: 7371.00 - 7422.00
7422.00 (Naked Point of Control), 7371.00 (Lowest Untested Four-Hour + 200-Day Moving Average).
Context: The 7422 naked POC is right where we started on Thursday and Friday after the massive move down. Below it, there is one untested level: a four-hour at 7371, sitting perfectly with the 200-day moving average — the lowest untested four-hour in this move up. The four-hour did not gain anything, so it may not play. But it is the lowest untested level, it is with the 200-day, and I would not put it past them to buy this up.
Actionable Setup: Scalp Long Only: If you are looking for a long, wait for it to get back above the wick around 7385 before you buy — I know that is 15 points. It might be good for a quick 10 or 20 points.
Warning: Once we are underneath the 7458.50 daily, the 7507 weekly, and ultimately 7422, this thing is screaming down. I would be taking profits in these areas, not taking longs.
The Leg Low & The Big Target — 7320 And Below:
7320.00 (The November 5th Low), 7247.00 (The Big Weekly Target), 7000.00 (The Big Pocket).
Context: I called two weekly targets perfectly two weeks in a row and missed last week — but we got the smack from exactly where I thought. I really want to see 7247. My process tells me it is still very much in the cards, and I think we take out the November 5th low around 7320 to get there. Even though 7247 is my big weekly target for now, I think we could come all the way down to 7000.
Actionable Setup: These are high-timeframe targets for the short. Take profits along the way and let the process guide each step.
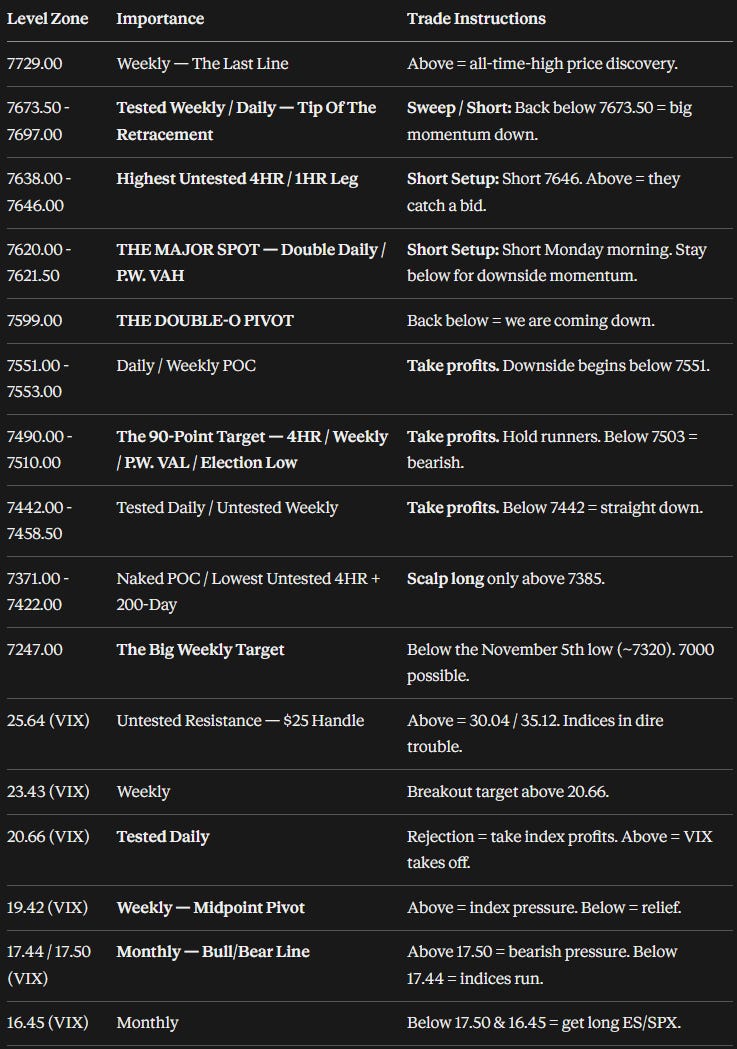
📌 Cheat Sheet – Key Levels Recap
🧠 Final Thoughts
It is really that simple. If we push above 7646, we catch a bid. If we stay below 7621.50 and 7599, we are going to come down. The 7621.50 double daily is the major spot coming into Monday — if it plays and they start to go, it is just going to go. They do have room to push into the 7646 four-hour, and if they really want to squeeze, all the way up to the 7697 daily — but I am focused on 7621.50 and on whether we are above or below the double-O pivot. On the way down, take profits at 7553, 7510, and 7458.50 / 7442, and keep 7247 in your sights.
Keep an eye on VIX. As long as it stays above 17.50, and especially if it marches above the 19.42 weekly, we keep a lot of pressure on the indices. And keep an eye on Bitcoin. I am telling you, it is not done coming down, and I really think we see $45,000. When Bitcoin starts selling off hard, the indices follow suit very soon — and it looks to me like we could be setting up something real nice right now.
I also want to say thank you. We have 70 five-star reviews on Trustpilot and a 4.8 rating — the highest they will give. Do you know how hard it is to get 70 reviews? People usually only post a review when they are upset. The fact that 70 people went out of their way to write a five-star review means hundreds and hundreds of satisfied clients, and I am really proud of that. You made it possible.
The Inner Circle crew is on fire — you guys are printing money, and I am watching people get payouts. It is so gratifying to lead a plan that is actually repeatable. I may have 20 years in this industry, but I have people in the room with three months of experience who are getting payouts, are profitable, and are having a good time. That is what this is about. If you are a Trade Plan subscriber and you are not in the Inner Circle, hit me up on Substack and I will get you in the room. And if you are not subscribed to the Trade Plan yet — what do you have to lose? You spend $50 on Starbucks every month. Thank you so much for joining me. I will see you Monday for the post-market breakdown. Enjoy the rest of your Sunday.
Until next time—trade smart, stay prepared, and together we will conquer these markets!
Ryan Bailey, VICI Trading Solutions.
📊 Indicator String
Copy and paste the levels below into your S&P Edge Levels indicator to automatically plot today’s key levels on your chart:
7729.00|WK|W
7697.00|D|D
7673.50|Tested WK|TW
7646.00|4HR|4H
7621.50|Tested D|TD
7620.00|P.W. VAH|GD
7553.00|D|D
7510.00|4HR|4H
7507.00|Tested WK|TW
7503.00|P.W. VAL|GD
7458.50|Tested D|TD
7442.00|WK|W
7371.00|4HR|4H


