

Midterm season brings a predictable kind of noise. The headlines get louder, the predictions get more partisan, and traders start positioning around who might take the House or the Senate — as if that outcome decides where the S&P 500 goes next.
Here’s what the data says instead: since 1942, the S&P 500 has finished higher in the November-through-June window around every single midterm election.
21 for 21.
That stat gets passed around every cycle. What gets left out is how several of those 21 wins actually played out. Some of them dropped double digits first — enough to shake out anyone who panicked.
The midterm record doesn’t say stocks go straight up. It says that for 80 years, the dip inside this window has been the opportunity — not the exit.
The 21-for-21 Record
First, the exact rule, because precision matters here. Enter at the last trading close of October in each midterm year. Exit at the last trading close of June the following year. That’s an eight-month window — and in most years, the entry actually lands a few days before Election Day.
Every return below is the SPX cash index, nominal (not adjusted for inflation) and price-only. No dividends, no fees, no taxes. The label “1942” means October 1942 through June 1943, and so on down the table.
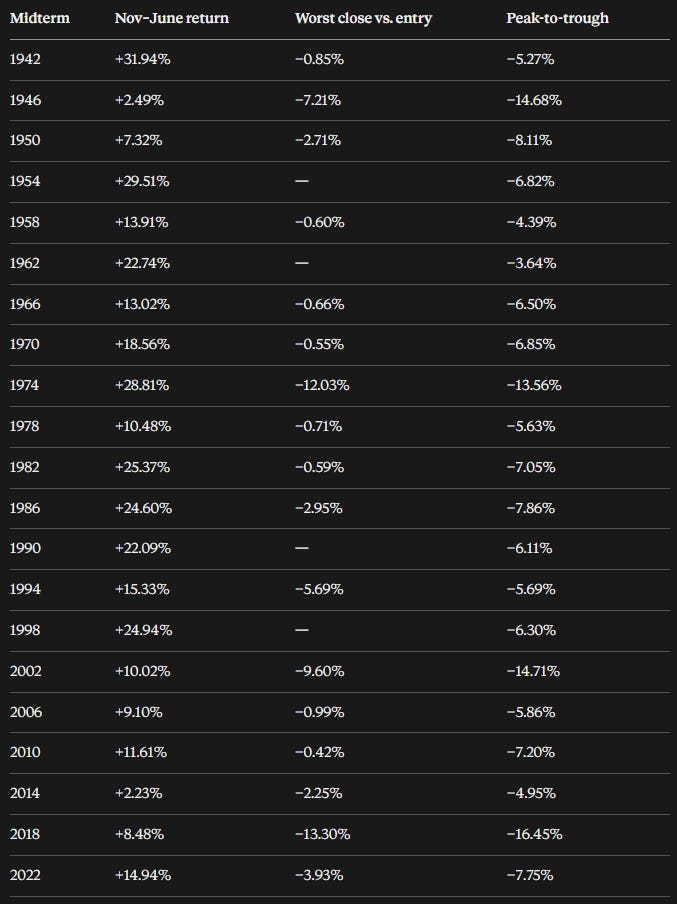
A dash means the index never closed below entry in that window.

Across all 21 windows, the average return was +16.55% and the median was +14.94%. The weakest finish was +2.23% in 2014–15. The strongest was +31.94% in 1942–43.
The record also cuts cleanly across party lines. Eleven of those midterms came under Democratic presidents and ten under Republican presidents. Every one of them finished the window higher.
Now the question every skeptic should ask: isn’t this just stocks going up? Equities tend to rise over most eight-month stretches anyway.
So here’s the same November–June season, comparing midterm years against every other year:

On VICI’s own 1990-onward data, midterm windows averaged 6.82 percentage points more than every other year in the same season. The non-midterm years in that span included a −17.81% loser. The midterm group’s worst was still positive.
That gap is the real edge in this study — not the raw return. Stocks grind higher in most eight-month windows. Midterm windows have done it more consistently and by more. It’s a record of what happened, not proof the election causes it. But 80 years is a long time to stay consistent.
The Dips Inside the Wins
Here’s the part that rarely makes the headline. A positive June close tells you nothing about what you had to sit through to get there.
Two measures matter, and they’re not the same thing. Loss versus entry is how far the worst close fell below your original entry price. Peak-to-trough drawdown is the biggest drop from any closing high inside the window to a later closing low — and it can be bigger, because it counts gains you’d already made and then gave back. A third measure, the intraday low, is only reliable in the 1990–2022 data, so I keep it separate.
Across all 21 windows, on closing prices, 17 closed below entry at some point. Five closed 5% or more below entry. Two — 1974 and 2018 — closed 10% or more below. Four suffered closing peak-to-trough drawdowns of 10% or more: 1946, 1974, 2002 and 2018.
Not every window dipped first. 1954, 1962, 1990 and 1998 never closed below entry at all. But most did — and in every one of those 17, the dip ended up being a better price than where the window finished in June.
Now think about that. Since 1942, selling a close below entry has never once beaten holding this window to June.
2018: The Christmas Eve Test
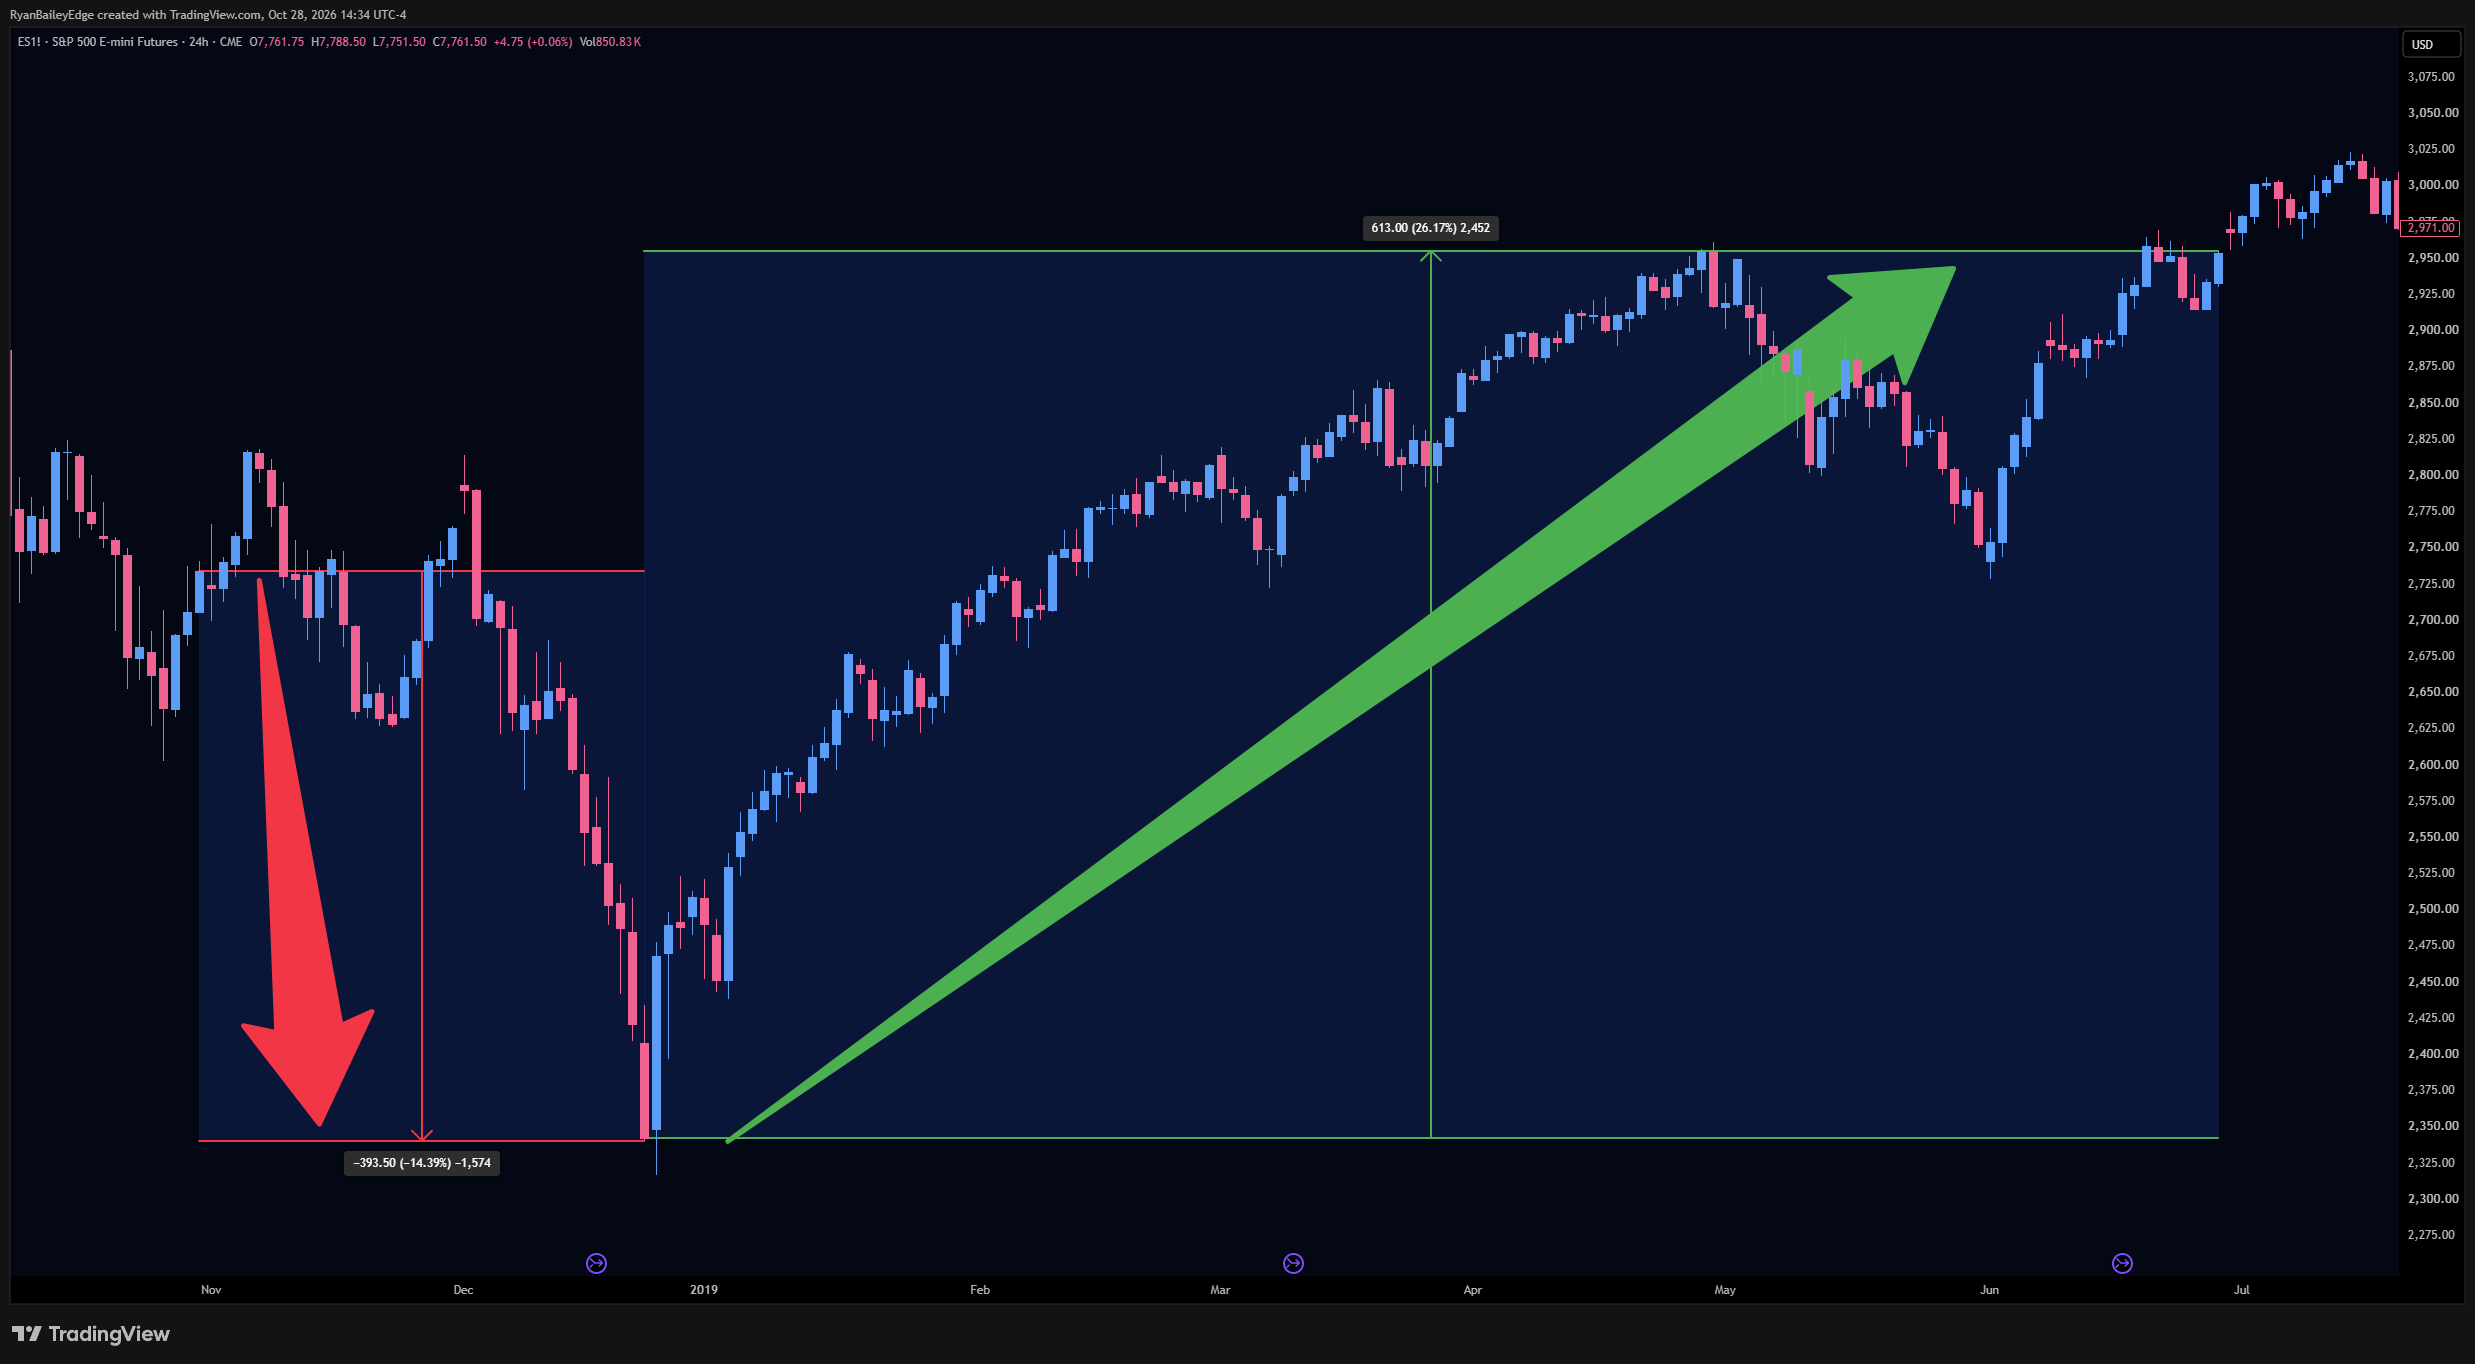
If you want one window that shows both sides of this trade, it’s 2018.
Entry was the Oct. 31, 2018 close at 2,711.74. The index pushed to a closing high of 2,813.89 a week later on Nov. 7 — then rolled over. It closed below entry for the first time on Nov. 14.
The bottom came on Christmas Eve. The Dec. 24 close of 2,351.10 sat 13.30% below entry and 16.45% below the November high. The lowest intraday print came two days later — 2,346.58 on Dec. 26, or 13.47% below entry.
Now picture three traders.
The one who panicked at the lows locked in a loss of about 13%.
The one who sat still watched the index close back above entry on Feb. 4, 2019 — 42 calendar days after the low — reclaim the November high on March 15, and finish the window at 2,941.76 on June 28, 2019. Final return: +8.48%.
The one who bought the dip anywhere below 2,711.74 got a better price than the original entry — and every one of those prices sat below where the window finished.
That’s the whole thesis in one window. Patience paid. Panic didn’t.
2002 and 1974: Same Lesson, Different Paths
2002 shows why the measuring stick matters. Entry was 885.76 on Oct. 31, 2002. The worst close came on March 11, 2003 at 800.73 — 9.60% below entry. The intraday low the next day hit 788.90, or 10.94% below. Measured from the Nov. 27, 2002 closing high of 938.87, the closing drawdown was 14.71%.
One window. Three different “drawdown” numbers, depending on which one you quote. That’s why, in the 1990–2022 data, only 1 of 9 windows closed 10% below entry — but 2 of 9 touched that level intraday. The 2002 window closed back above entry by March 21 and finished +10.02%.
1974 went deeper on a closing basis: 12.03% below entry by Dec. 6, 1974. It took 52 calendar days to close back above entry — and the window finished +28.81%.
The Fine Print
The election-anniversary version. Measured from the Election Day close to the same date one year later, the record is 19 for 19 since 1950, averaging +15.11% (median +14.49%). Don’t stack it on top of the 21-for-21 — it’s the same midterms and overlapping months measured with a different ruler, not a second confirmation. It has its own scars, too: the 1986 window finished +1.12% after a 33.24% closing drawdown through the October 1987 crash.
The streak has edges. Run the same November–June rule back before 1942 and it lost 12.46% in 1930–31 and 17.54% in 1938–39 — 22 of 24 across all available midterms, not perfect. Shift the entry to the end of November and it’s 20 of 21, with 2014–15 slipping about 0.22%. The following full calendar year is 17 of 19, with 2011 essentially flat and 2015 down 0.73%. Different rules, different records.
The data. 1990 onward comes from VICI’s canonical daily SPX series (First Rate and EODHD). The 1942–1986 windows use a separately labeled Yahoo Finance historical supplement, and the 1942–1954 windows predate the S&P 500’s March 1957 launch, so those are back-tested index history. Early records carry closing prices only, which is why every intraday number here stays inside 1990–2022. And 21 observations is still a small sample — the standard statistical range for a 21-for-21 record (a 95% Wilson interval) runs from roughly 84.5% to 100%, before accounting for how the window was chosen. This is history, not a probability.

What This Means for S&P Traders
Here’s how I’d use this — not as a trade signal, but as a macro reminder to be patient.
If the next few months bring a sharp pullback, the historical lesson is clear: inside this window, the dip has been the opportunity, not the exit. But the cost of admission is real, so a few rules.
Size for the path, not the endpoint. A 2018-style decline of 13% to 16% is uncomfortable in a cash account. On a leveraged ES position, it can force you out long before June. Buying the dip only works if you can survive the dip.
Match the timeframe. This is an eight-month, price-only index study. It’s a backdrop for your bias, not a day-trading, futures or options edge. An option can lose money even when the index finishes the window higher — in 2018, the index didn’t close back above entry for 42 days after the December low.
Don’t treat history as a ceiling. Past drawdowns aren’t a maximum. The next one can be bigger.
For this cycle, the window opens with the Oct. 30, 2026 close and runs through the June 30, 2027 close.
This is exactly how we work inside S&P Edge — the macro picture sets the bias, and the daily trade plan handles the levels and the execution. If you’re trading the S&P and want that every session, [S&P EDGE LINK]. And if you just want the macro side, our SPX Morning Brief is free: [SPX MORNING BRIEF LINK].
Whoever won, the window finished higher — 21 times out of 21.
Be patient. Respect the dip. And never bet against America — no matter which party wins.
Until next time—trade smart, stay prepared, and together we will conquer these markets!
Ryan Bailey, VICI Trading Solutions.