
After Friday’s Freefall: A Sharper Look at the Monday VIX Rebound
VIX +39.68% Friday on a chip-led $1T wipeout. Since 2020, all 8 Friday spikes gave a Monday open-to-high rally of at least +0.65%.

Hello Traders,
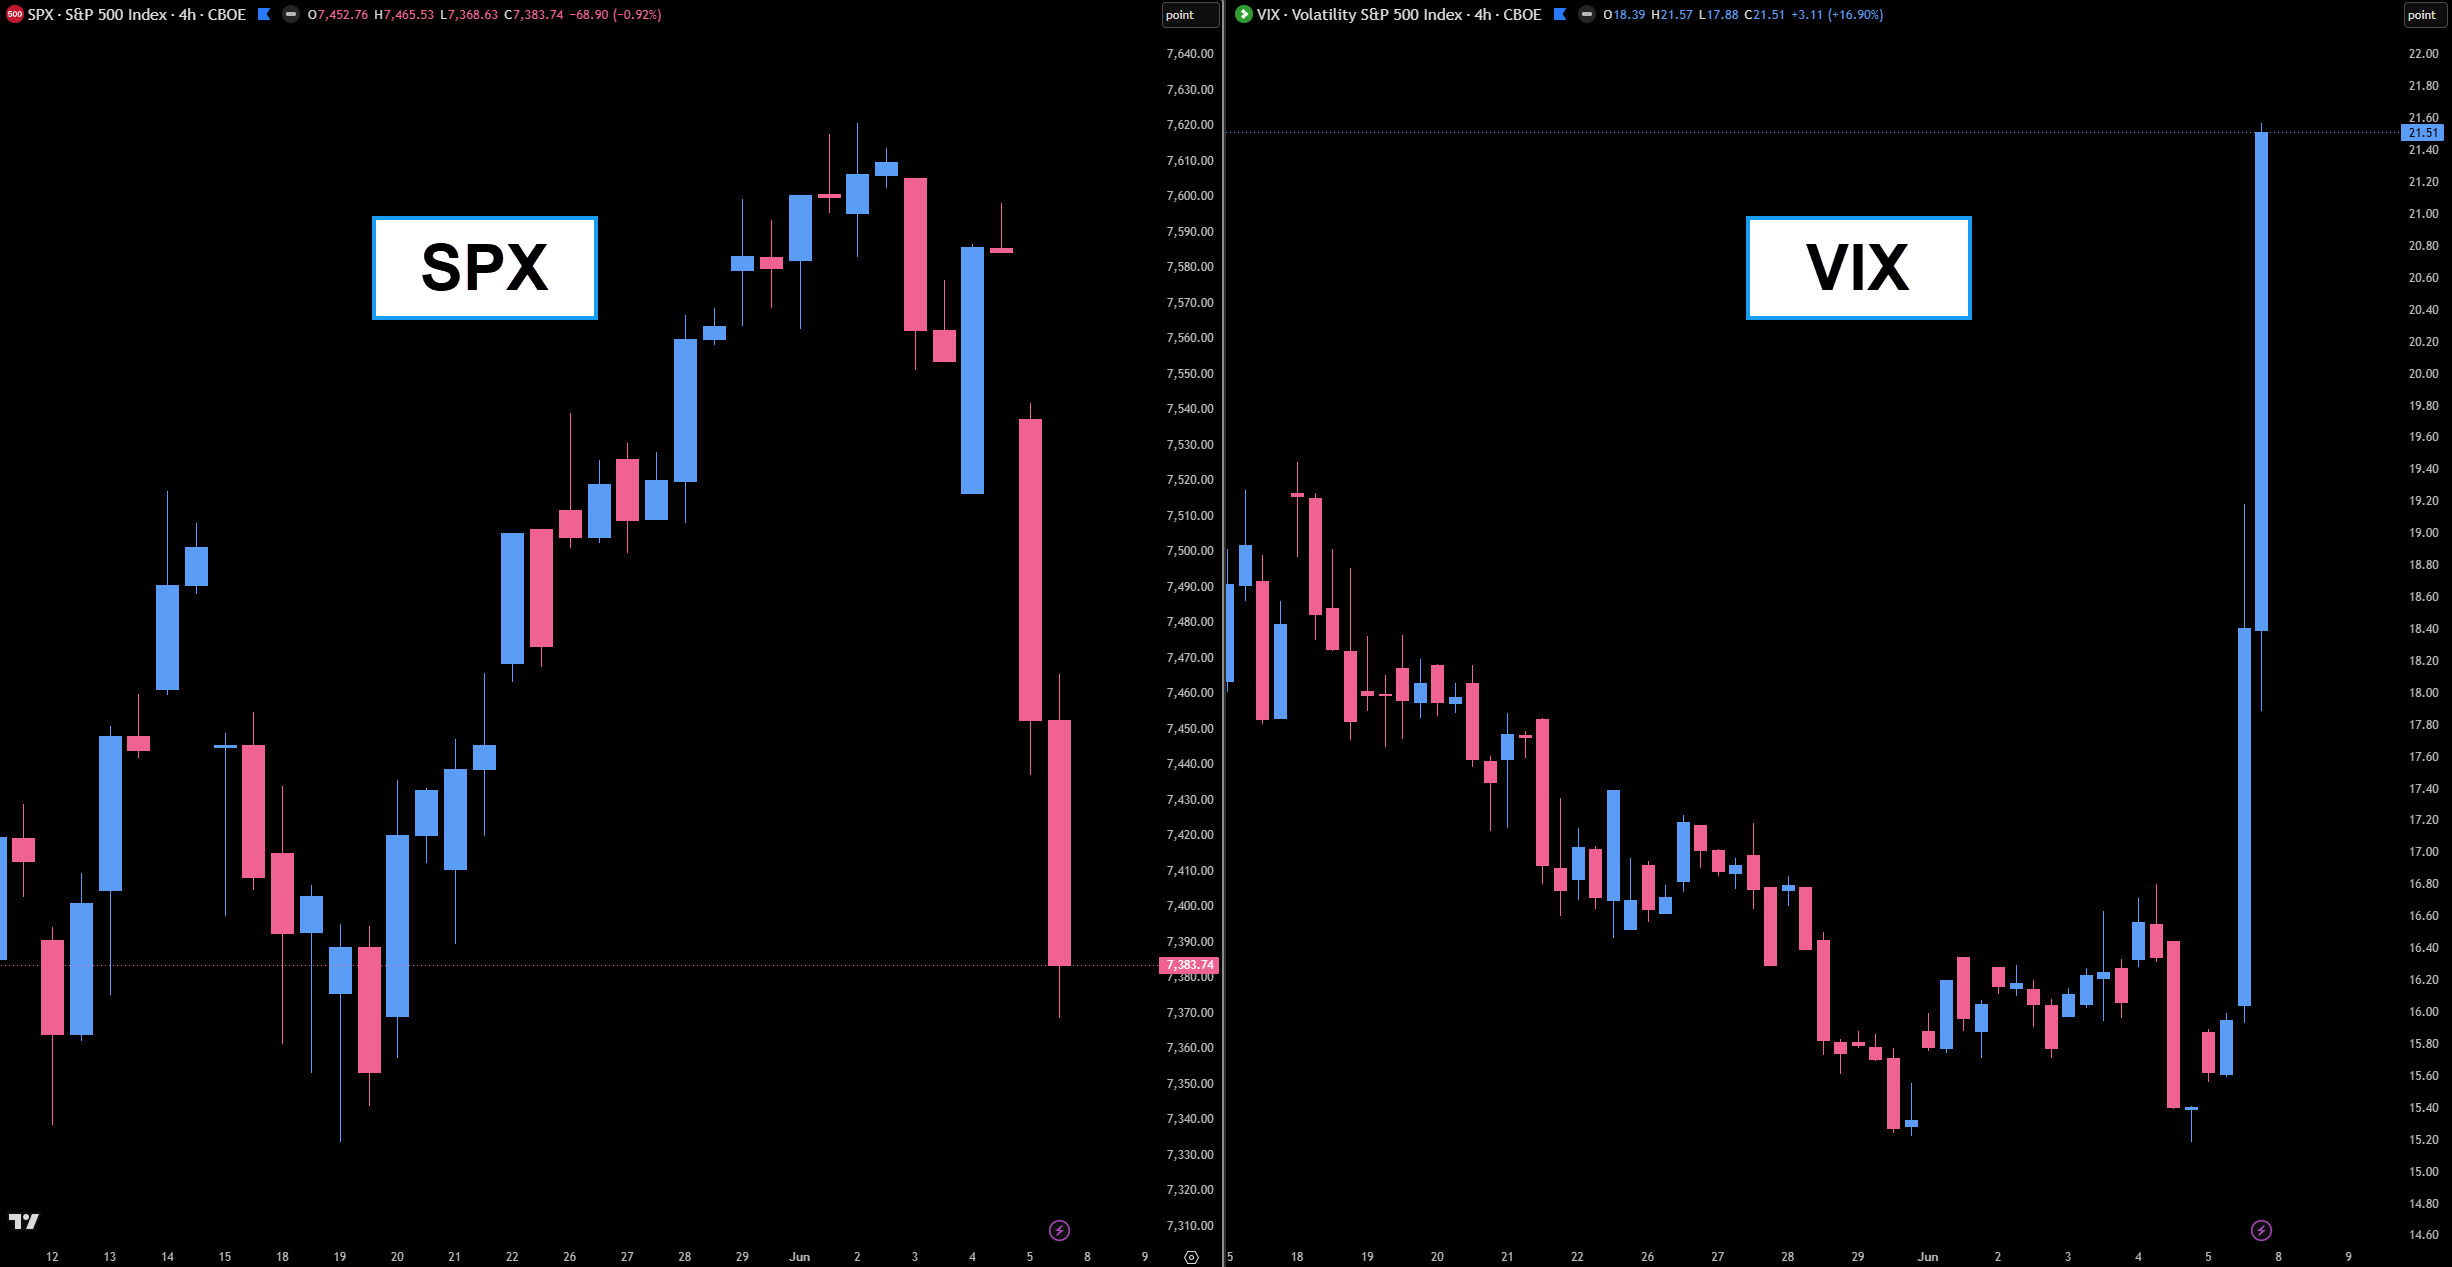
If you had a position on this afternoon, you felt it. The S&P spent the morning grinding, then the floor gave way — a 200-point slide into the close, down 2.64% on the day. The Nasdaq 100 was uglier, down 4.77% — its worst session since the early-2025 tariff crash. Chips led the bleed: more than a trillion dollars in semiconductor market value erased this week, with Broadcom’s refusal to lift its AI outlook lighting the fuse and a much hotter-than-expected jobs report — 172,000 against expectations near 80,000 — pouring gas on it by sending yields screaming higher. Meta piling on with a multibillion-dollar stock sale didn’t help the mood.
And the fear gauge did exactly what fear gauges do. The VIX closed up 39.68% on the day, finishing at 21.51 — a violent, single-session panic spike, landing on a Friday.
Now everyone goes home for the weekend to stew on it.
Here’s the thing about days like this: they’re built to make you feel something. Fear, urgency, the itch to do something before Monday. I’ve stood on a trading floor through enough of these to know the feeling is the trap. So I do what I always do — I close the platform, and I open the data.
When the VIX panics into a Friday close, what has the next session actually done?
I asked this same question back in October, the last time we caught a Friday washout like this. I published a stat then, and it was directionally right. But if I’m being straight with you, it was blunter than it should have been — so I went back and sharpened it.

What I Got Wrong the First Time
The October post measured a bounce “on Monday or Tuesday.” Two problems with that.
First, a two-day window is useless for timing a trade. If you’re trying to get long, “it bounces sometime in the next two sessions” doesn’t help you — the market can puke Monday and recover Tuesday, and you’re stopped out long before the edge ever shows up. I need to know what the very next session does.
Second — and this one nagged at me — the old stat counted a “positive close.” But I couldn’t tell you with full certainty whether the measurement keyed off the closing print or the intraday high. That kind of ambiguity is exactly what I won’t put my name behind. So I rebuilt the study from clean data going back to 1996, and I defined the measurement precisely.
The new question: after the VIX closes up 20% or more, how often does the S&P rally from the next session’s open to that same session’s high?
Open to high. Not close.
The market can finish red and still hand you the move I’m measuring. This isn’t “does Monday close green.” It’s “once Monday opens, does it squeeze.”

The Numbers
Start broad. Going back to 1996, there have been 117 days where the VIX closed up 20% or more. The next session produced an open-to-high rally of at least 0.50% in 75% of them, and at least 0.70% in 61%. A real tendency — but not one to bet the farm on by itself.
Now tighten to the modern regime. Since 2020 — 36 of those events — the rebound gets stronger: an open-to-high pop of at least 0.50% in 86% of cases, and at least 0.70% in 75%. Volatility behaves differently now than it did two decades ago. The dips get bought harder and faster.
But the setup in front of us isn’t just any panic day. It’s a Friday panic day. That’s where it gets interesting.
Since 2020, there have been eight Fridays where the VIX closed up 20% or more. Here’s what the next session — Monday — did, measured open to high:
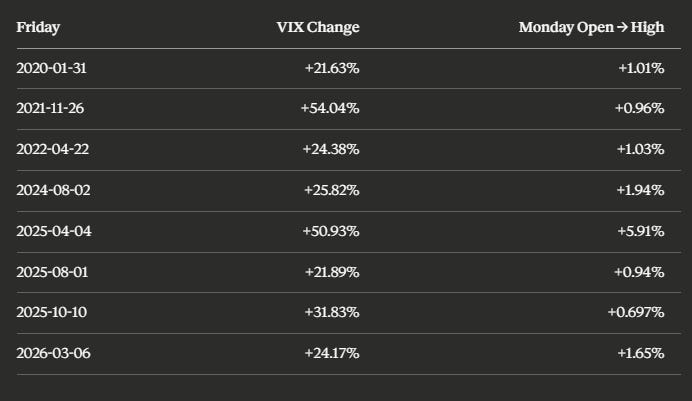
Eight for eight cleared +0.65%. Seven of eight cleared +0.70% — and the lone “miss,” October 10 of last year, rallied +0.697% off the Monday open. It missed the +0.70% line by three one-thousandths of a percent. I’m not going to insult you by rounding that up and calling it 100% at +0.70%; honestly, it’s 7 of 8. But at +0.65%, every single one delivered.
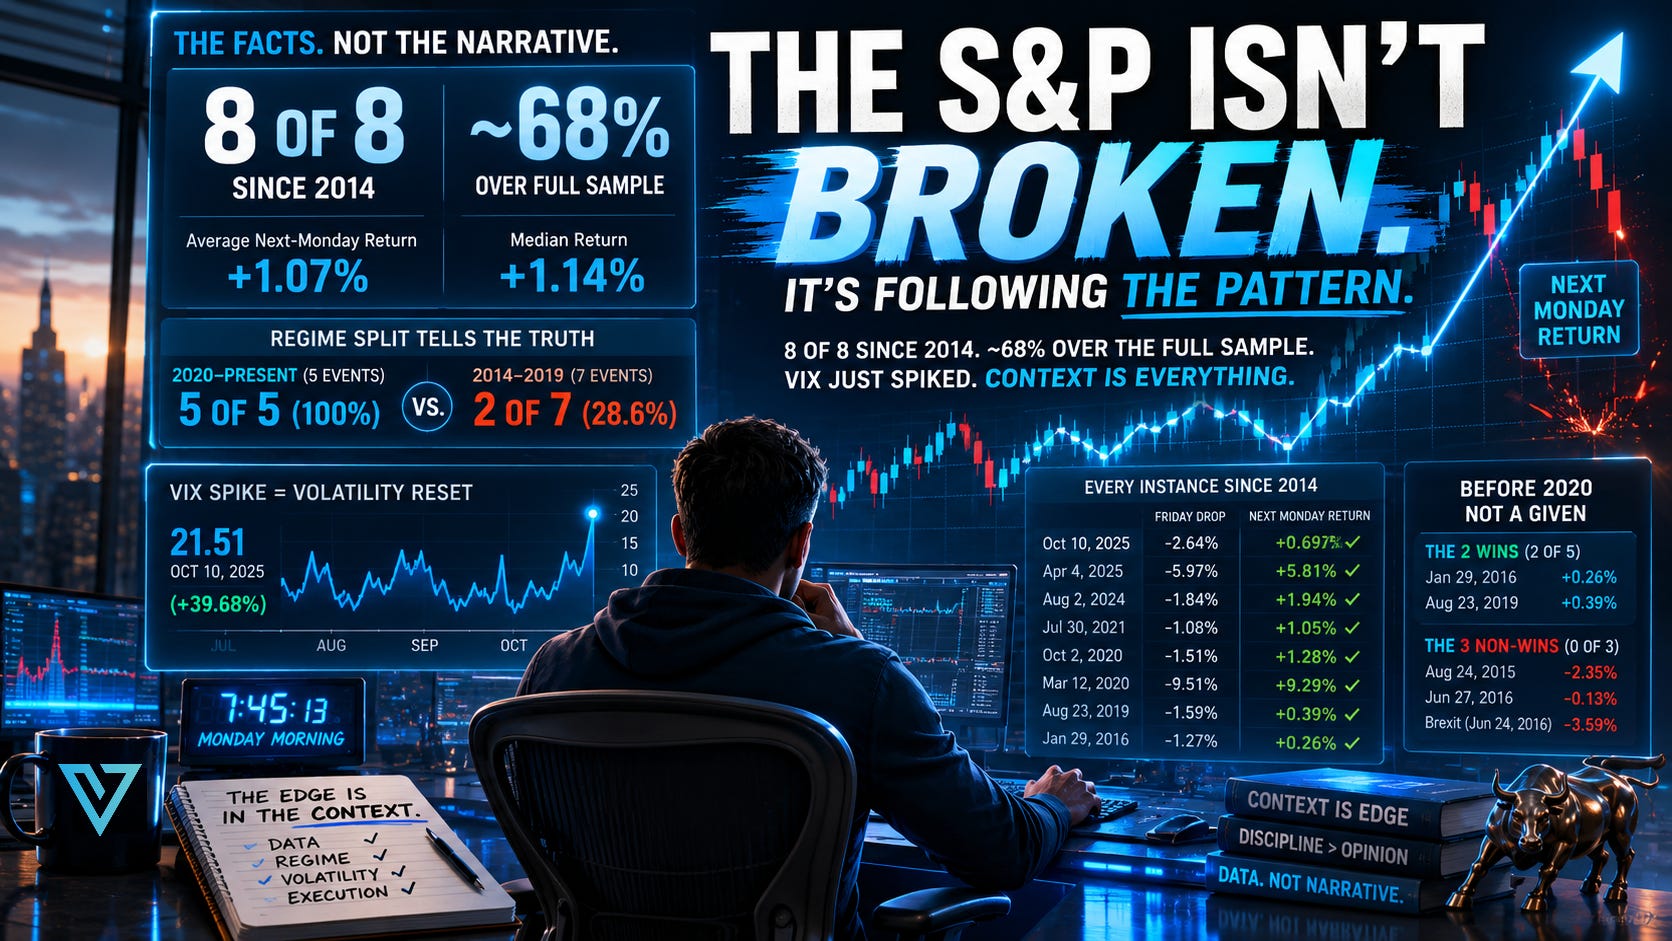
Now, before anyone tattoos “8 of 8” on their forearm — that’s the modern regime, and I’m not selling it as a law of nature. Stretch the exact minute-by-minute data as far back as it goes, to 2008, and the +0.65% rebound shows up in 15 of 22 Friday events. About 68%. Still an edge. Not a guarantee.
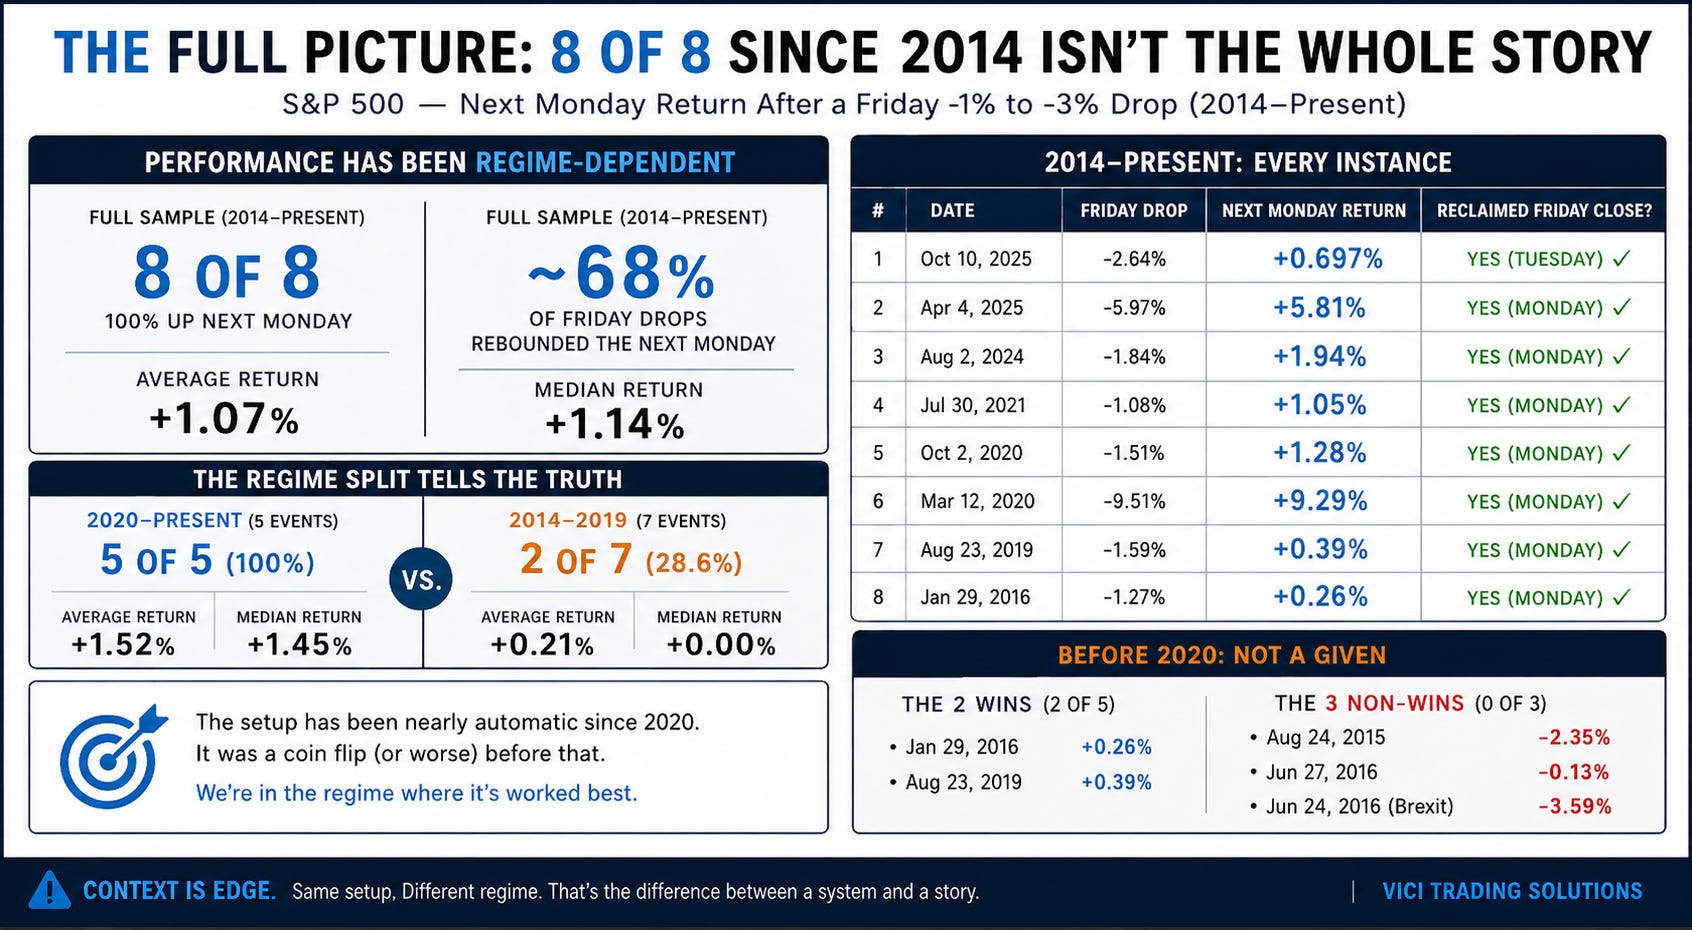
And it isn’t a tidy “old data bad, new data good” story either. The setup worked roughly 71% of the time from 2008 through 2013, broke down hard across 2014 through 2019 — just 2 of 7 — then turned nearly automatic after 2020. Some of the misses were near-things; some weren’t. The August 2015 China-devaluation Monday and the post-Brexit Monday in June 2016 never rebounded in the cash session at all. That’s the honest backdrop — and the useful part of it is this: we are sitting in the regime where this setup has worked best, not the one where it didn’t.
Today’s VIX close of +39.68% sits right in the middle of that range — bigger than most of those eight, smaller than the April 2025 and November 2021 spikes. This is not some unprecedented reading the data has never seen. It is squarely the kind of event this study is built on.
The Part That Actually Matters
Here’s where the sharpened version earns its keep — and where I think most traders are about to get it wrong.
The edge is not the weekend gap.
It’s tempting to read “Monday rallies” as “buy Friday’s close and ride the gap up.” The data says don’t. Since 2020, Monday opened above Friday’s close in only four of those eight events. Half the time, you’d have walked in Monday morning staring at a gap down — even as the Monday session itself still squeezed.
Look at the two measurements side by side:
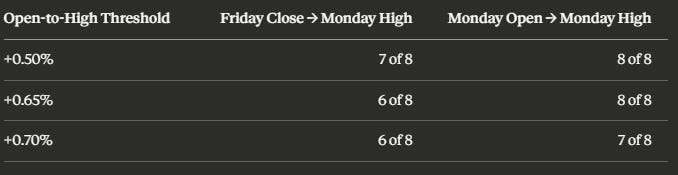
Measured from the Monday open, the setup is clean. Measured from the Friday close, it springs leaks — because the weekend gap is close to a coin flip, and one bad gap eats your edge before the rally ever starts.
The clearest example is August 2024. The Friday before, the VIX ripped +25.82%. That Monday, the S&P rallied almost 2% from its open to its high — a textbook squeeze. But Monday opened more than 3.6% below Friday’s close. So if you’d bought Friday into the bell, the Monday high never even brought you back to even. The rebound was completely real. The Friday-close entry was a trap.
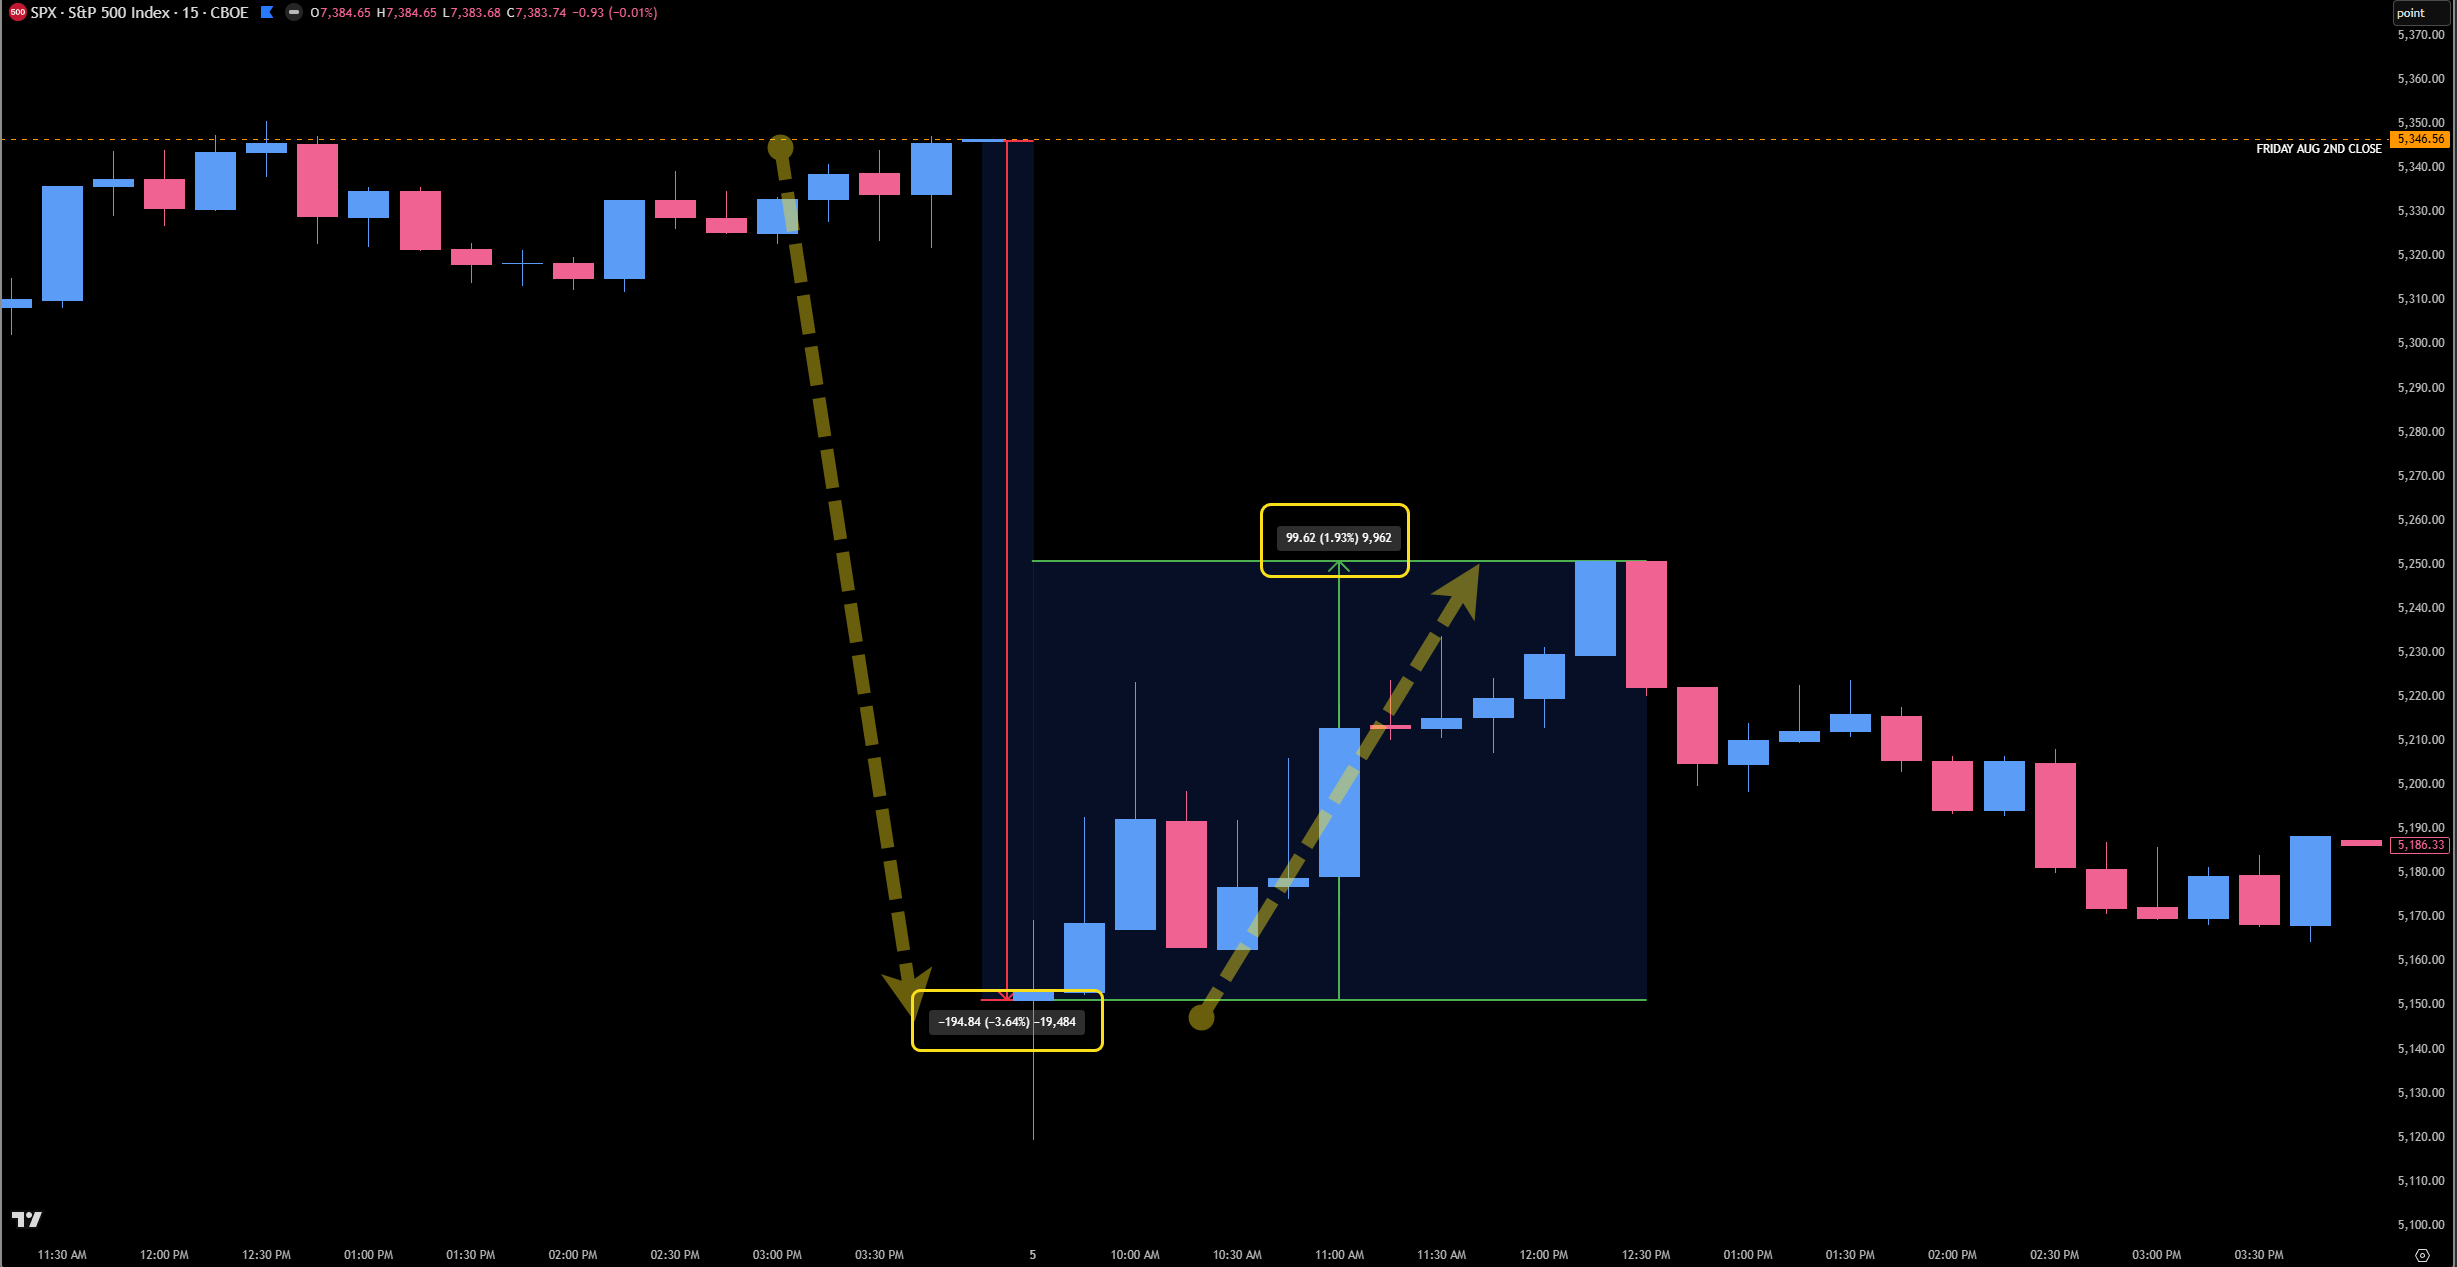
That’s the whole lesson in one example: the move lives in the Monday session, not the weekend hold.
If You Trade Futures, Read This Before Sunday Night
A lot of you are going to be staring at Globex on Sunday evening trying to read the tea leaves. Let me save you the anxiety: the overnight gap has told you almost nothing.
Since 2020, across these eight Friday events, Monday’s cash open came in higher than Friday’s close exactly four times — and lower the other four. A coin flip. The average gap is actually slightly negative, around −0.54%, dragged there by the two sessions that gapped hard down: August 2024 at −3.66% and April 2025 at −2.37%. The median is essentially zero. Widen it to the full sample back to 1996 and the story holds — Monday opened flat-or-higher just 52% of the time, average gap −0.21%.
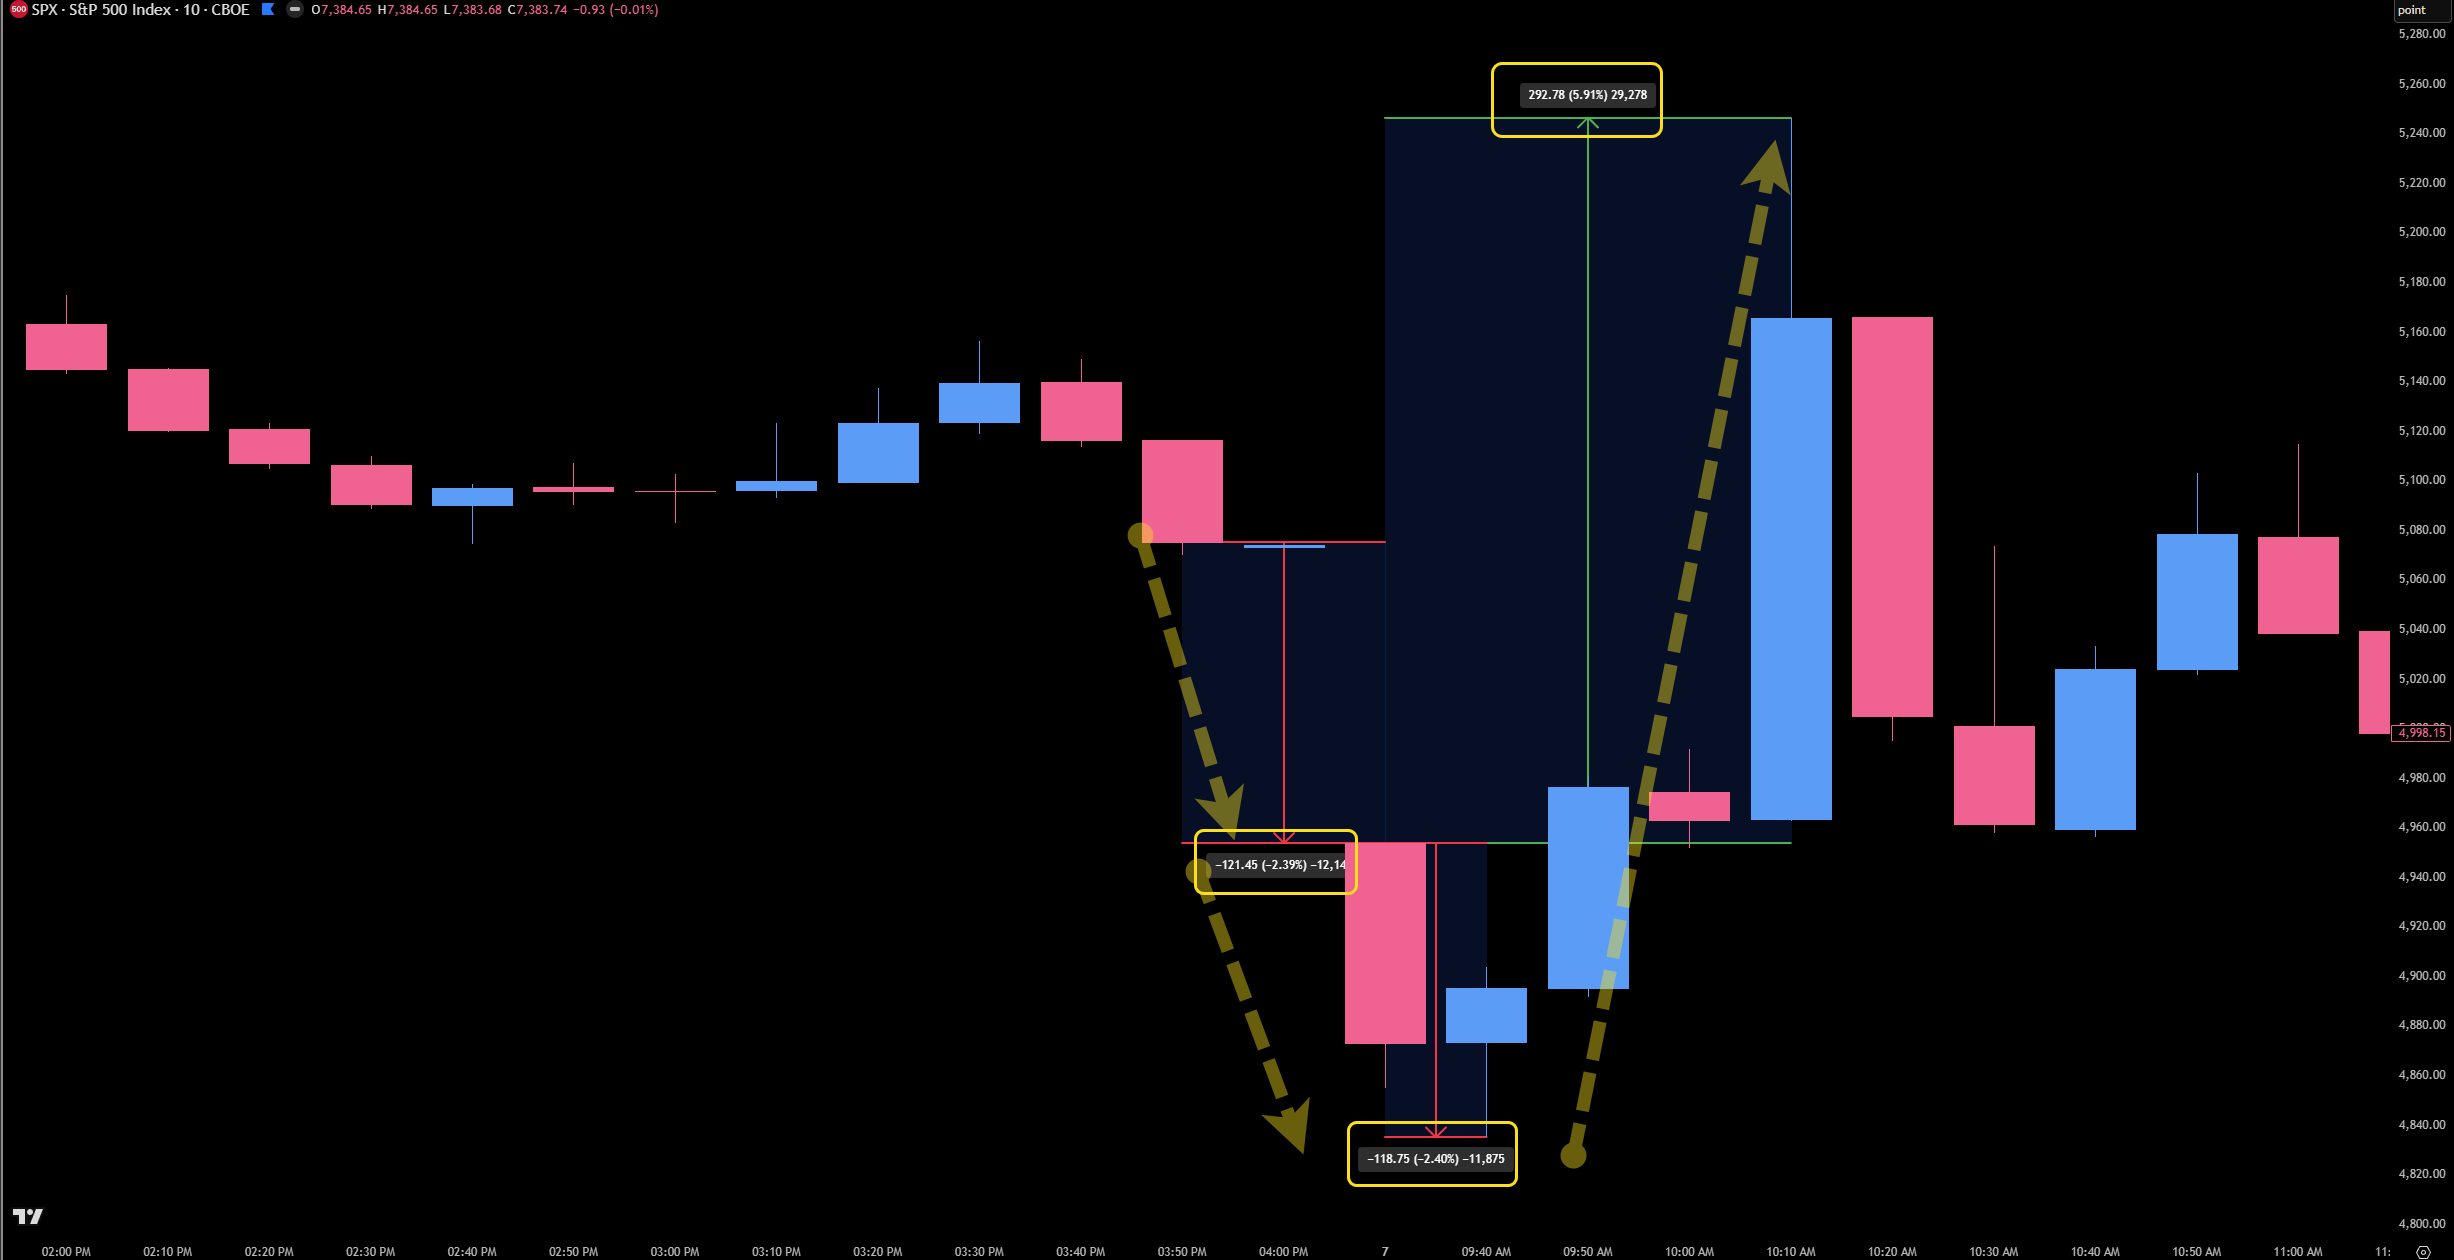
So here’s the trap built specifically for futures traders: a heavy Sunday-night tape, or an outright gap down, is not a reason to abandon the setup. The two best rebound sessions in the entire dataset — August 2024 and April 2025 — were also two of the ugliest overnight gaps, and the cash session still squeezed off its open for +1.9% and +5.9%. Let a red Globex tape talk you out of the plan and you’d have missed both.
The gap is noise. The cash session is where the move lives. Don’t trade Sunday night’s emotion — wait for Monday to open.

The Stat Is Clean. The Path Isn’t.
But here’s where I have to be honest with you, because that daily stat can lull you into a lazy trade. “Wait for Monday to open” is right. “Buy the open” is not.
I pulled the one-minute path for all eight events to see how SPX traveled from the open to that high. It rarely went in a straight line.
Only two of the eight never traded below the Monday open before reaching the +0.65% target. The other six dipped first — half of them by at least half a percent, and a couple by far more. The average drawdown before the target hit was −0.67%. The starkest case was April 2025: SPX eventually squeezed +5.9% off its open — but only after first trading nearly 2.4% below it. Blindly buy the 9:30 print with tight risk and you’d have been stopped out before the move of the year ever started.
And it isn’t just the dip — it’s the wait. Here’s how long it took to reach +0.65% off the open:
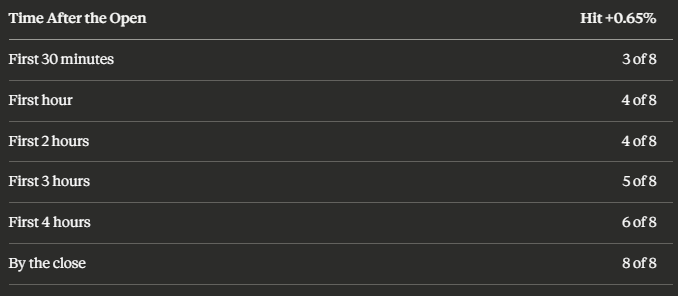
Only three of eight got there in the first half hour. The median event took about an hour and three-quarters; the average, closer to two and a half hours. Two of them — April 2022 and this past March — didn’t trigger until after 3:00 p.m. The rebound window is real. It is not always fast, and it is rarely free.
So the edge is not “buy the open.” The edge is knowing that after a Friday VIX panic, Monday has repeatedly built a rebound — and then trading the structure that gets you in, not the opening bell.
How I’m Reading Monday
Let me be clear about what this is and isn’t. It’s a price-action tendency, not a guarantee, and eight Friday events is a small modern sample — I’m not dressing it up as destiny. It also says nothing about options. A Friday panic inflates premium, the weekend bleeds theta, and a Monday calm-down can crush implied vol right when you think you’re right. The April 2025 path is the warning shot: a violent dip before the rip is exactly what wrecks a poorly structured options position, even when the direction turns out dead right. If you express this with options, solve that math before you put it on.
Here’s the plan I’m working from.
I’m not anchoring to Friday’s close, and I’m not buying the 9:30 print. I let Monday open, give it the first 15 to 30 minutes to show its hand, and watch one thing: does the first downside push hold above the open, or does price dip and then reclaim it? A failed breakdown, an opening-range reclaim, a move back above VWAP — that’s the structure the historical path keeps rewarding, not a blind buy at the bell.
A dip below the open does not kill the trade. Six of the eight events traded red before they squeezed. What kills it is opening straight down and never reclaiming — if Monday just bleeds through its range with no bid, the tendency failed, I’m flat, and I live to trade the next one.
When the structure shows up, the target is the move the data keeps drawing: roughly +0.65% to +0.70% off the Monday open. Near today’s 7,384 close, that’s about a 7,432 to 7,435 zone — and I reset off the actual open, wherever it prints. I size for the truth in the path data: the rebound can take all session, and it can shake me first.
The headlines are screaming. The data is whispering.
I’ll wait for the open, wait for the structure, and trade the whisper.
Until next time—trade smart, stay prepared, and together we will conquer these markets!
Ryan Bailey, VICI Trading Solutions.
Ryan, thank you for this. I can tell you care about your subscribers by the way you revisited and sharpened your earlier work on this topic (which I read! btw). After Friday’s washout, this is right on time and should help take some emotion out of heading into Monday’s session.
One Q: For those trading ES futures and using the plan, would you completely ignore Sunday night's structure, or would you still use the Globex high/low as context once Monday cash opens?
Very good read. This is helpful!