

Welcome back, everyone. It is Sunday again and time for the Weekend Review — and they must be out of their minds, because they let us make it all the way through to do it all over again. Last week we had a smashing week. We called the lows on the sweep at 7737 on Tuesday, and it took us up. On Wednesday we called the short that took us down well over 110 points and kicked off the volatility. On Thursday we held the lows at 7729 on ES and the magic spot on SPX at 7666, which popped us up all day — only for us to get short on Friday and ride this bad boy down. A miraculous day in the trade plan. We knew even on Friday that we were still pointing down on all timeframes and that was the direction to look. I called new lows early that morning in the Discord room, and we made more than that. I am still short one micro from 7770.
Here is what I can tell you for sure: volatility is back. We have had increased ranges, and we are pointed down for the first time in so long on the weekly, the daily, the four-hour, and the one-hour. We are pointed down, baby — at least for now. Do not be surprised if we get a little reactionary pop off Friday’s push down — we could very well see one in the overnight session just so they can smack it again on Monday. Let’s walk through VIX, SPX, and ES.
📧 Check Your Spam Folder Follow-ups and SPX Brief emails are landing in spam. Look for rbailey@vicitradingsolutions.com and info@vicitradingsolutions.com, mark them “Not Spam,” and add them to your contacts so you keep getting them.
☕ FREE — The New & Improved SPX Morning Brief SPX value levels, 150+ indicator prediction assessments, and the day’s top news — in your inbox before the bell. Completely rebuilt and completely free. Seats are limited and they fill up fast. Get your seat now → https://go.vicitradingsolutions.com/spx-brief
A Note on This Week’s Market:
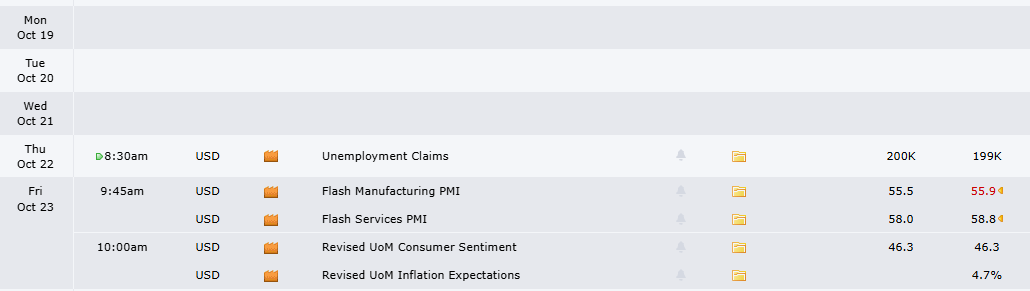
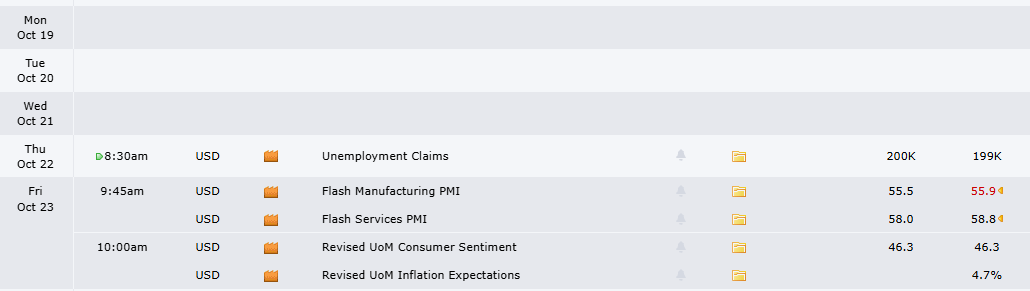
News: I did not dig into the calendar this weekend, but last week’s inflation numbers on CPI and PPI got people a little spooked, and we have a hawkish Fed that is not afraid to raise rates to get it handled. Add the midterm feud in the geopolitical headlines, and we are coming into a season with a lot of issues in the marketplace. Back in the spring I put out an article — twice — showing roughly a 76-78% chance of a bear market this year tied to the midterms. I am not saying we are going into a bear market. But we have been due for this pullback, and do not be surprised if it is a little steeper than most people anticipate.
Data — History Says: My History Says post fired Friday. 33 times in 30 years, when VIX is up over 10% in October and we are down over a percentage point, there is a 63% chance of moving 0.32% higher the next day. This just happened on October 14th, and we called the pop on the 15th. When VIX closes up over 20%, we have a strong possibility of rallying within the next day or so — to pop back up to something we have tested, just to get short again. This is not a get-long signal. It is a relief-pop warning.
Range: Volatility is back. We are out of summertime and seeing increased ranges again. The ES six-week and five-week composite profiles show months of balance — and now we are pushing out of it.
Volatility: VIX broke out of its $14-$15 accumulation on Friday, launched above 17.50, and ran through 20.66. As long as VIX holds above 17.44, the indices face a constant headwind.
Trend: Down on all timeframes — weekly, daily, four-hour, and one-hour. Per the process, we are short-only. Every pop is a spot to look for the smack. Do not put your bias in front of the process.
🧠 Current Market Context
The First Full Loss In A Long Time — And Where We Are Headed
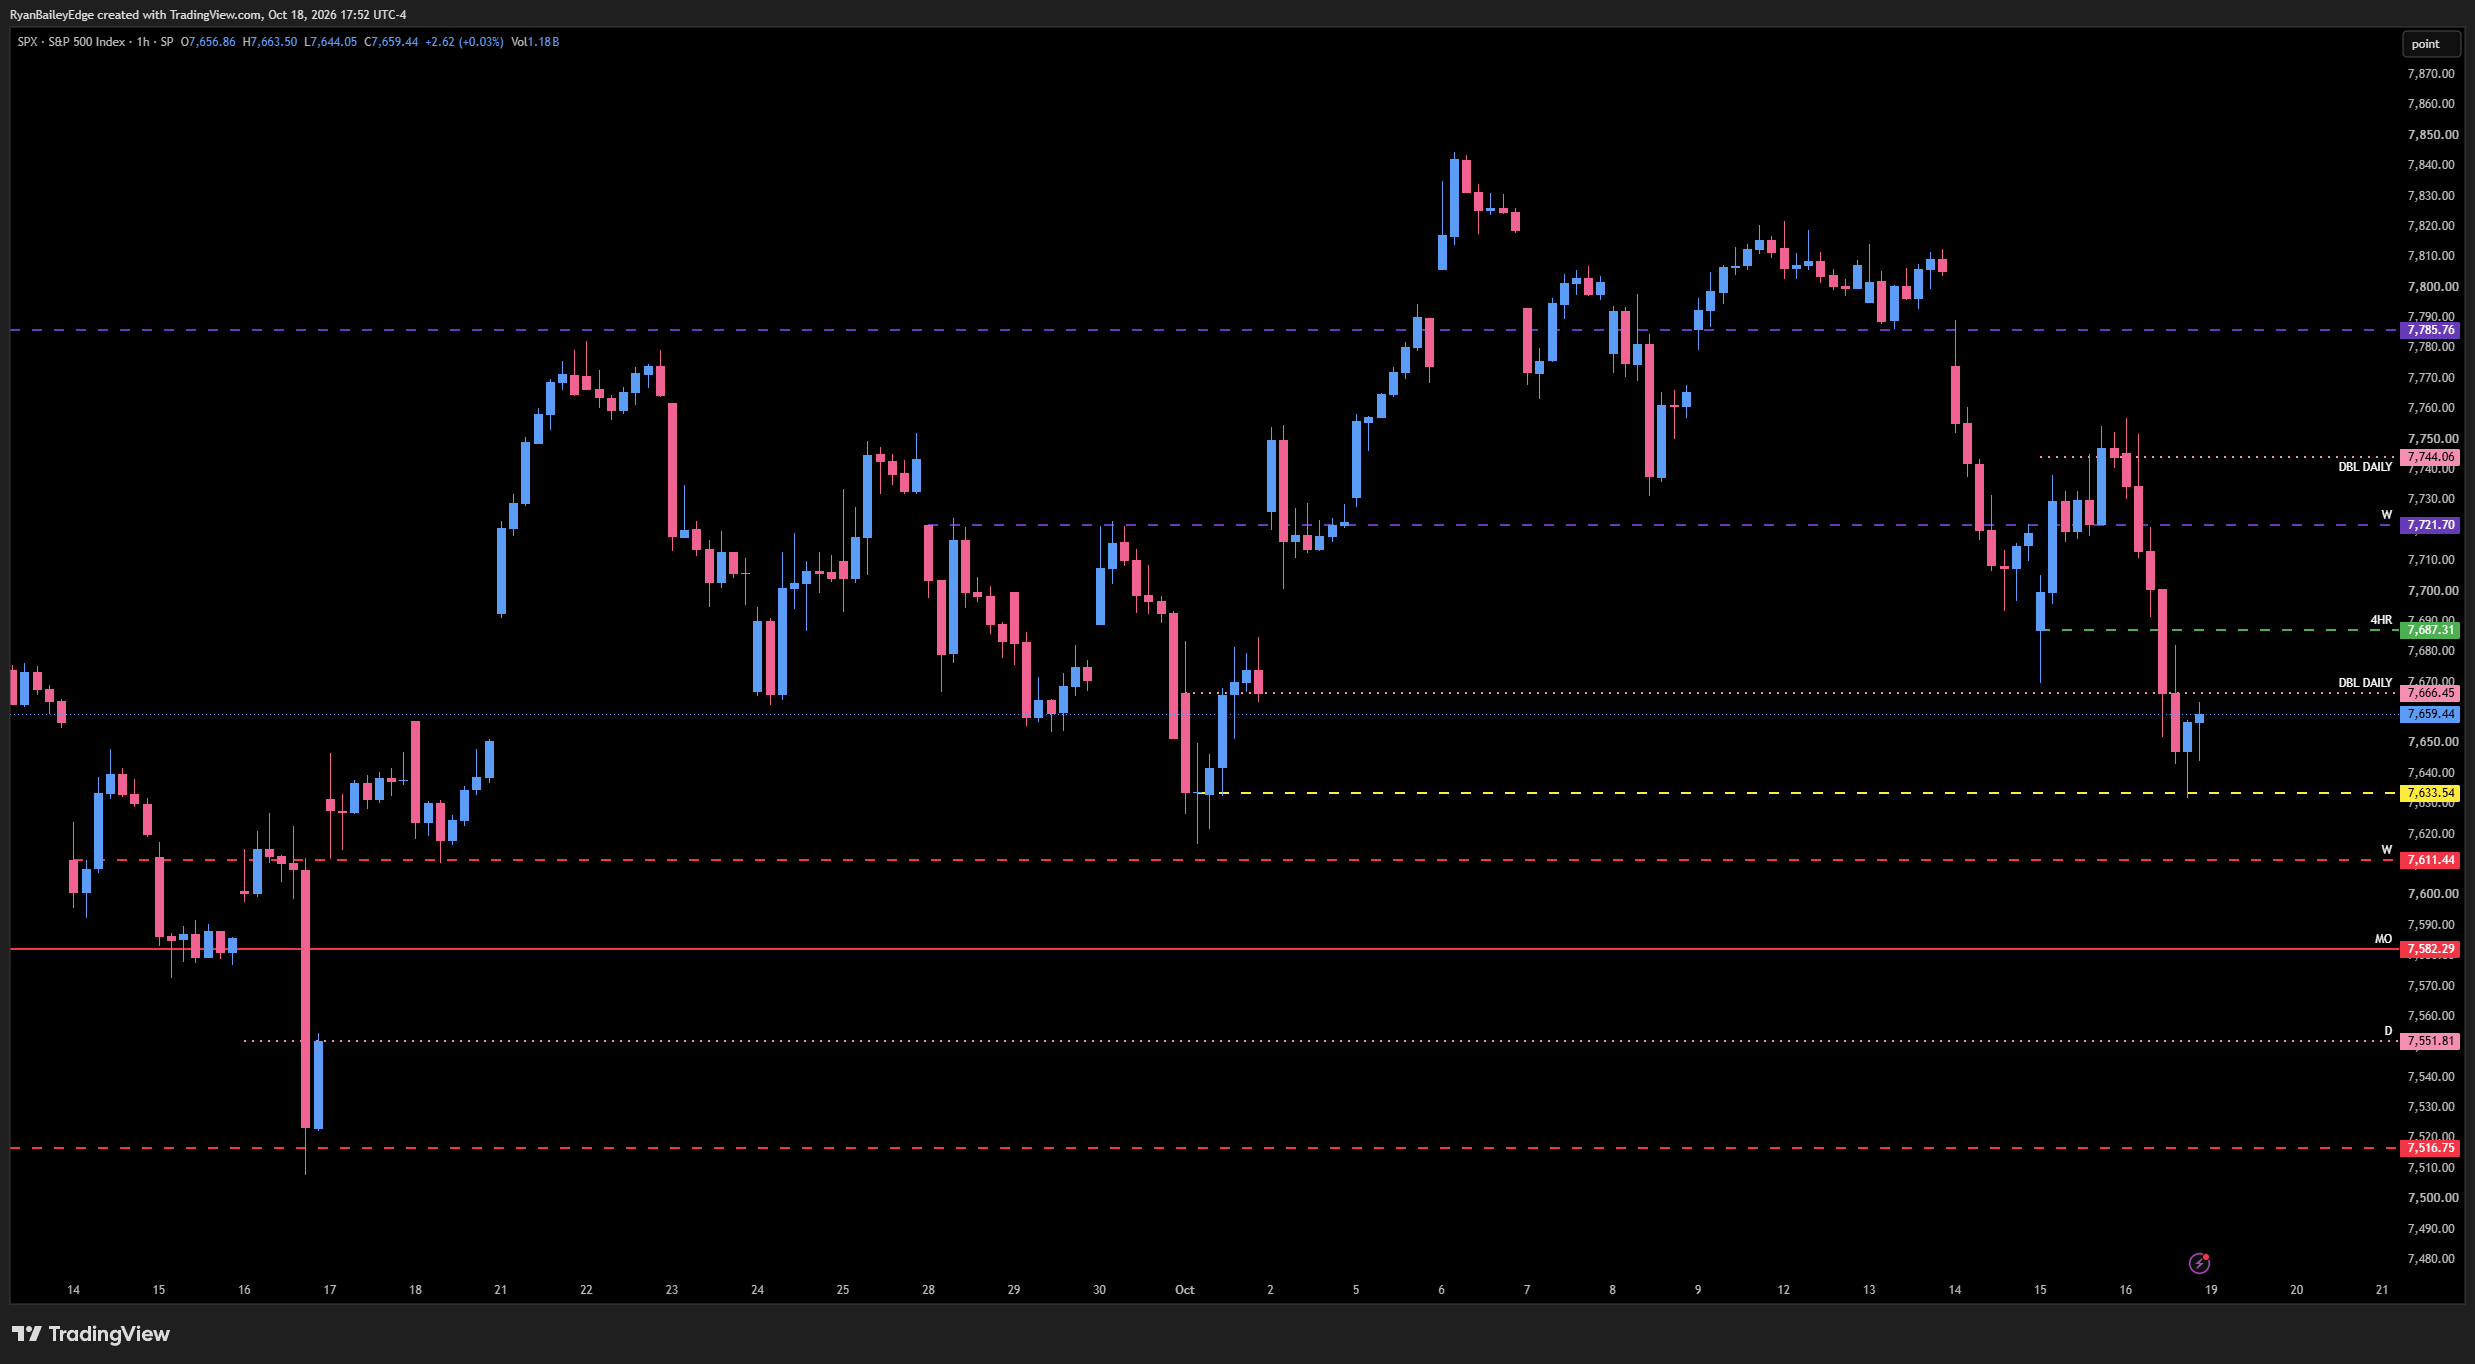
This is a big week, and I want to be clear about why. I recharted everything because we have had a massive move, and this is the first time in a long time that we have lost the sub-leg of our leg to the all-time high. In my opinion, this is ugly — I am talking about finally getting some real rotation. We knew even Friday that we were pointed down on all timeframes, and the process has been nailing it. So the play this week is simple: look for the pops, smack them, and ride the targets down — while respecting that we could get a relief rally first.
On the ES weekly TPO, I went all the way to the monthly profile and found a big spot at 7770 — surprise, surprise. Then I stacked the composites: a six-week profile from 8/2 to 9/20 and a five-week profile from 9/20 to 10/10. Even inside these monster profiles, there is a high-volume node, the five-week POC, and a clean split between buyers and sellers. Last week’s profile intersects right at that high-volume spot. We closed Friday at 7697 — a big stinking deal. Below the previous weekly value area low at 7755, we are very bearish — and that should make sense, since 7753 was our big pivot previously. 7770 is where things start to tip to the upside. I do not want to call it bullish above, but look at that shallow area above it: if we get above the 7779 TPO ledge — call it 7780 — we could start to fill all of that in to build a more efficient, balanced profile. That ledge represents a lot of time spent there, it sits by a huge cluster of buyers, and there is a single 8,000-contract buyer in there. If we push above it, the fill becomes the trade.
On SPX, our first target is under 7620, the 7611 area — but in my opinion we are coming every bit underneath 7500. Not in a straight line, but that is where I think we end up. My first stop is somewhere around 7450, because there is a massive area of back-and-forth there that will offer some support. Ultimately, I think we can come down into the 7000 range, which I have been talking about since June. For resistance, we played the 7803 weekly literally to the tick on Friday — that is what sent us down, and it is why I am still short. Keep an eye on the 7721 weekly and, if they move higher, the 7785. If they push above 7721, we start to get momentum back to the upside and I would not be as bearish. On the daily, we just closed underneath our leg to the all-time high — a loss on the daily and a loss on the weekly — so there is no reason we do not come down and play our original leg inception at 7551. That is my first major target, and we could be there Monday or Tuesday depending on the open; they could gap it down. On the way, watch the big 7582 monthly and the 7611 weekly, which is tested. 7551 is the lowest untested daily — it will probably get a reaction, but I do not think it saves us, and from Friday’s close to there is 110 points. On the one-hour, they held the last untested one-hour at the lows with precision, and the 7666 four-hour — Thursday’s big play — remains big for above/below. Above it, the 7687 four-hour lines up nicely from the left; I have it marked as significant and I am watching it, since it got close to being tested. T1 on SPX is 7611, then the big 7582 monthly.
🚨 VIX Analysis: The 17.44 Headwind Line
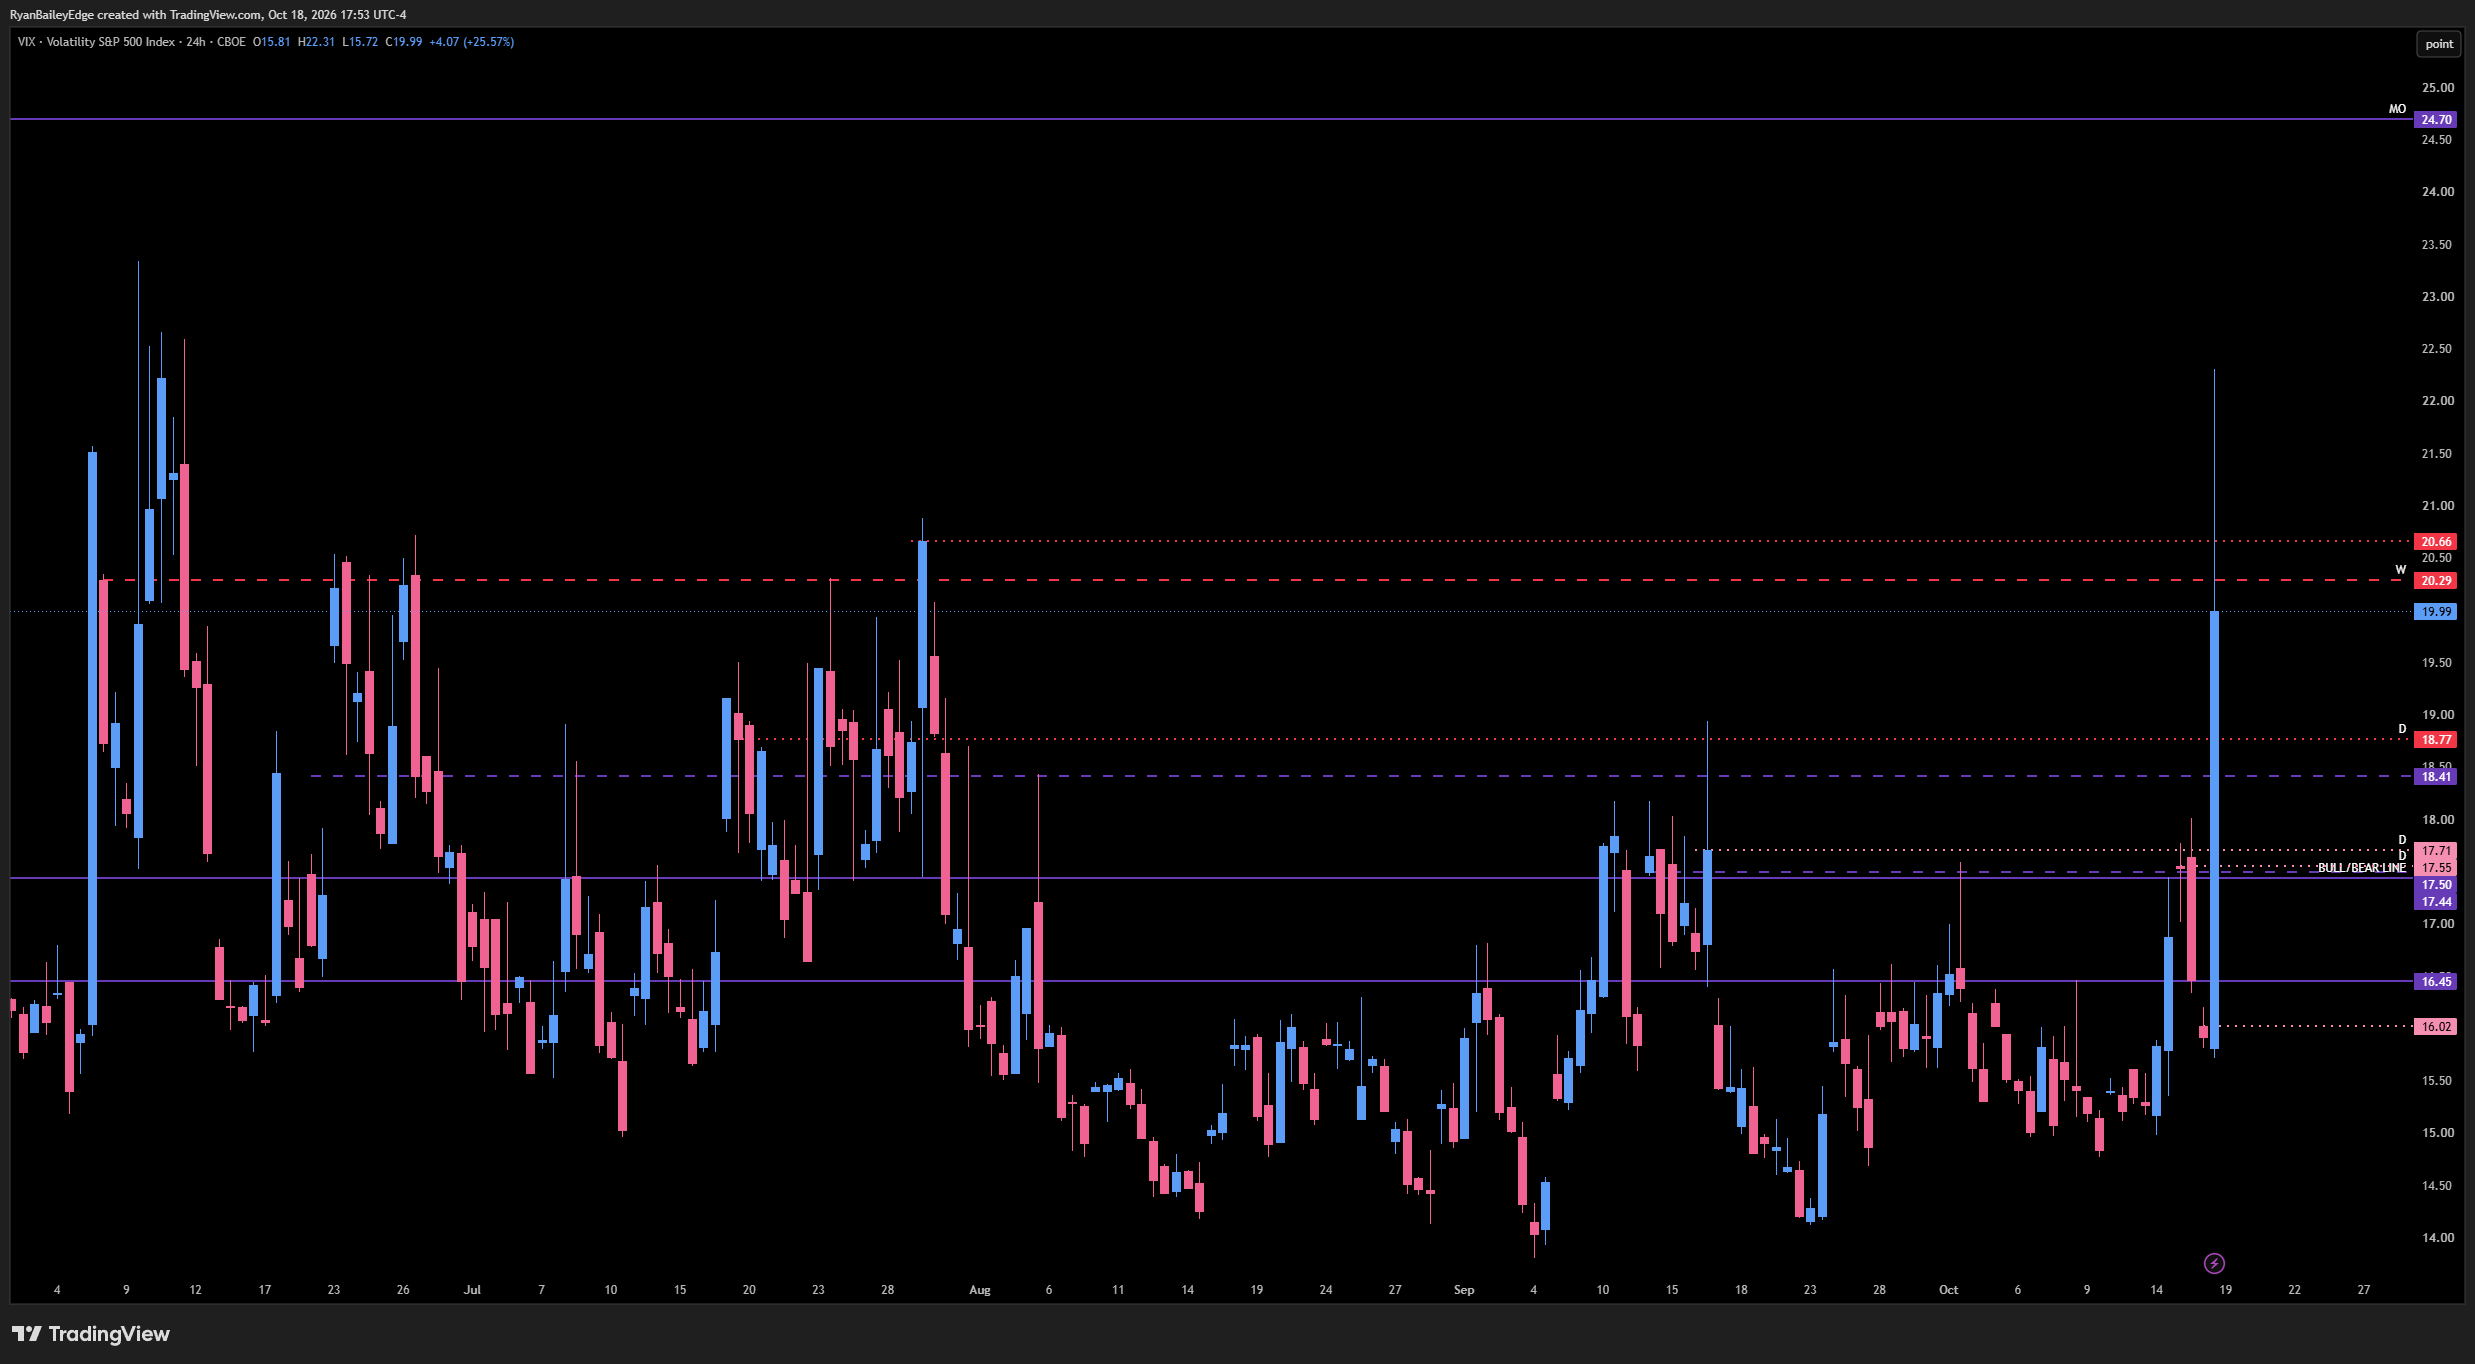
VIX did exactly the accumulation phase we spoke about. Since August we were suppressed through the summer months, creeping and grinding to all-time highs, and I kept telling everyone the $14-$15 handle is extremely reactionary and eventually they would buy it up. Then the 17.44 monthly came into effect big time over the past few weeks.
The Headwind Line: 17.44 (Monthly) — call it 17.50 to keep it easy. As long as VIX is above 17.44, we are inherently bearish on the indices. Underneath 17.50, the indices are very bullish. Above it, it is a constant fight for the indices.
The Breakout: Friday we got absolute liftoff above 17.50 — we figured it would launch, and it ripped through our 20.66 area and poked a little higher. Even after the pullback, VIX is still holding major support.
The Pullback Support: 18.41 (Weekly), and more importantly the 17.44 through 17.71 daily/weekly/monthly heavily stacked area. This area will, without a doubt, get a reaction if we come back and touch it — VIX could easily kneel down into it and catapult back up, assuming 18.41 does not play first.
The Relief Path: If VIX moves below 17.44, the indices get quite a tailwind, and there is one more untested spot: the 16.45 monthly and the 16.08. Those could provide reactions, but by then VIX would already be below the big level and the indices should be cooking to the upside.
The Next Breakout: 20.29 (Weekly) and 20.66 (Daily). These are the next levels for VIX to break out above.
The Inverse Long Spot: 24.70 (Untested Monthly) and a big daily with it — a spot we talked about last spring, which is insane how long it has been. I would anticipate a huge reaction from here. If VIX comes into this spot, look for an inverse long on ES — a monster smash that could take VIX back to the $20-21 handle or further.
The Unknown: Above 24.70, we could come all the way to 30.04. We have not been there in a long time, and honestly, after how long the indices have been climbing, it is time for VIX to get a little pop so we get more volatility.
🎯 Detailed Actionable Trade Plan (ES Futures)
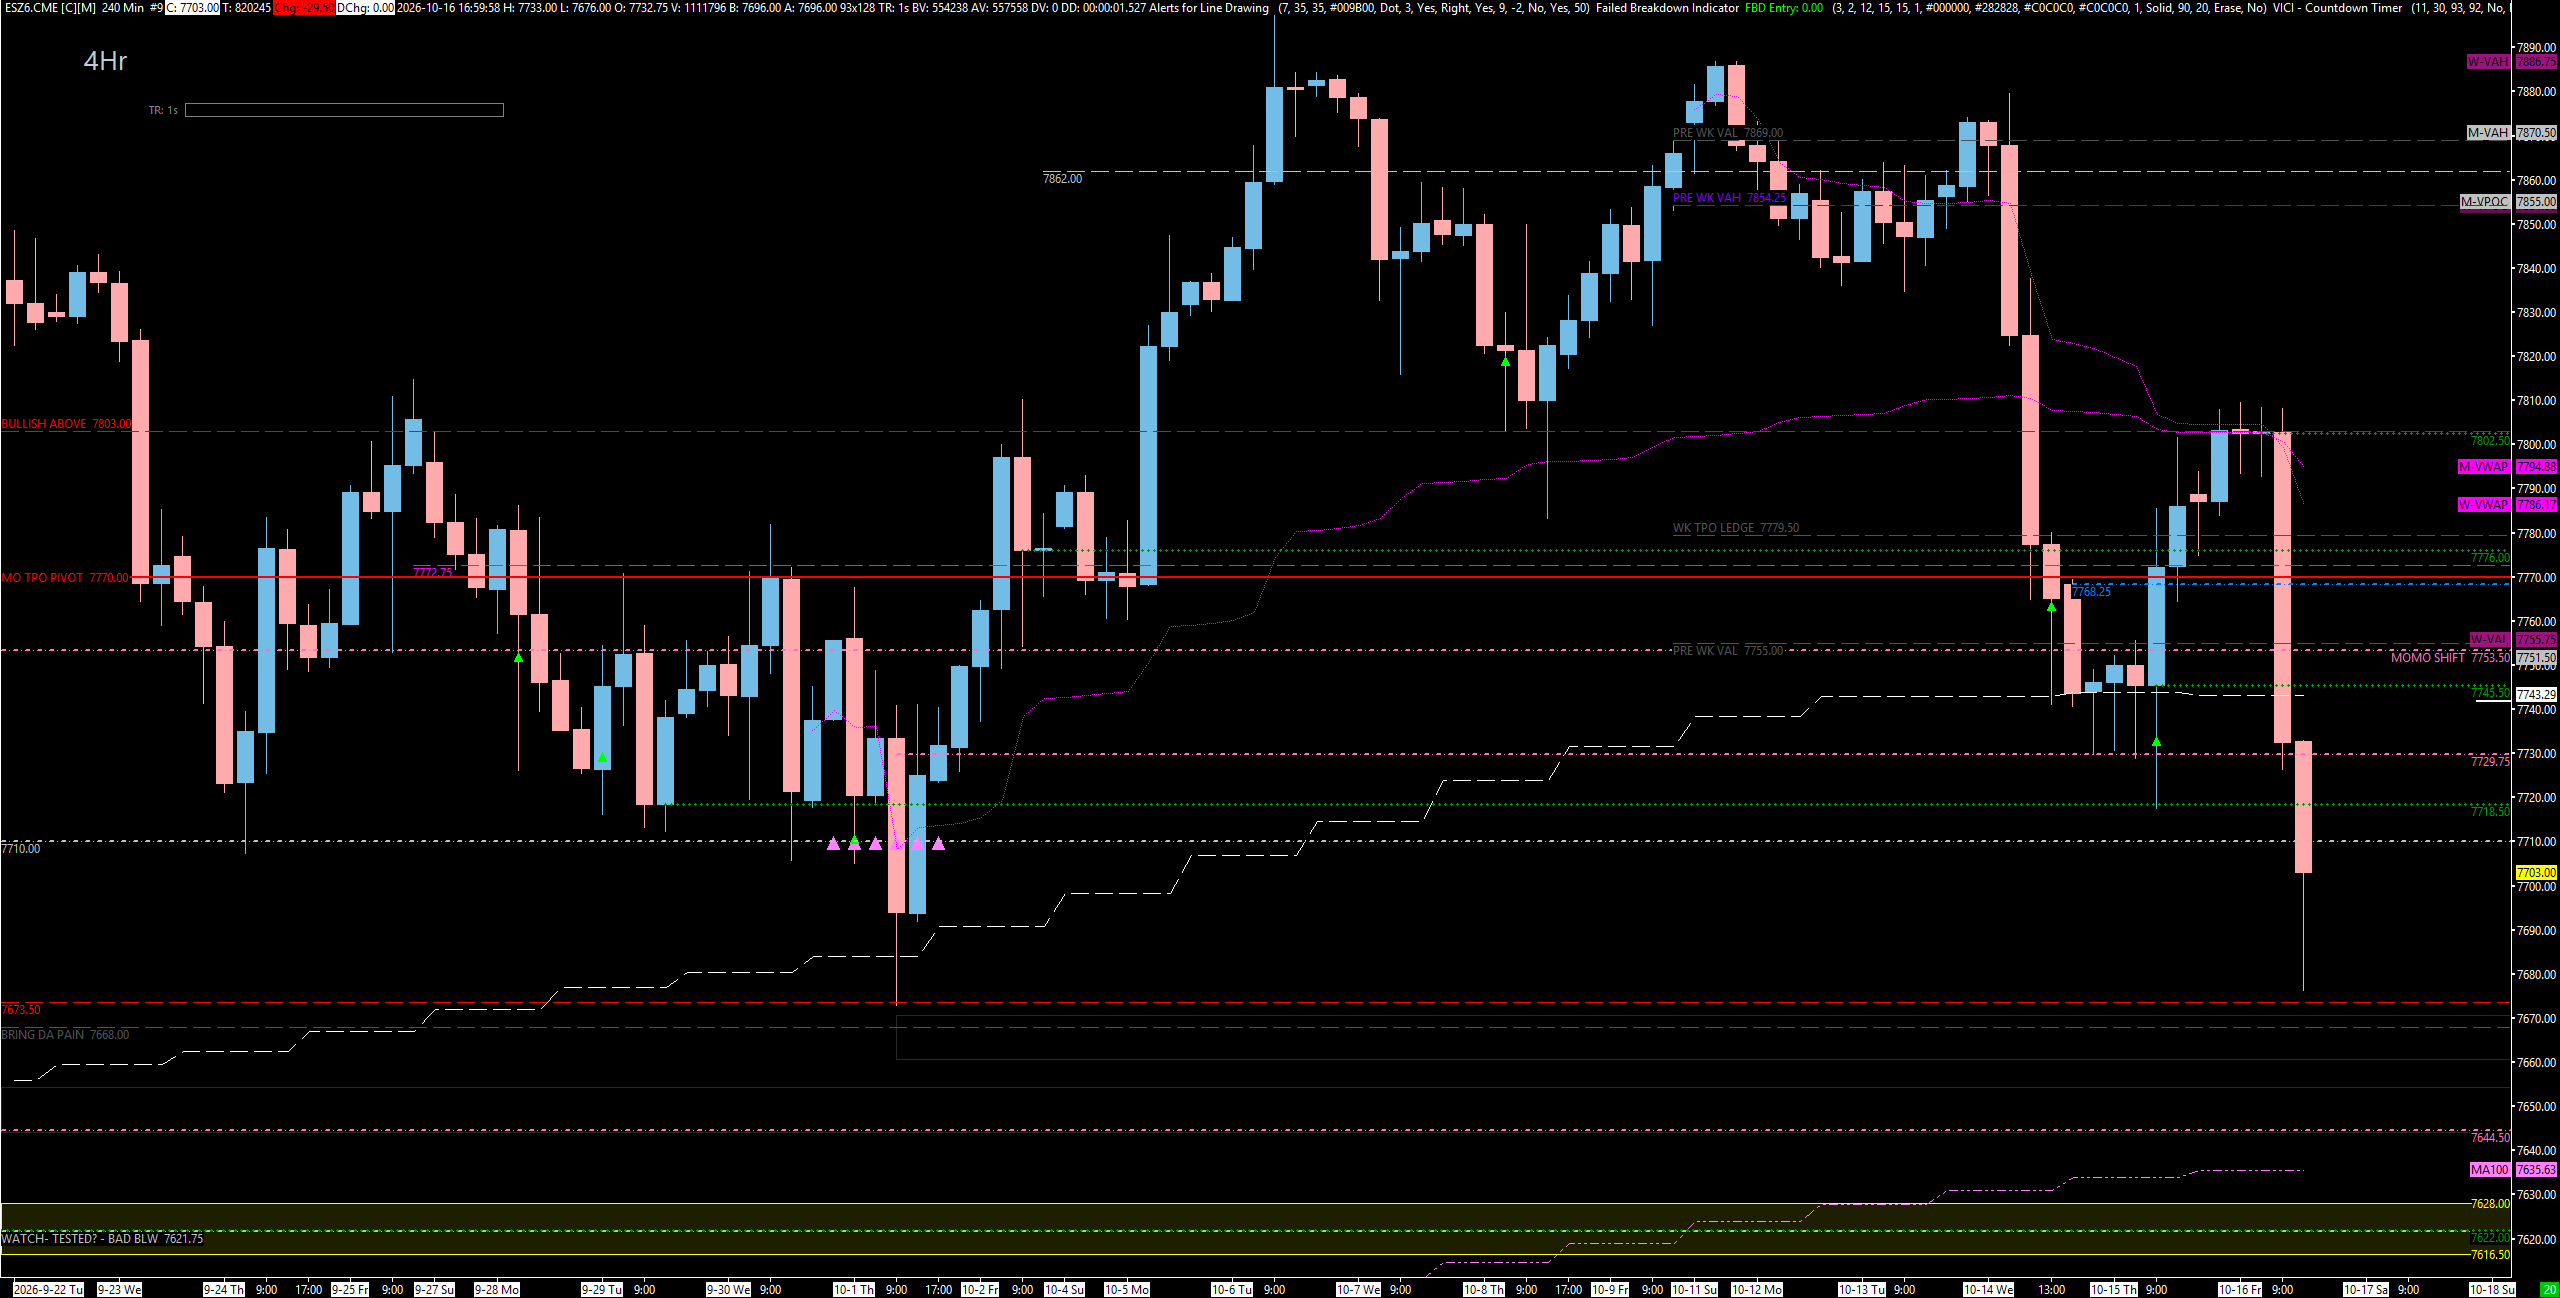
We are down on all timeframes, so we are short-only. They will probably squeeze a couple of these levels — be prepared for it — but we do not know which one, so we do our thing. The stack overhead is clean: 7718.50, the 7729.75 daily, the 7745.50 - 7755 cluster that I think is super trouble for the bulls, and the 7768 - 7779 zone where everything shifts. As long as we stay below 7772 — really below 7803 — we are coming down. Above 7803 we are very bullish, and above 7800 we are on the move. On the way down, the targets are the 7673 weekly, then 7644 — my first target on the short and the only untested daily left — then 7625, and ultimately 7507, at least another 200 points lower.
🔴 Key Resistance Zones & Setups
The Thursday Low 4-Hour: 7718.50
7718.50 (Tested Four-Hour).
Context: I do not want to count out 7718.50. It is there, it played beautifully at the low on Thursday, and we have a ton of structure from the left. It is the first four-hour above Friday’s close.
Actionable Setup: Short Setup: It could just end up getting a reaction here as resistance. Watch for the smack on any relief pop — we do not know which level they squeeze into first.
The Daily That Keeps Playing: 7729.75
7729.75 (Tested Daily — Played Four Times).
Context: Typically not one of my favorites, but I will not ignore it. How many times could they possibly play this thing? Four times with precision, and one swoop down to the 7718.50 four-hour. It is our leg to the high, so if we backtest it from below, I would look for a reaction.
Actionable Setup: Short Setup: If we approach from the bottom side, look for the reaction and continuation lower.
The Super-Trouble Zone — 4-Hour, Daily & P.W. VAL: 7745.50 - 7755.00
7755.00 (Previous Weekly Value Area Low), 7753.50 (Daily — Previous Big Leg Down), 7745.50 (Untested Four-Hour — Thursday’s Move To The High), plus the 50-Day Moving Average.
Context: This is a pretty sweet spot. The 7745.50 four-hour is untested — it is the move to the high on Thursday, and we got five opens and closes on the four-hour right there. Above it, the 7753.50 daily — our previous big leg down that we have talked about a hundred times and that was huge last week — and the previous weekly value area low at 7755, below which I am bearish. The 50-day moving average sits right in here too. This is a big, thick spot.
Actionable Setup: Short Setup: I think this area gets mad love, but the bulls are going to have a very hard time getting through 7745.50 to 7753.50 — it is going to be super trouble for them. Fade the reaction and target back down. We want to stay below 7753.50.
THE SHIFT ZONE — Monthly TPO Pivot, Weekly & 4-Hour: 7768.00 - 7779.00
7779.00 (Weekly TPO Ledge), 7776.00 (Four-Hour), 7772.00 (Very Much Untested Weekly), 7770.00 (Big Monthly TPO Pivot), 7768.00 (ETH Daily).
Context: In my opinion, this is where we shift. We have the big monthly TPO pivot at 7770, the 7772 weekly that is very much untested, the four-hour at 7776, an ETH daily at 7768, and that big weekly TPO ledge at 7779. A ton of confluence — and it just so happens I am short from 7770. This is the upper side of the weekly support spot, which now acts as resistance from below.
Actionable Setup: Short Setup: As long as we are below 7772, we are leaning to the downside. This is the prime short zone on a relief rally.
Warning: If they get above 7772, things start to shift back to the upside — and above 7776, we really shift momentum big time. Above 7779 / 7780, we start to fill in that shallow area of the profile.
The Line That Decides It — Untested 4-Hour & The 7803 Weekly: 7800.00 - 7803.00
7803.00 (Tested Weekly — Friday’s Short, Played To The Tick), 7802.50 (Highest Untested Four-Hour), 7800.00 (Momentum Line).
Context: 7803 was our big short on Friday — we played the weekly literally to the tick, and that is what sent us down. Right with it is the 7802.50 four-hour, the highest and most untested four-hour on the board. This is our big pivot point.
Actionable Setup: Short Setup: If we get up here, I do believe this gets a reaction, probably back down to 7776 and into the big support below it.
Warning: Above 7803, we are very bullish — and once we are above 7800, we are on the move and go back up after testing this area. Keep your stops over this zone.
🔵 Key Support Zones & Setups
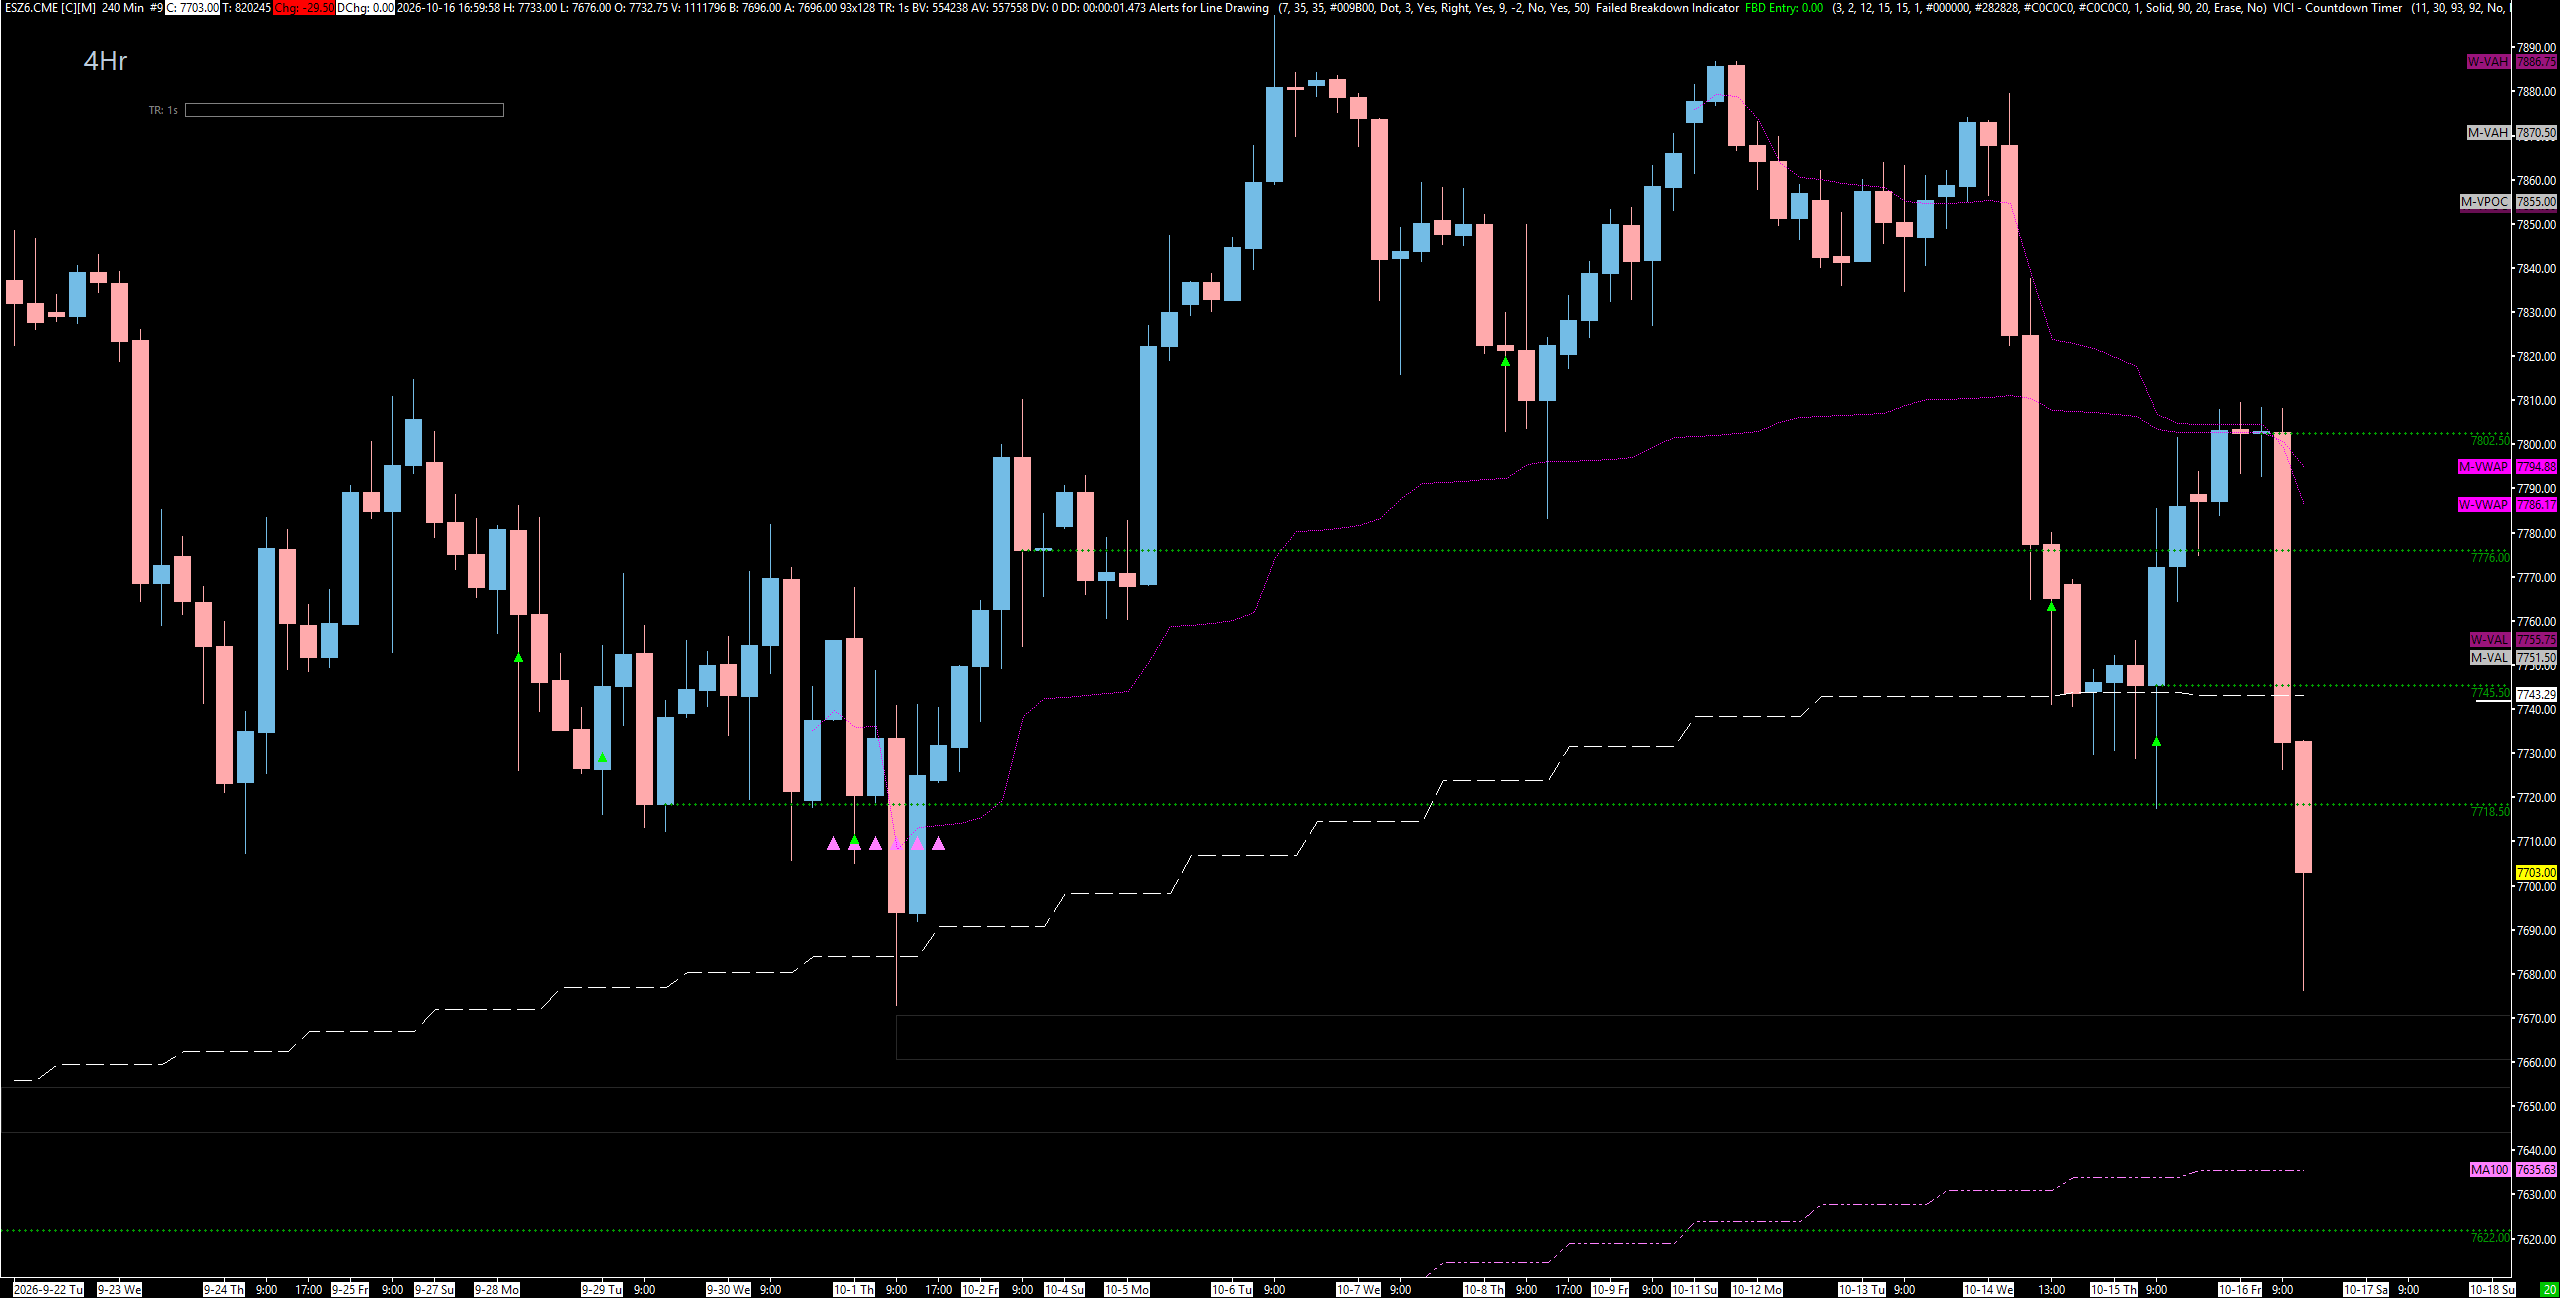
The Big Weekly — Support Turning To Resistance: 7673.00
7673.00 (Tested Weekly — Big Weekly Leg Up), plus the big composite value area.
Context: 7673 was our big weekly leg up. We played it, backtested it, and it sent us to new all-time highs — and here we are basically touching it again, giving us a massive area of support. Look how many times this weekly has been tested from the bottom up. Right with it sits one of the big monster composite value areas — and underneath it, my chart literally says “bring the pain.”
Actionable Setup: Watch for a reaction here — but once we fall beneath it, guess what it becomes? A massive area of resistance. Once we get underneath it, it is going to be super heavy.
Warning: Below 7673, we are in super big trouble.
THE FIRST SHORT TARGET — Last Untested Daily: 7625.00 - 7644.00
7644.00 (Untested Daily — First Short Target), 7625.00 (Extended Target).
Context: This is where I really think we are coming. 7644 is my first target on my short — it is the only untested daily left underneath, and that is it for untested. I do believe we sweep this low. I do not know how they get there — they could back up into the levels above first — but this is where I am gunning.
Actionable Setup: Take Profits: At the very least, I think we see 7644, if not the 7625 area, probably early next week or sometime this week. Take profits here and then decide the rest. We either hold here — and good luck, given that weekly above — or we keep going.
The Extended Downside — 7507 And Below:
7507.00 (Extended Target), 7635.00 (Yearly VWAP Pinch Level), 7273.00 (200-Day Moving Average).
Context: If we lose 7644, the next stop could be all the way down to 7507 — I think we come down at least another 200 points. In what fashion, I do not know. And something else I noticed on the yearly VWAP chart: we just tapped the one standard deviation after butting our head on the value area high, and the yearly point of control is pinching right up against it. When a value area edge and the POC get that close, they often go the other direction. If we get sucked in underneath 7635, we will more than likely come straight to the 200-day moving average at 7273, and ultimately into that 7000 pocket I have been talking about.
Actionable Setup: These are high-timeframe targets for the short, not places to get long. Take profits along the way and let the process guide each step.
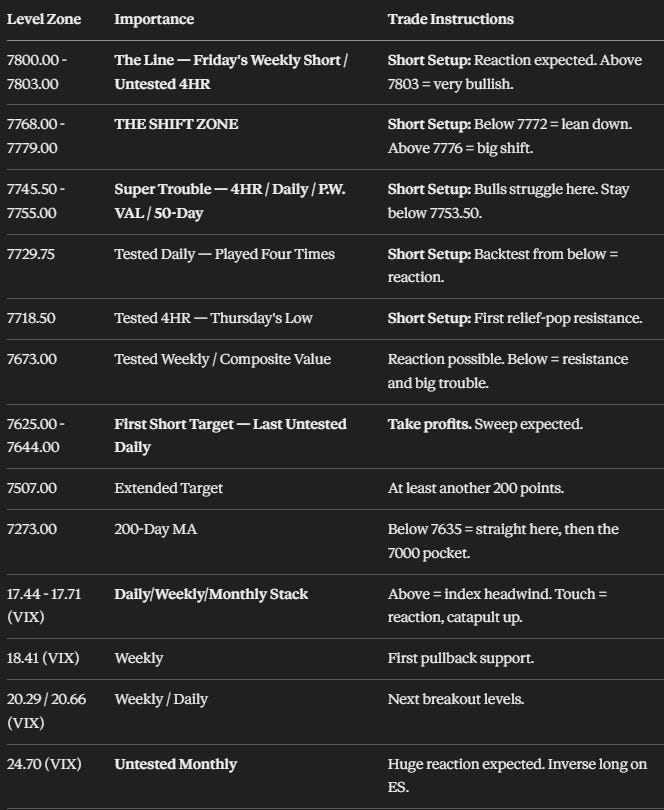
📌 Cheat Sheet – Key Levels Recap
🧠 Final Thoughts
I have given you the low-down: all the high-timeframe resistance and all the high-timeframe support — which is not much. Please keep in mind we are pointed down on all timeframes. We are coming down. Do not put your bias in front of the process. Always trade the process first. The History Says data tells us we will probably get a relief pop — that does not mean get long; it means get ready to short something we have already tested. The overhead ladder is clean: 7718.50, the 7729.75 daily, the 7745.50 - 7755 super-trouble zone, and the 7768 - 7779 shift zone where I am short from 7770. As long as we stay below 7772 — really 7803 — we are coming down. On the way, take profits at the 7673 weekly and then 7644 / 7625, my first target. Below that, 7507 is on the table, and if we get sucked under 7635, the 200-day at 7273 and the 7000 pocket come into play.
Keep VIX front and center. Above 17.44, the indices face a constant headwind. A pullback into the 17.44 - 17.71 stack should get a reaction and catapult VIX back up, and if VIX ever runs into the 24.70 untested monthly, that is the spot to look for the inverse long on ES. Be patient — there will be plenty of trades. We had a ridiculous week last week, and if you did not, do not worry. Vol is picking up, we are getting the moves, and we are going to do it all again.
If there are any Trade Plan subscribers out there who are not in the Inner Circle, hit me up — I will get you in with a little free trial so you can come check it out, get some juice, make some money, and do our thing. Thank you so much for joining me. I will see you tomorrow for the post-market breakdown, and my peeps in the Inner Circle — we conquer the markets mañana. Cheers.
Until next time—trade smart, stay prepared, and together we will conquer these markets!
Ryan Bailey, VICI Trading Solutions.
📊 Indicator String
Copy and paste the levels below into your S&P Edge Levels indicator to automatically plot today’s key levels on your chart:
7803.00|Tested WK|TW
7802.50|4HR|4H
7776.00|4HR|4H
7772.00|WK|W
7768.00|D|D
7755.00|P.W. VAL|GD
7753.50|D|D
7745.50|4HR|4H
7729.75|Tested D|TD
7718.50|Tested 4HR|T4
7673.00|Tested WK|TW
7644.00|D|D


