

Welcome back, everyone. It is Captain Bailey, and I am here to bring you another edition of the Weekend Review. It was an absolutely phenomenal week for Trade Plan subscribers — we slayed it again. We had the short at the highs at 7740. I even put a tweet out the day before the fall just to see who was paying attention. Not many people outside the Inner Circle were, but those of us who were prepared capitalized first thing Thursday morning, and they came screaming down. It was some of the fastest money we have ever made. That move was exponential — one for the record books. We have not seen a fall like that, percentage-wise, since COVID. It was the first market halt I have seen since COVID, and watching the NASDAQ stop when it hit down 7% was unbelievable. We just do not see that anymore, because these markets have trained everybody to go up.
This is the fun part of trading. We have extreme volatility, and increased VIX is causing negative gamma — dealers hedge to the downside, and that gives us these outsized ranges. It also makes trading very difficult, because you can trade very small size right now and still make or lose a lot of money.
Before we dig in, I want to apologize for missing two post-market breakdowns last week. I went to Miami for a friend’s 50th and caught a doozy of a case of bronchitis on the plane. I have been to the hospital, I have my meds, and I am doing the best I can — but here I am on a Sunday, because this is going to be a fantastic week. As many of you know, I have been calling these massive 200-point targets — up, down, left, and right — and we have been getting them right on time and right on point. Let’s find out if the prophecy will be fulfilled once again. We are walking through VIX, SPX, and ES, plus some data I want you to see.
📧 Check Your Spam Folder Follow-ups and SPX Brief emails are landing in spam. Look for rbailey@vicitradingsolutions.com and info@vicitradingsolutions.com, mark them “Not Spam,” and add them to your contacts so you keep getting them.
☕ FREE — The New & Improved SPX Morning Brief SPX value levels, 150+ indicator prediction assessments, and the day’s top news — in your inbox before the bell. Completely rebuilt and completely free. Seats are limited and they fill up fast. Get your seat now → https://go.vicitradingsolutions.com/spx-brief
A Note on This Week’s Market:
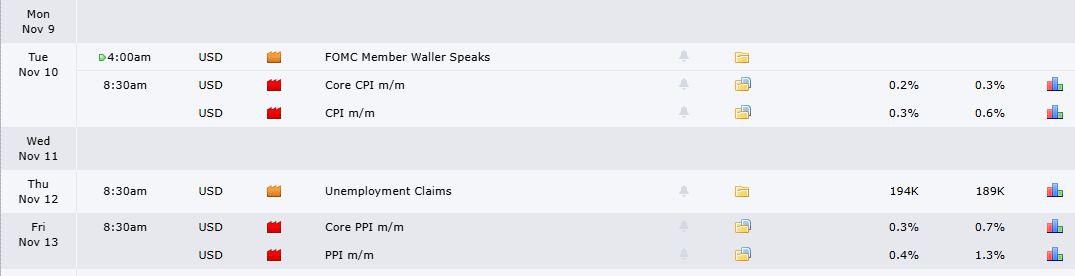
News — The Midterm Cycle: I have been writing about this since February: the midterm crash. Every four years we have a midterm election, and 12 of the last 17 times we ended up in a bear market, with an average drawdown of 18.7%. What is interesting is what happens after: a massive push down, and then we end up roughly flat on the year — within about 1-2%. I followed up in March and April, and on October 28th — before the fall — I put out a post showing this has played out 21 out of 21 times since 1942. History does not repeat itself; it rhymes.
Data — History Says & The Perfect Storm: My bot pulls 30 years of one-minute SPX data, and we build our own TWAPs and volume profiles — everything proprietary. Both a History Says post and a Perfect Storm post fired Friday, and a few times this week. History Says only flags setups with a 60% or better probability over 1, 5, and 10 days, and Friday’s shows an 80% chance of a 1.17% move higher the next day. Because the process is pointed down, I only focus on the one-day. The Perfect Storm shows up only about 20 times a year — 16 of my 34 oversold indicators have to fire at the same time — and it is so rare I do not even have enough data to project it. We are extremely oversold.
Range: Massive. Friday did over 88 points in the cash session and over 150 points including Globex — and that looked like nothing next to Thursday. Tonight we opened down around 7365 and ripped to 7420 — about 50 points in under 30 minutes. A 1% pop is only about 70 points right now. Do I think we can move up 100 points? Absolutely.
Gamma: Negative gamma. Increased VIX forces dealers to hedge to the downside, and that is driving the extreme volatility and outsized ranges. Size appropriately.
Trend: Still pointed down. We have not gained anything — no four-hour, no one-hour, no daily, no weekly. It would take days, if not weeks, of price action down here to gain a level, especially with VIX spiked like this. Maintain the bearish position. The theme is pop to come down farther.

🧠 Current Market Context
The Midterm Crash Is Here — And It Has Only Just Started
I wrote the first midterm article back in February. I know it was early — the midterms are in November — but this is very cyclical, and we could see it in the market as we started to base sideways and things got a little cooked. Everybody thought I was crazy, because we kept drifting sideways and higher in these massive ranges, and it felt like nobody would let this market come down. But I rely on the data, not on what people do. We do not guess. We do not trade off of feel or what we saw on Twitter. We do what hedge funds do — a mathematically sound strategy with the odds in our favor. That is the only way to be long-term sustainable in this business. I have been doing this 20 years, and these are lessons I paid for dearly that I am sharing with you for free. I highly encourage everyone to check out these articles.

This is not a time to be scared. As Warren Buffett put it — be fearful when others are greedy, and greedy when others are fearful. Everybody has been bullish for a long time, and now everybody is scared: the AI bubble is popping, Bitcoin is selling off, and you are going to see all the high-risk assets sell off — even gold and silver. In a liquidity crisis, or even a pullback, nothing is truly safe, and diversification seems to work better in bull markets than bear markets. A lot of people on X and Substack are telling you to buy the dip right now. In my opinion, that is terrible advice. It is not the time to buy. 90% of traders do not make it past their first year, and most of the people trading today have never seen a real bear market. I think this phase has just started, and we see at least another 400-600 points to the downside. If there is something you just have to have, buy a little — but save your money, because we are coming down into buying territory. I promise you will know when the time is right. I will make it known. My big high-timeframe target is somewhere between 6800 and 7000, and we could come a little lower than that. This is healthy. Bear markets have historically been far shorter than bull markets — we sacrifice a year or two of gains for years of upside. It is time for a little relief. We need to get some value in this market.

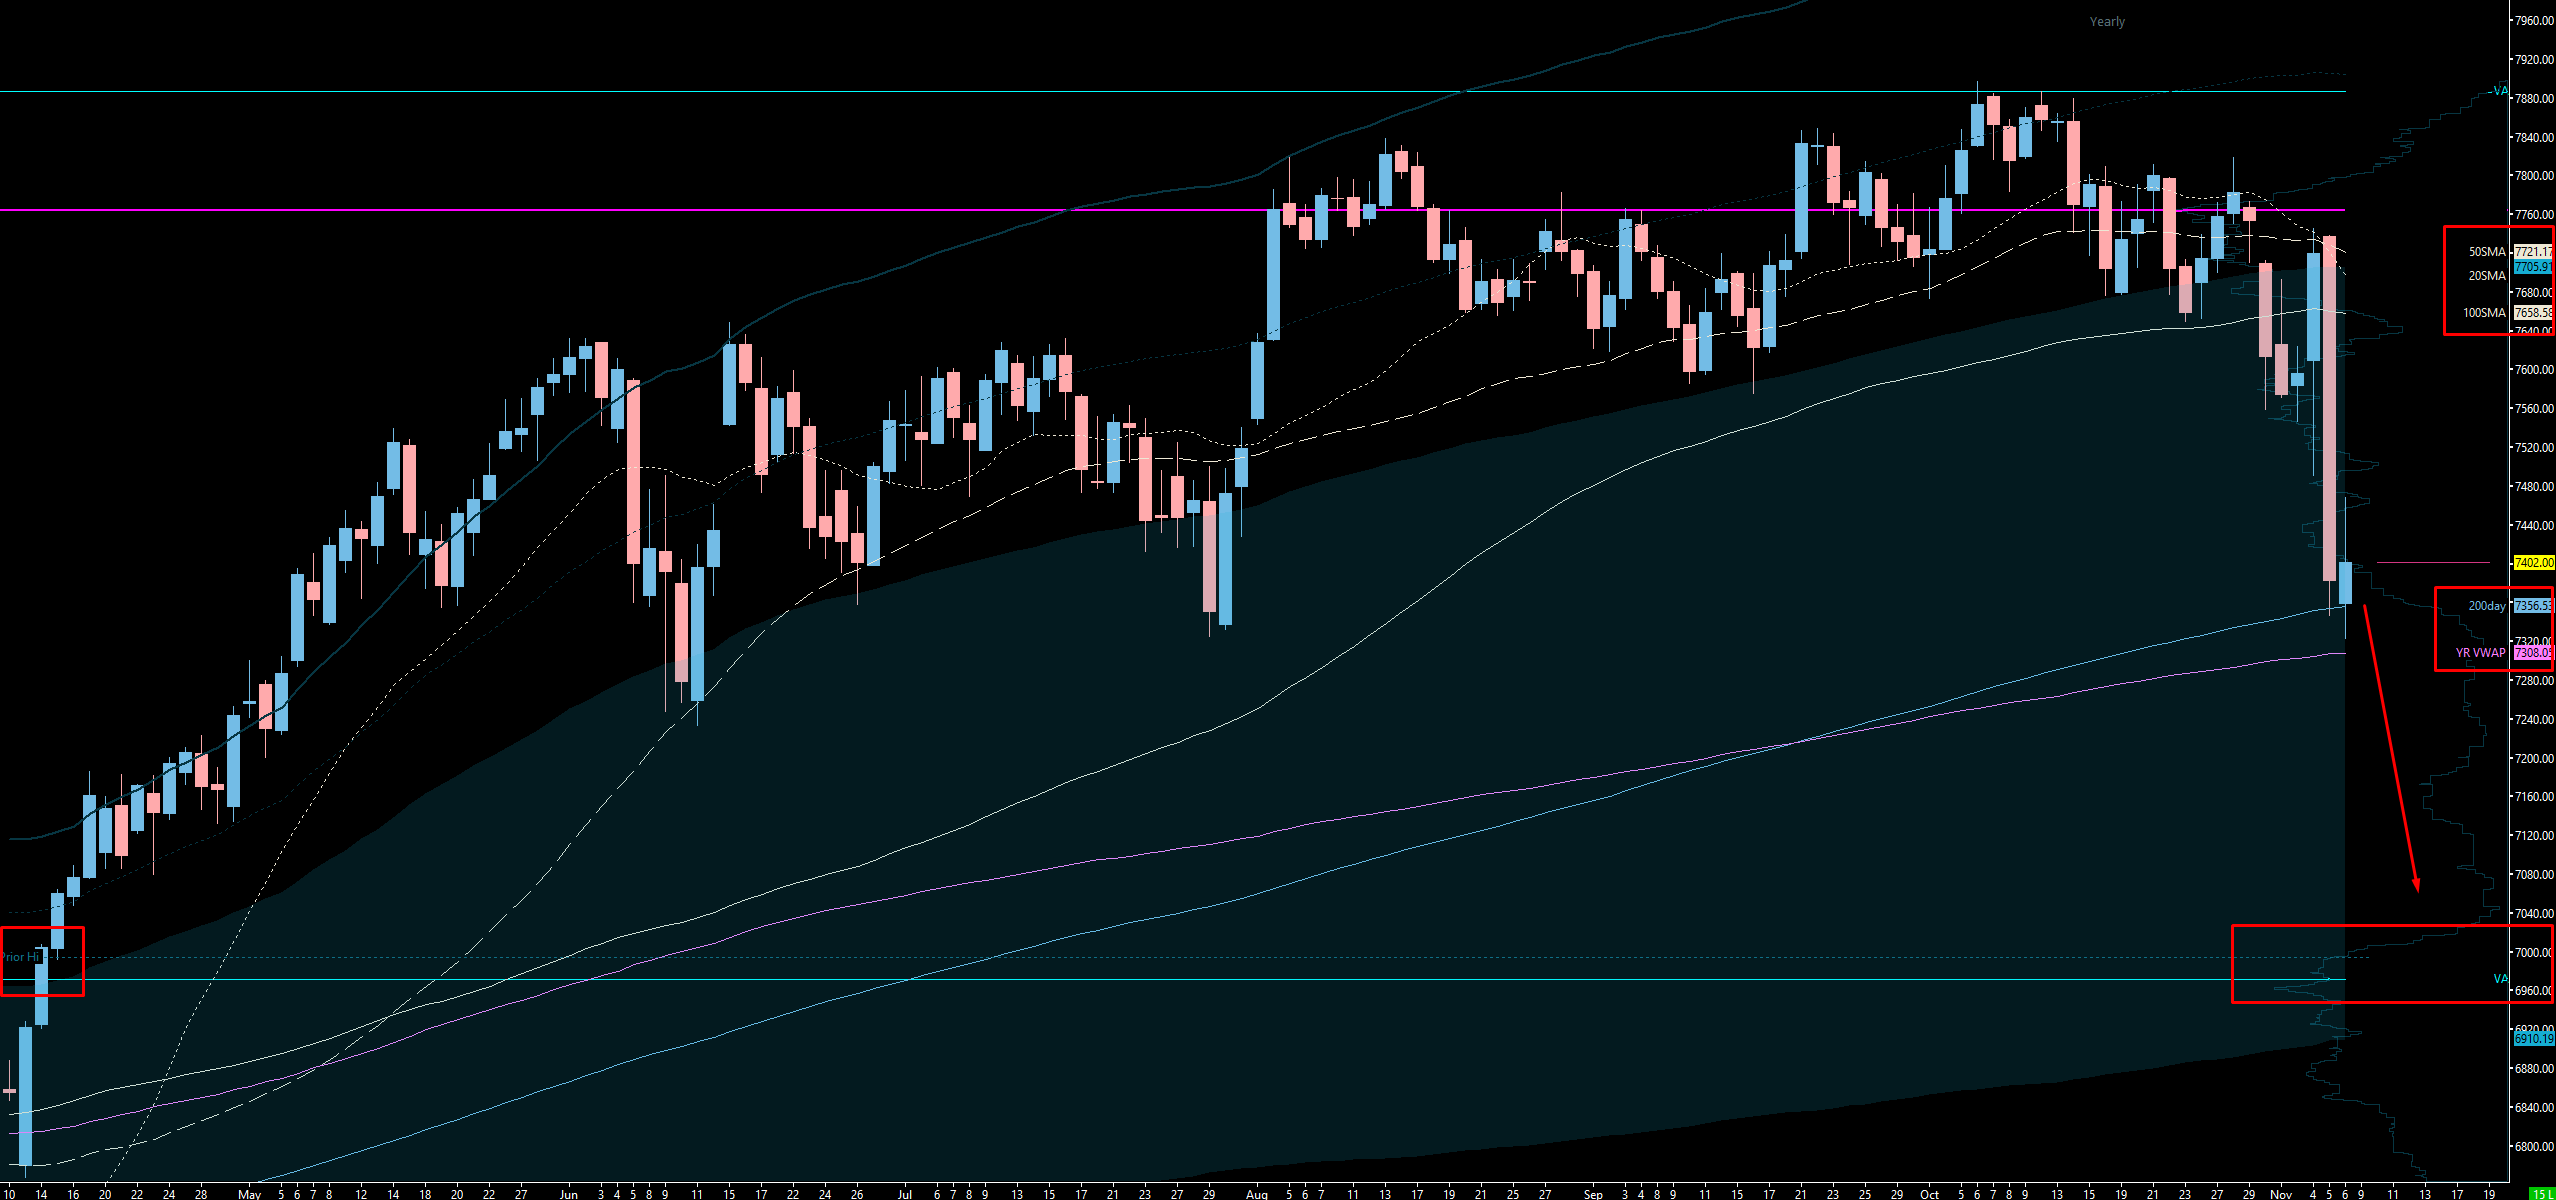
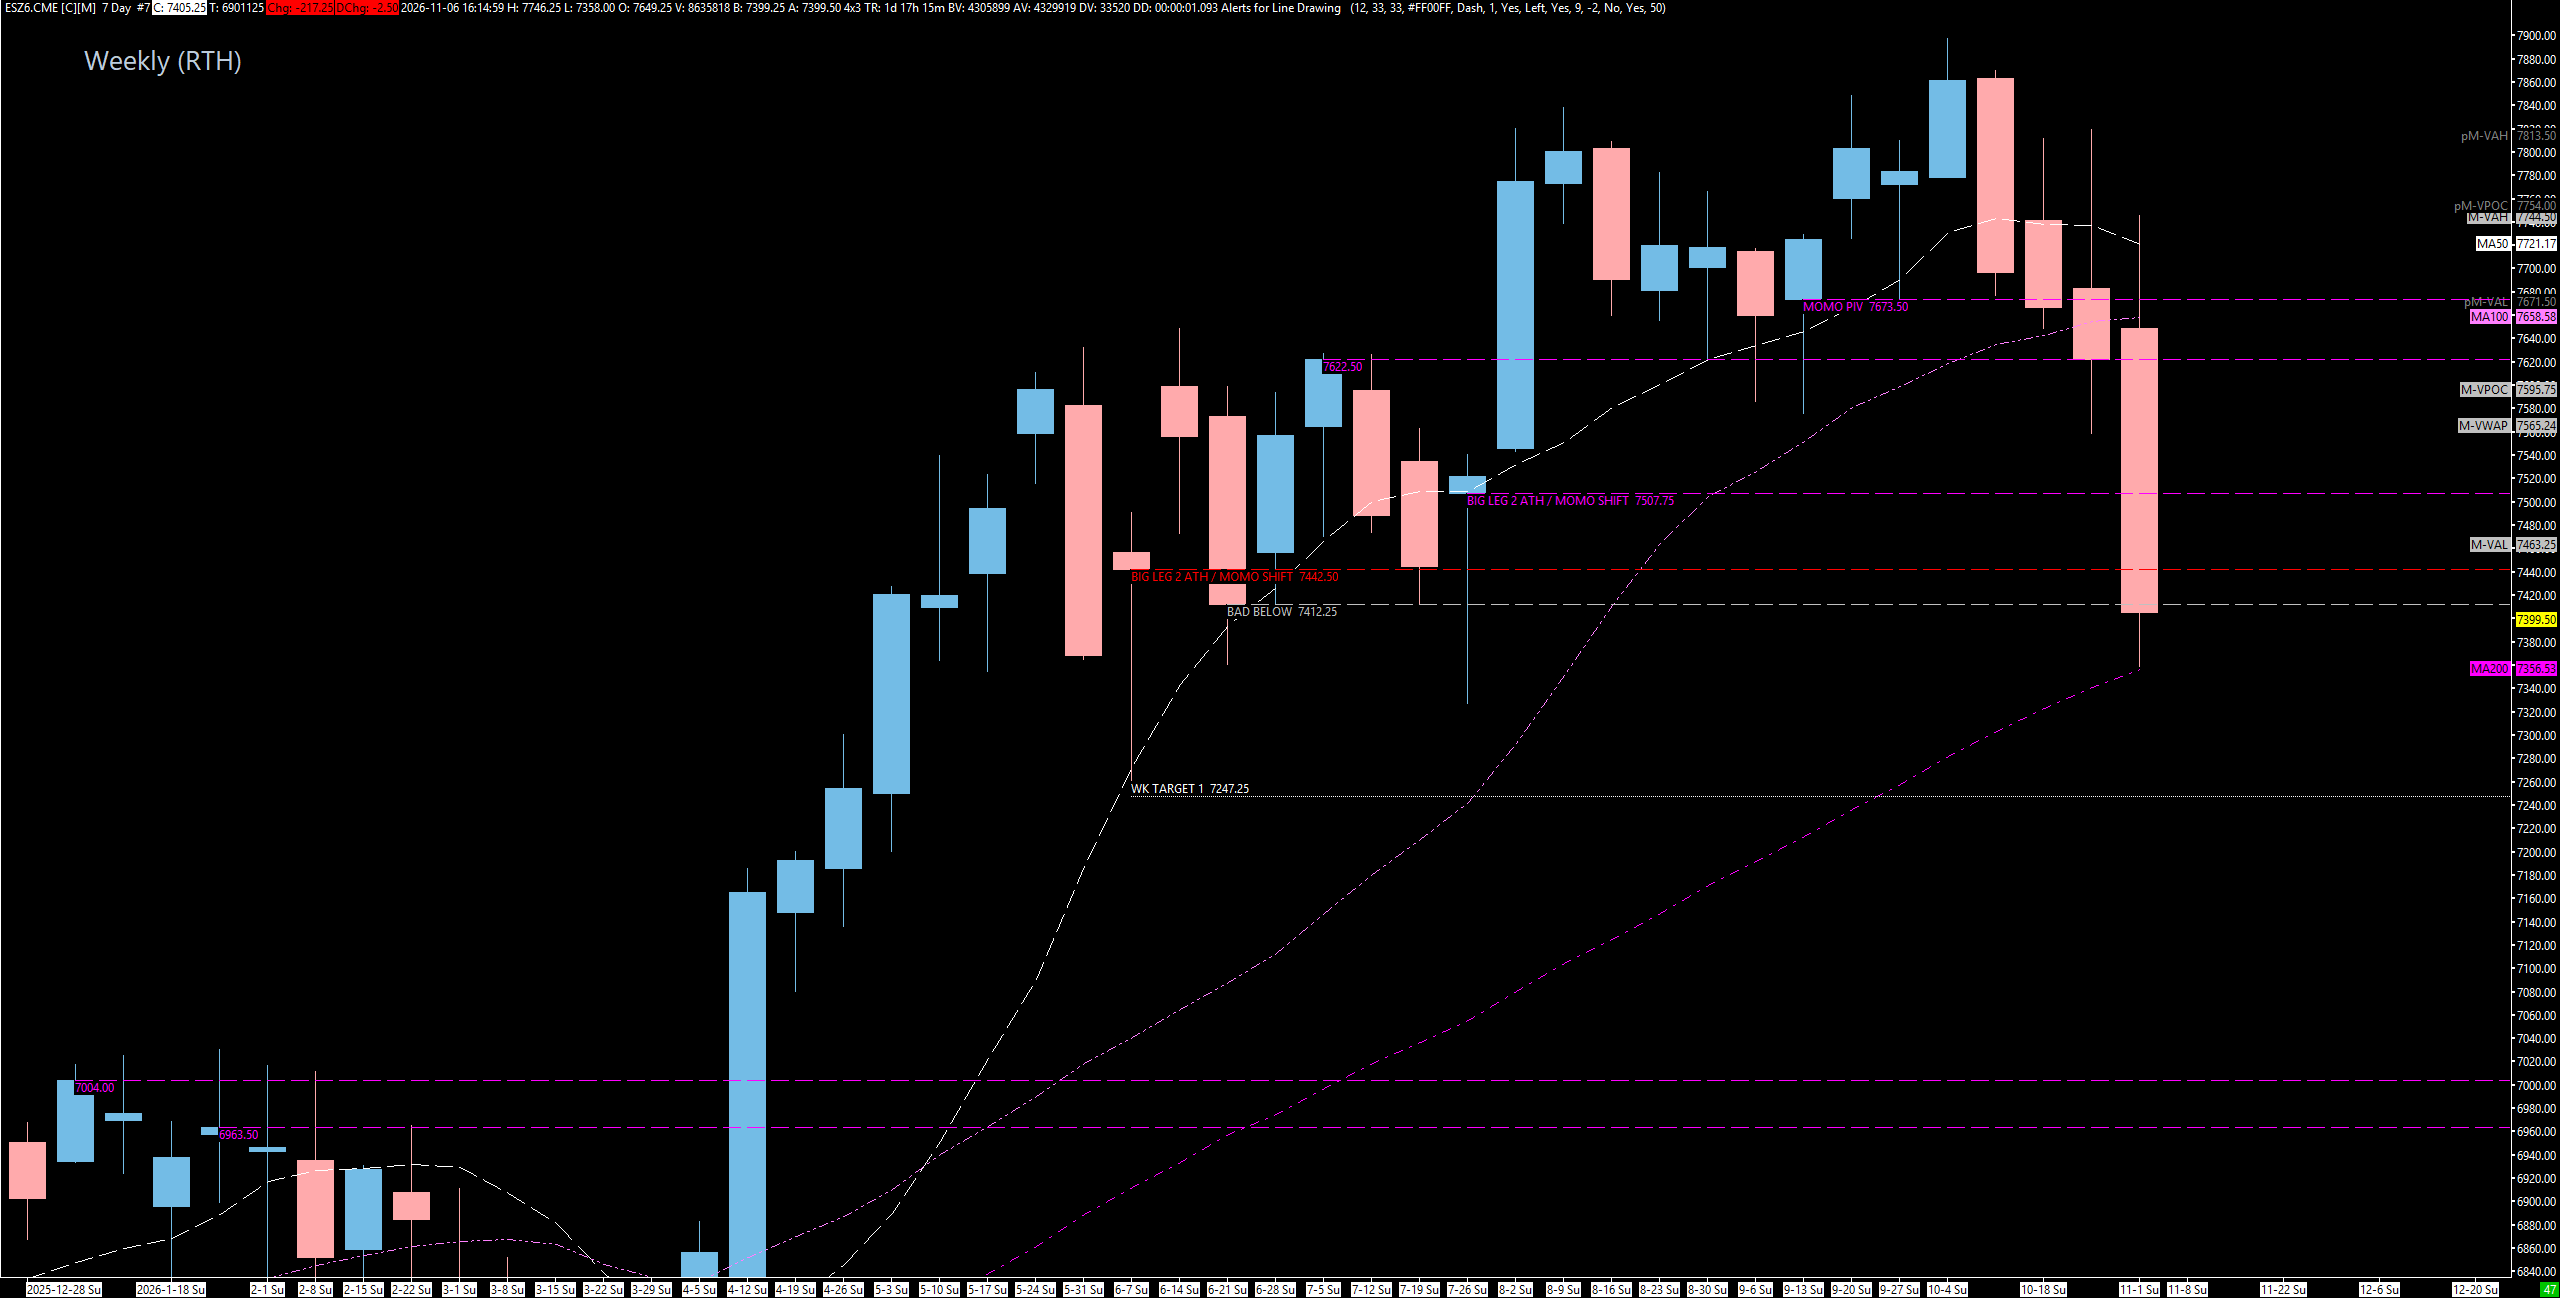
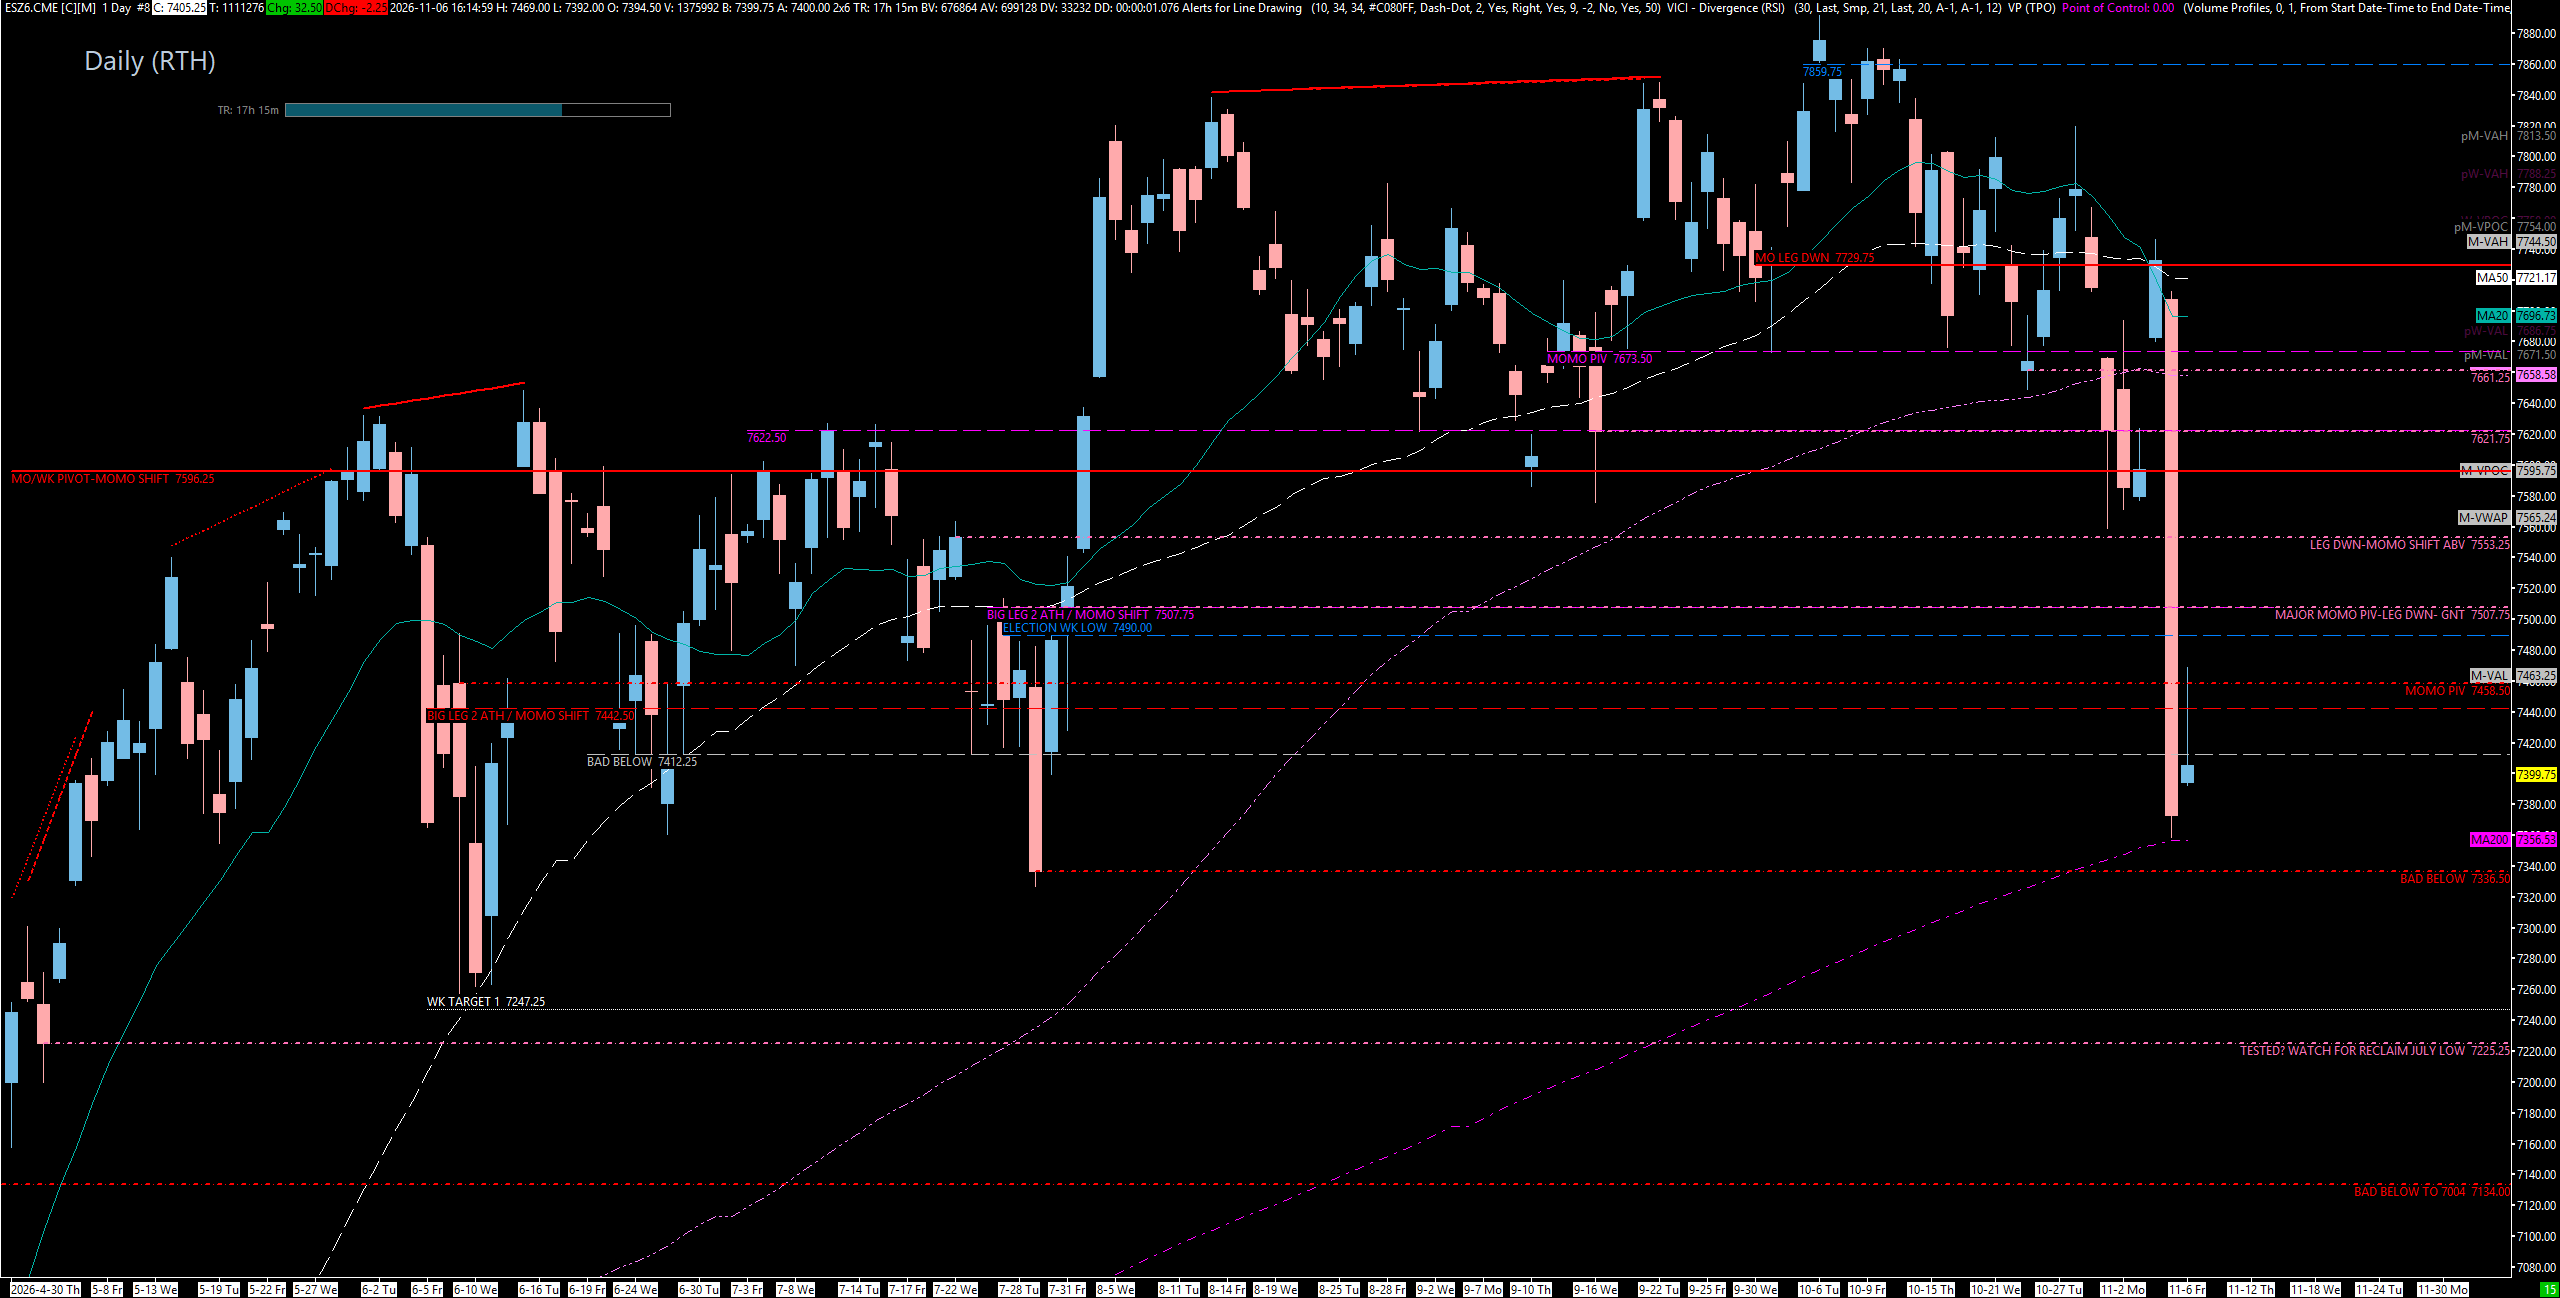
Here is something very unique on ES: we are sitting directly on the yearly VWAP — we barely ever touch it, and we have not seen it since April — and the 200-day moving average, which we are playing literally to the tick. We are building below the 20-, 50-, and 100-day moving averages, and the 50-day is about to cross over the 100-day; once that happens, it gets ugly quick. I do not trade moving averages, but other people do, so why can’t we pop a point and a half off this spot? I truly believe we can. Now look at the volume profile: there is a massive inefficiency from the move down that all needs to get filled in, and it leads to the prior yearly high at about 6980 — right around 7000 — alongside a value area low. That is how I am building this target.
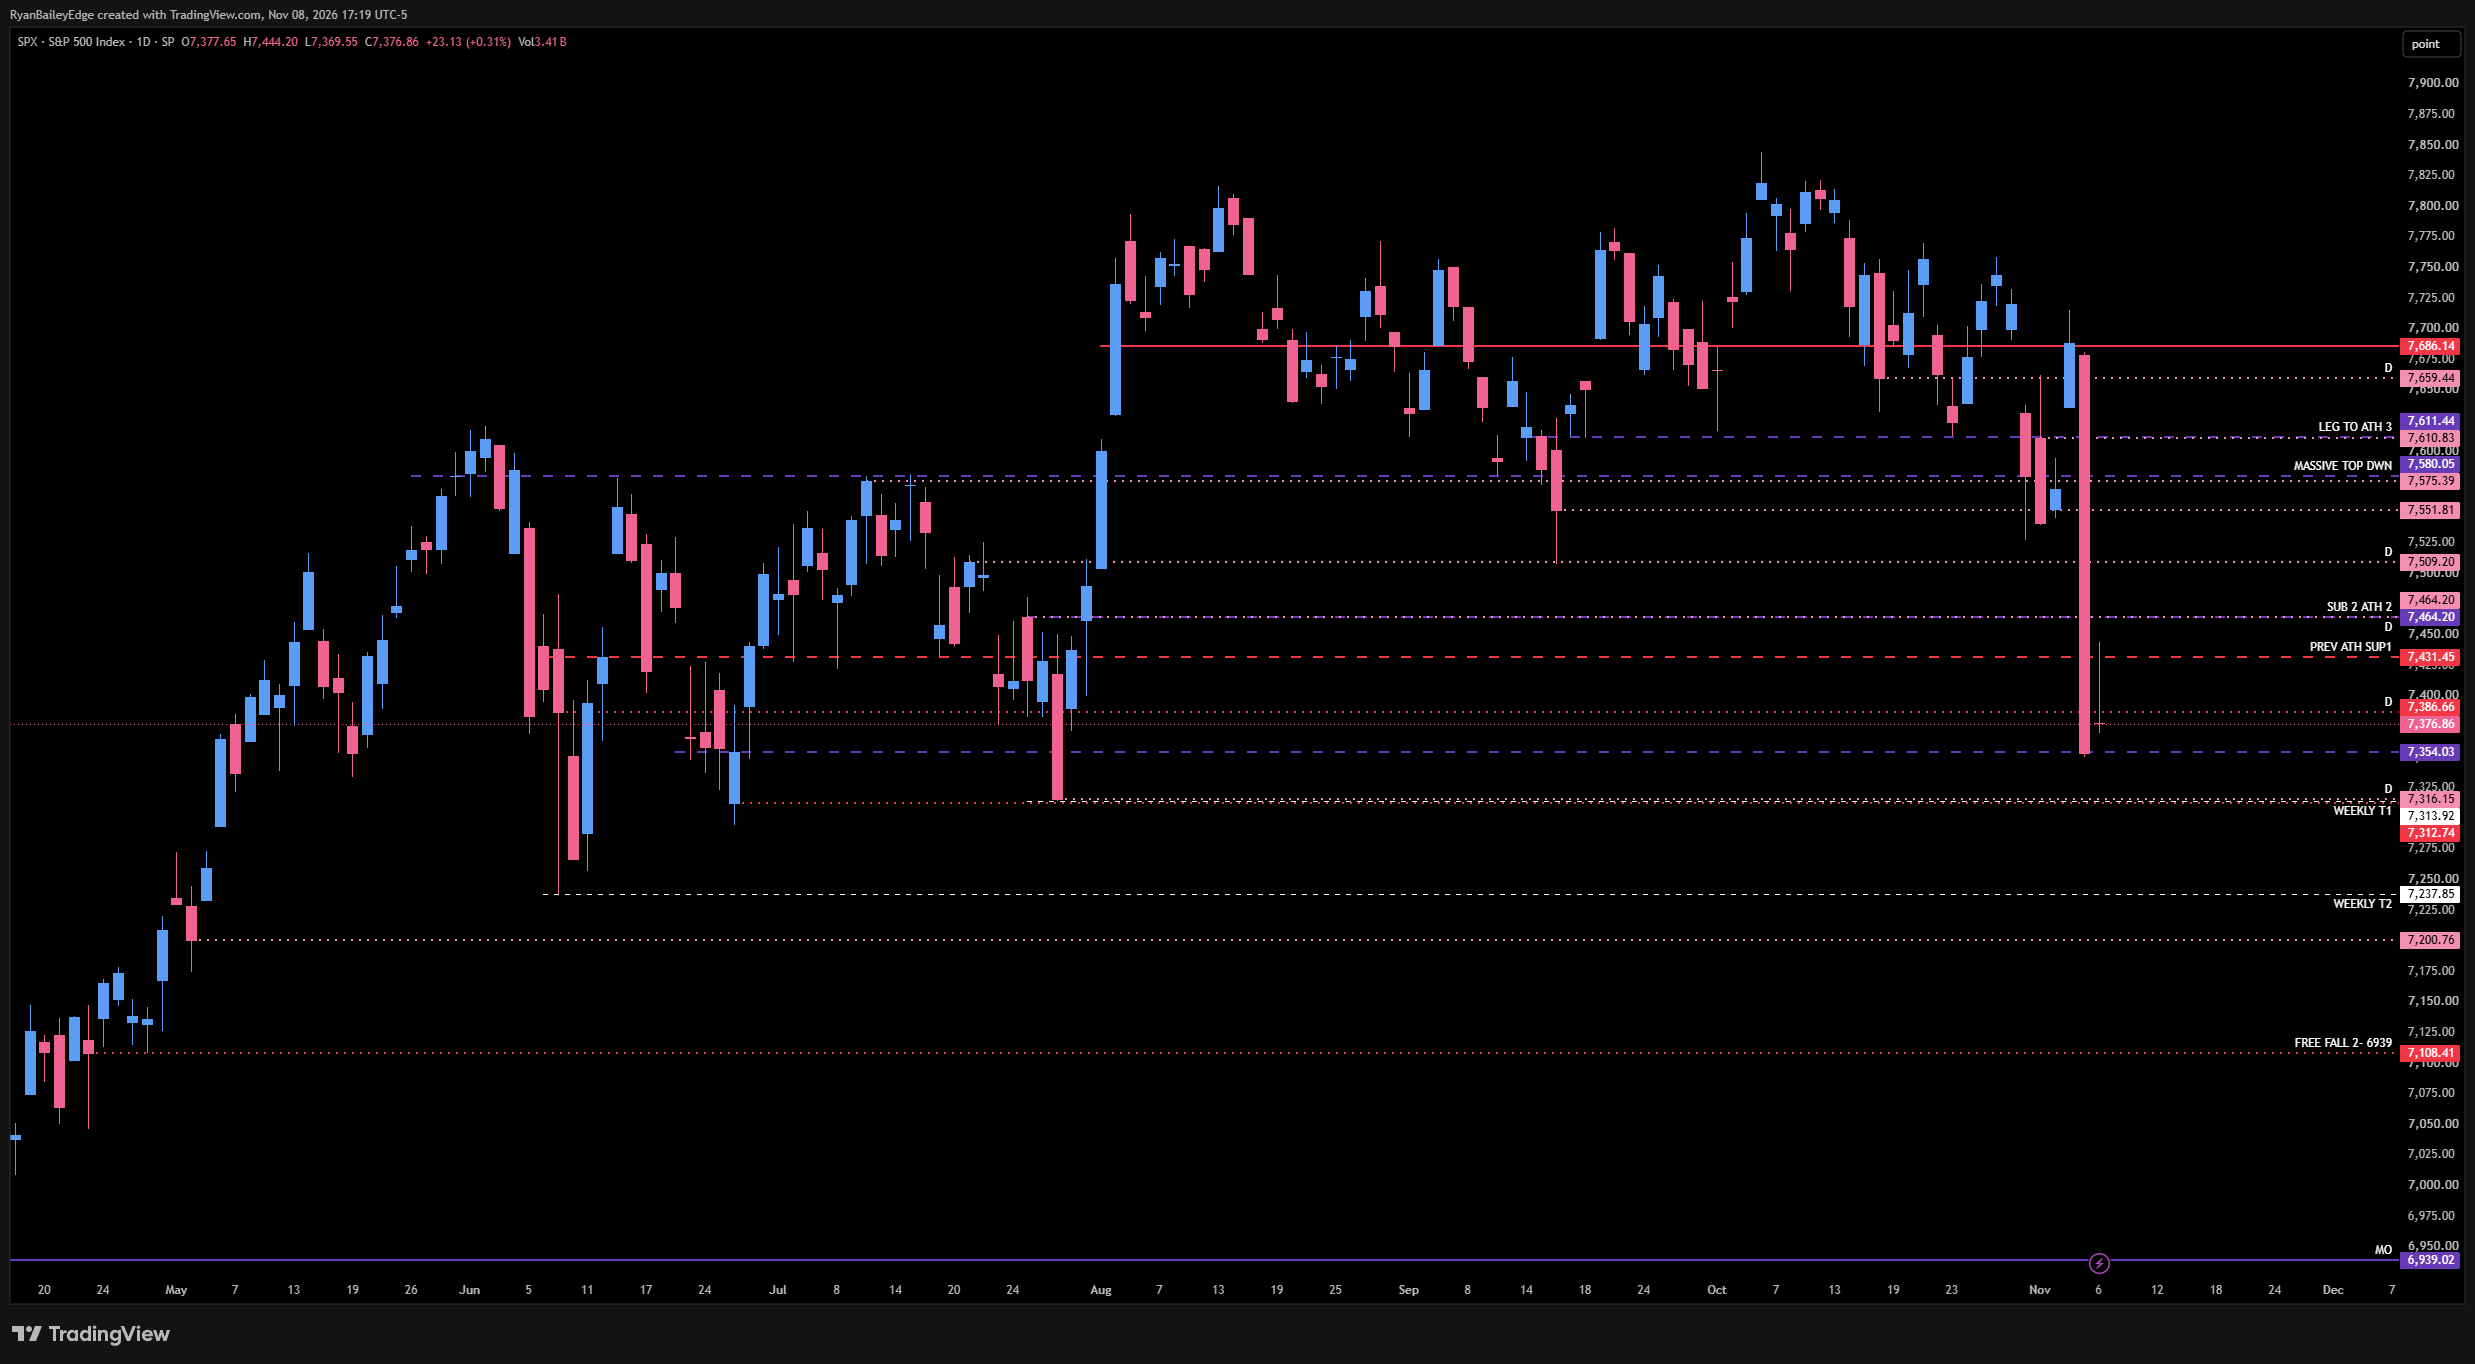
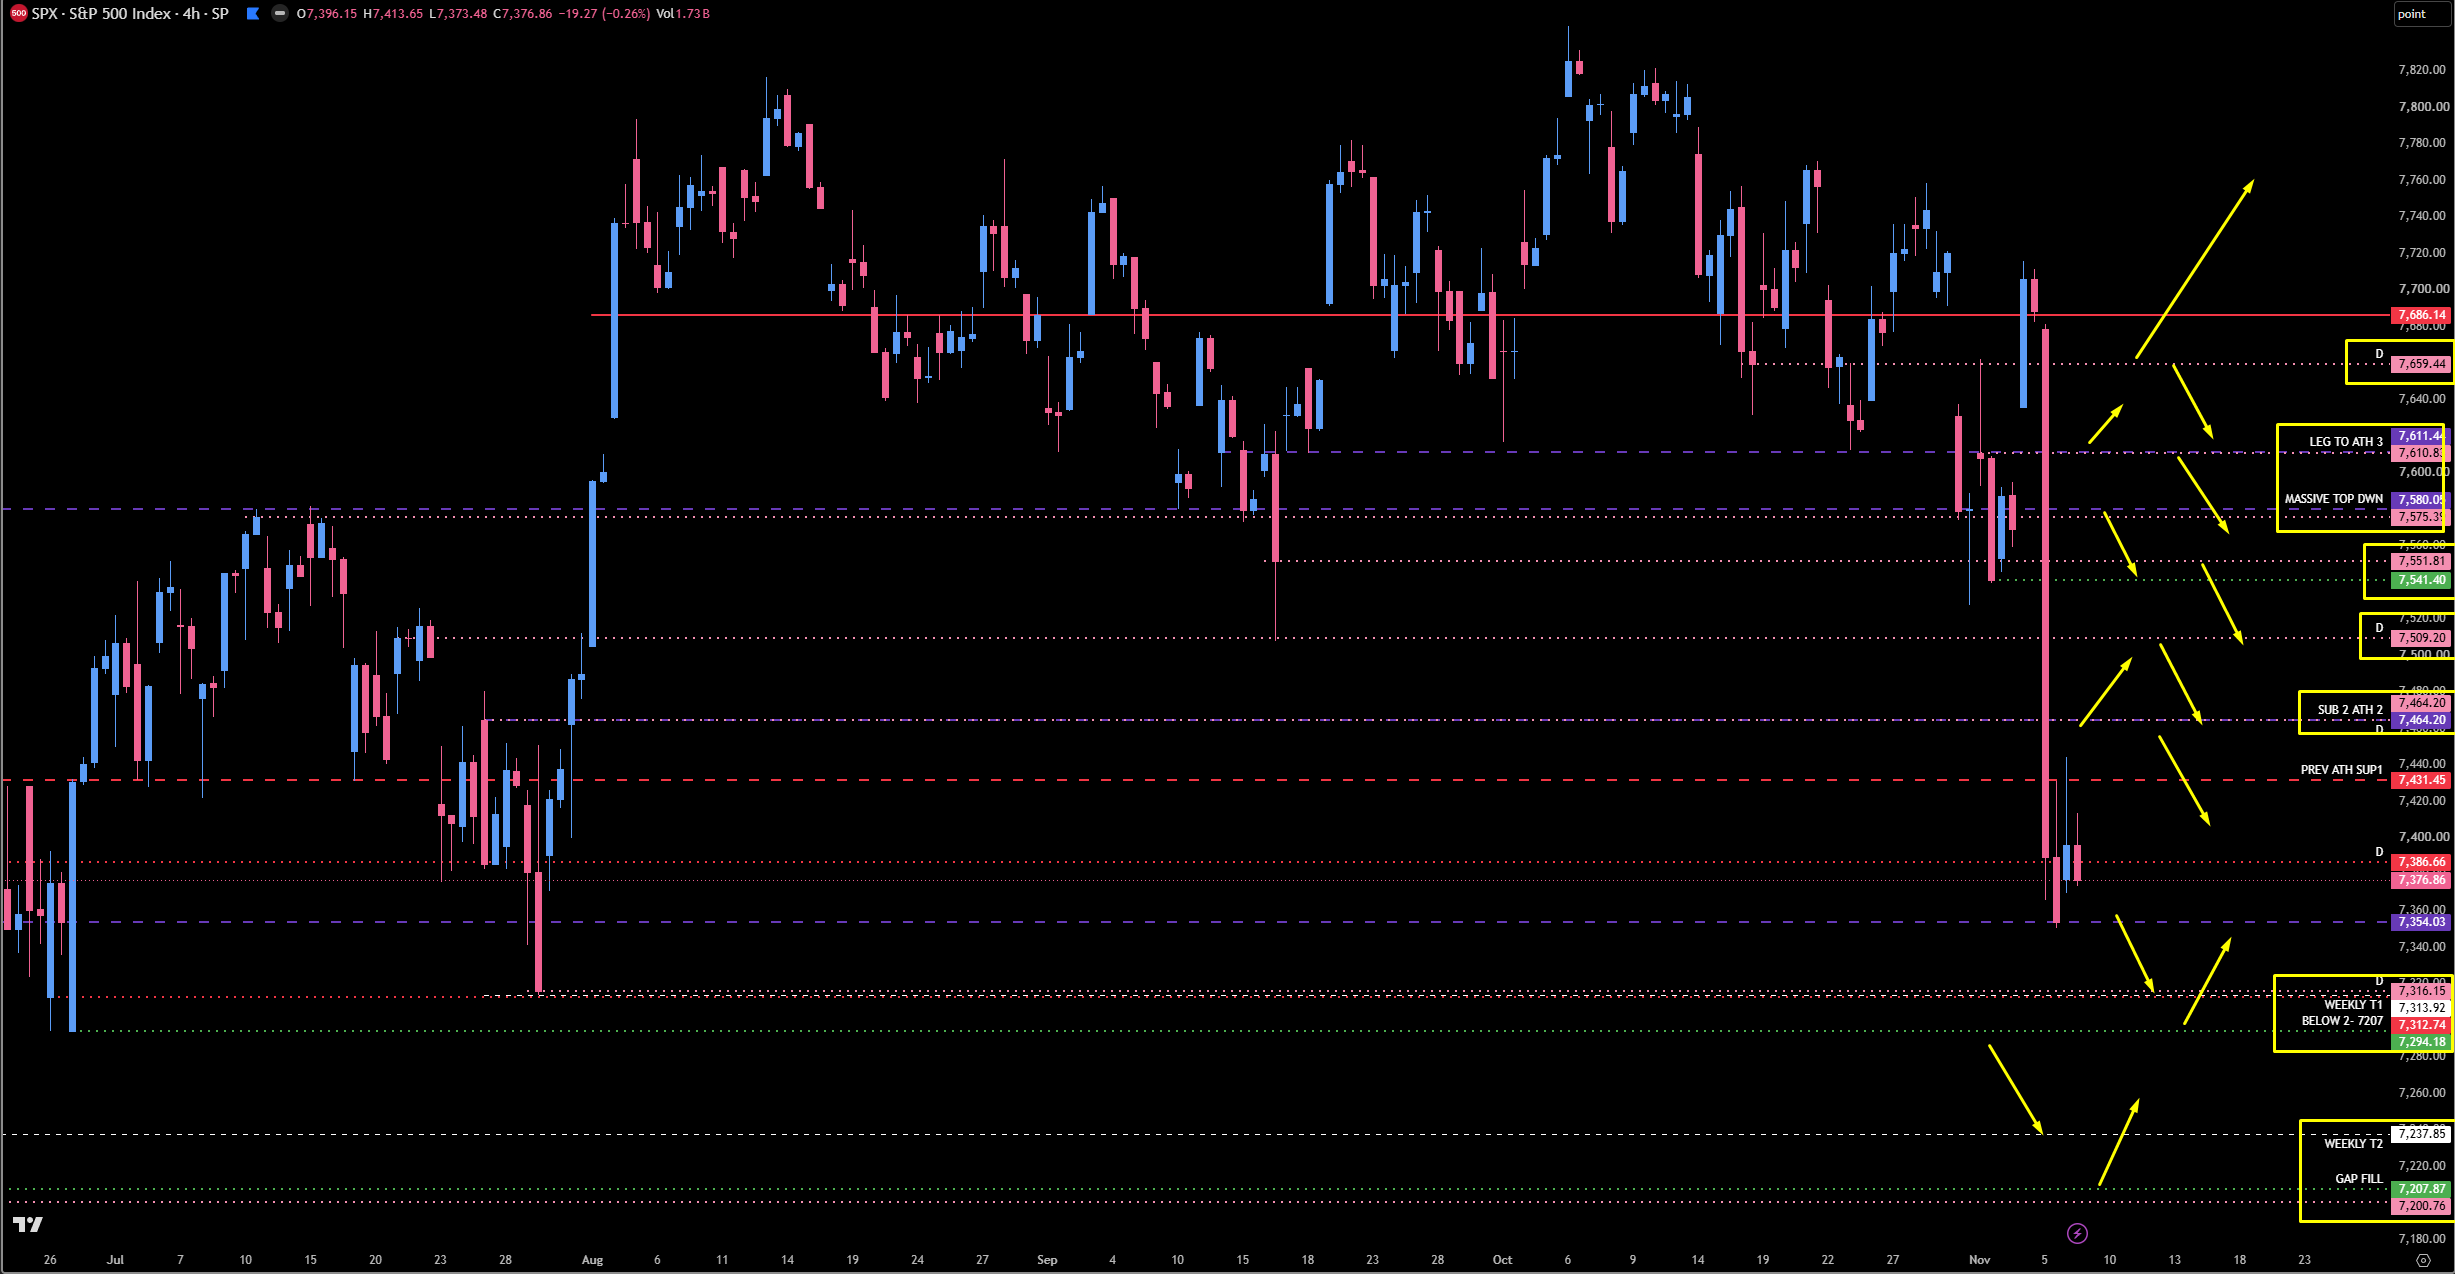
On SPX, here are my outrageous calls. My first downside weekly target is 7313.92 — target numero uno — and I think we hit it sooner rather than later. My big weekly target is 7237, and I truly believe we could get there potentially this week. We have lost the support to this high, and I do not make the rules. On the daily, we nailed this monster short — a hell of a candle — and landed right on our 7354 weekly, which is also the 200-day moving average and kept us propped up. We popped and hit the 7431 weekly, a previous leg to an all-time high that kept us contained with a little bleed through. The spot I really want to short is 7464.20 — a daily and a weekly, my leg down. I believe it can give us the reaction to get back below 7431 and dump us into our T1 at 7313.92. That target is technically untested; I am not buying it, but I will take profits on my shorts there. Then comes T2 at 7237. My first area to look for a buy is 7200 — play 7200, reclaim the 7237 low, and we likely squeeze back into the 7337 area. Overhead, there is a 7509 daily that played beautifully at the lows in September and took us to all-time highs — still a high-quality short — but 7464.20 has the weekly and the daily, so it is the bigger, badder level. Once we get back above 7464.20, momentum shifts slightly — not bullish, but shifted. Above that are big blocks at 7551, 7575 / 7580, and 7610. Above 7580 I get very concerned, above 7641 we could start to squeeze, and 7659 is our last untested daily. Do not short all of them on the way up — size appropriately and let the trade show itself before you jump in with a resting sell. And if we pop above and then get back below 7431 — below the level that kept us contained all day Friday — it’s curtains. Ultimately, I think we come down to our first initial big spot in the 6849 - 6939 area and simmer there before the next call.
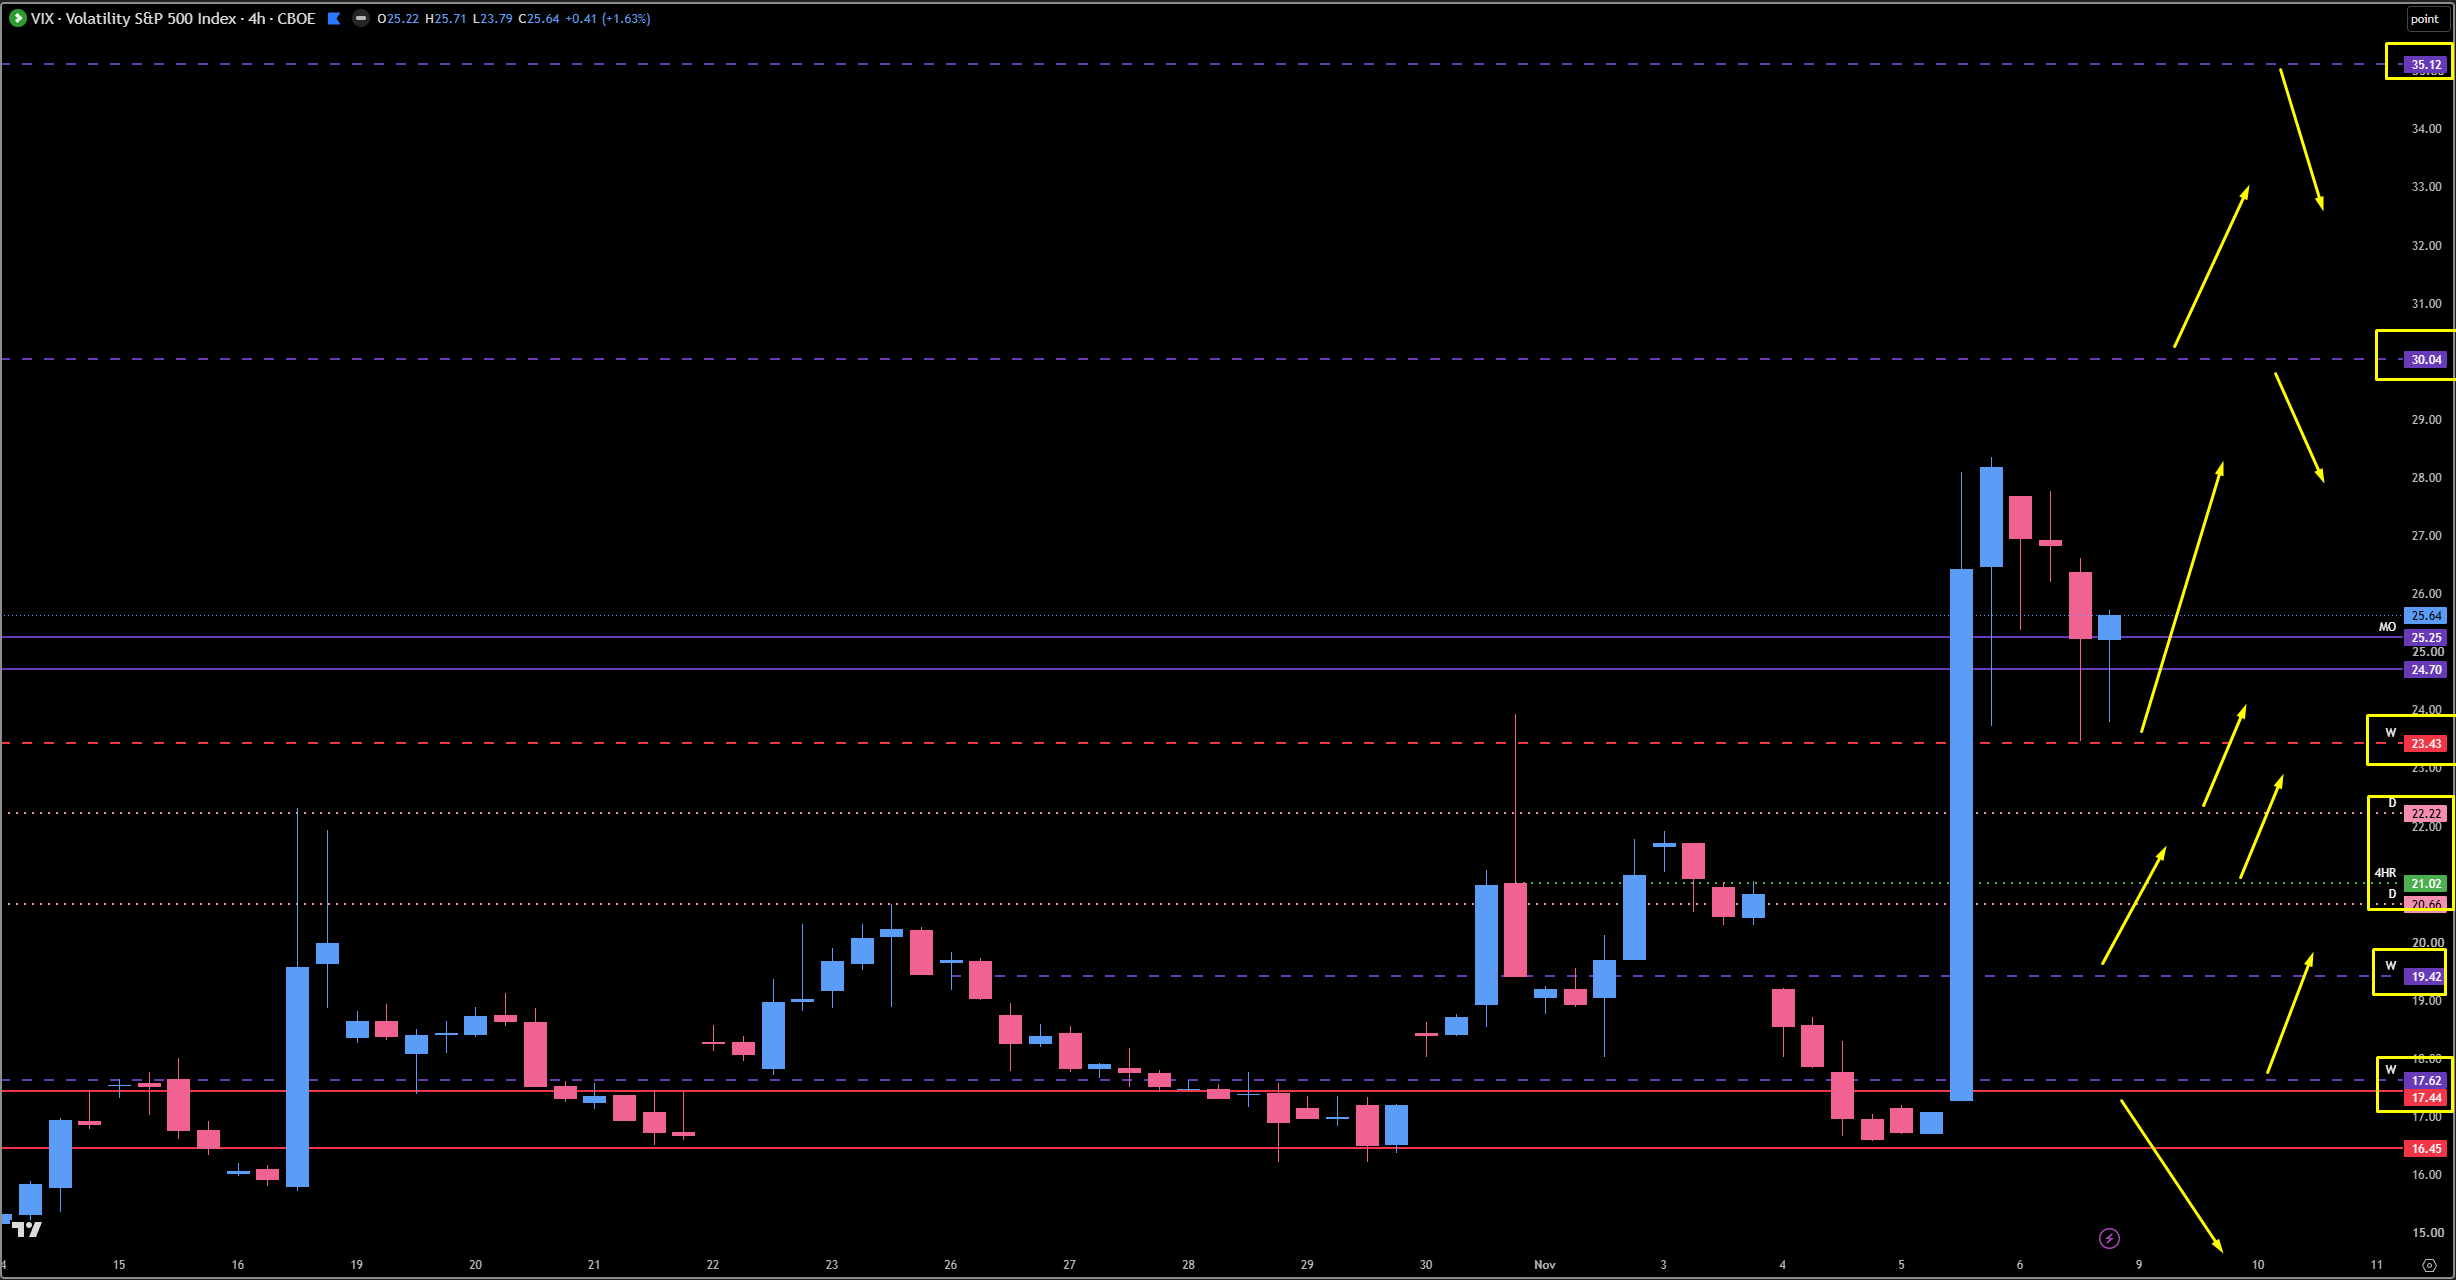
🚨 VIX Analysis: The 23.43 Pivot
As always, we start with VIX — the tiebreaker. We nailed the 16.45 spot and the 17.44 monthly we have focused on so many times. We came down, held this leg, and it was literally in Thursday’s plan: if this holds and launches above 17.44, hold on to your hat — VIX squeezes and the indices dump. That is exactly what happened.
The Blowthrough: VIX propelled straight through the $25 handle monthlies, which I did not expect — I thought we would get a solid reaction there. Negative. This market was on one, selling off like we have not seen in years.
The Pivot: 23.43 (Tested Weekly). In Friday’s plan, I said our first level of support was the 23.43 weekly — watch for it to sweep the wick and hold. It swept the low just as stated and held, and it is starting to look like a W to me. This weekly played true on Friday and is now tested — it is our big pivot for now. To keep bearish momentum on the indices, we want VIX above 23.43.
The Lower Supports: 22.22 (Daily) — if 23.43 fails, VIX could sweep into 22.22 to reclaim, and at the very lowest I want to see it stay above 22.22. Below that, the 20.66 / 21.02 four-hour and daily — 20.66 is my last stand. Even lower are two weeklies at 19.42 and 17.62.
The $25 Handle Monthlies: This is a massive congestion area — the former support that was lost on the way down — and now VIX is sitting above it, which is truly bullish for VIX. Looking left, this zone has played phenomenally for resistance and support on both sides. If VIX pushes higher from 23.43, we stay above these monthlies.
The Upside: If VIX stays above the monthlies, it pushes into 30.04 (Untested Weekly) — watch for a reaction. Past 30.04, there is another untested weekly at 35.12. Reactions at either could give the indices a little relief pop.
Bottom Line: We are all things bearish in the S&P 500. Don’t get it twisted.
🎯 Detailed Actionable Trade Plan (ES Futures)
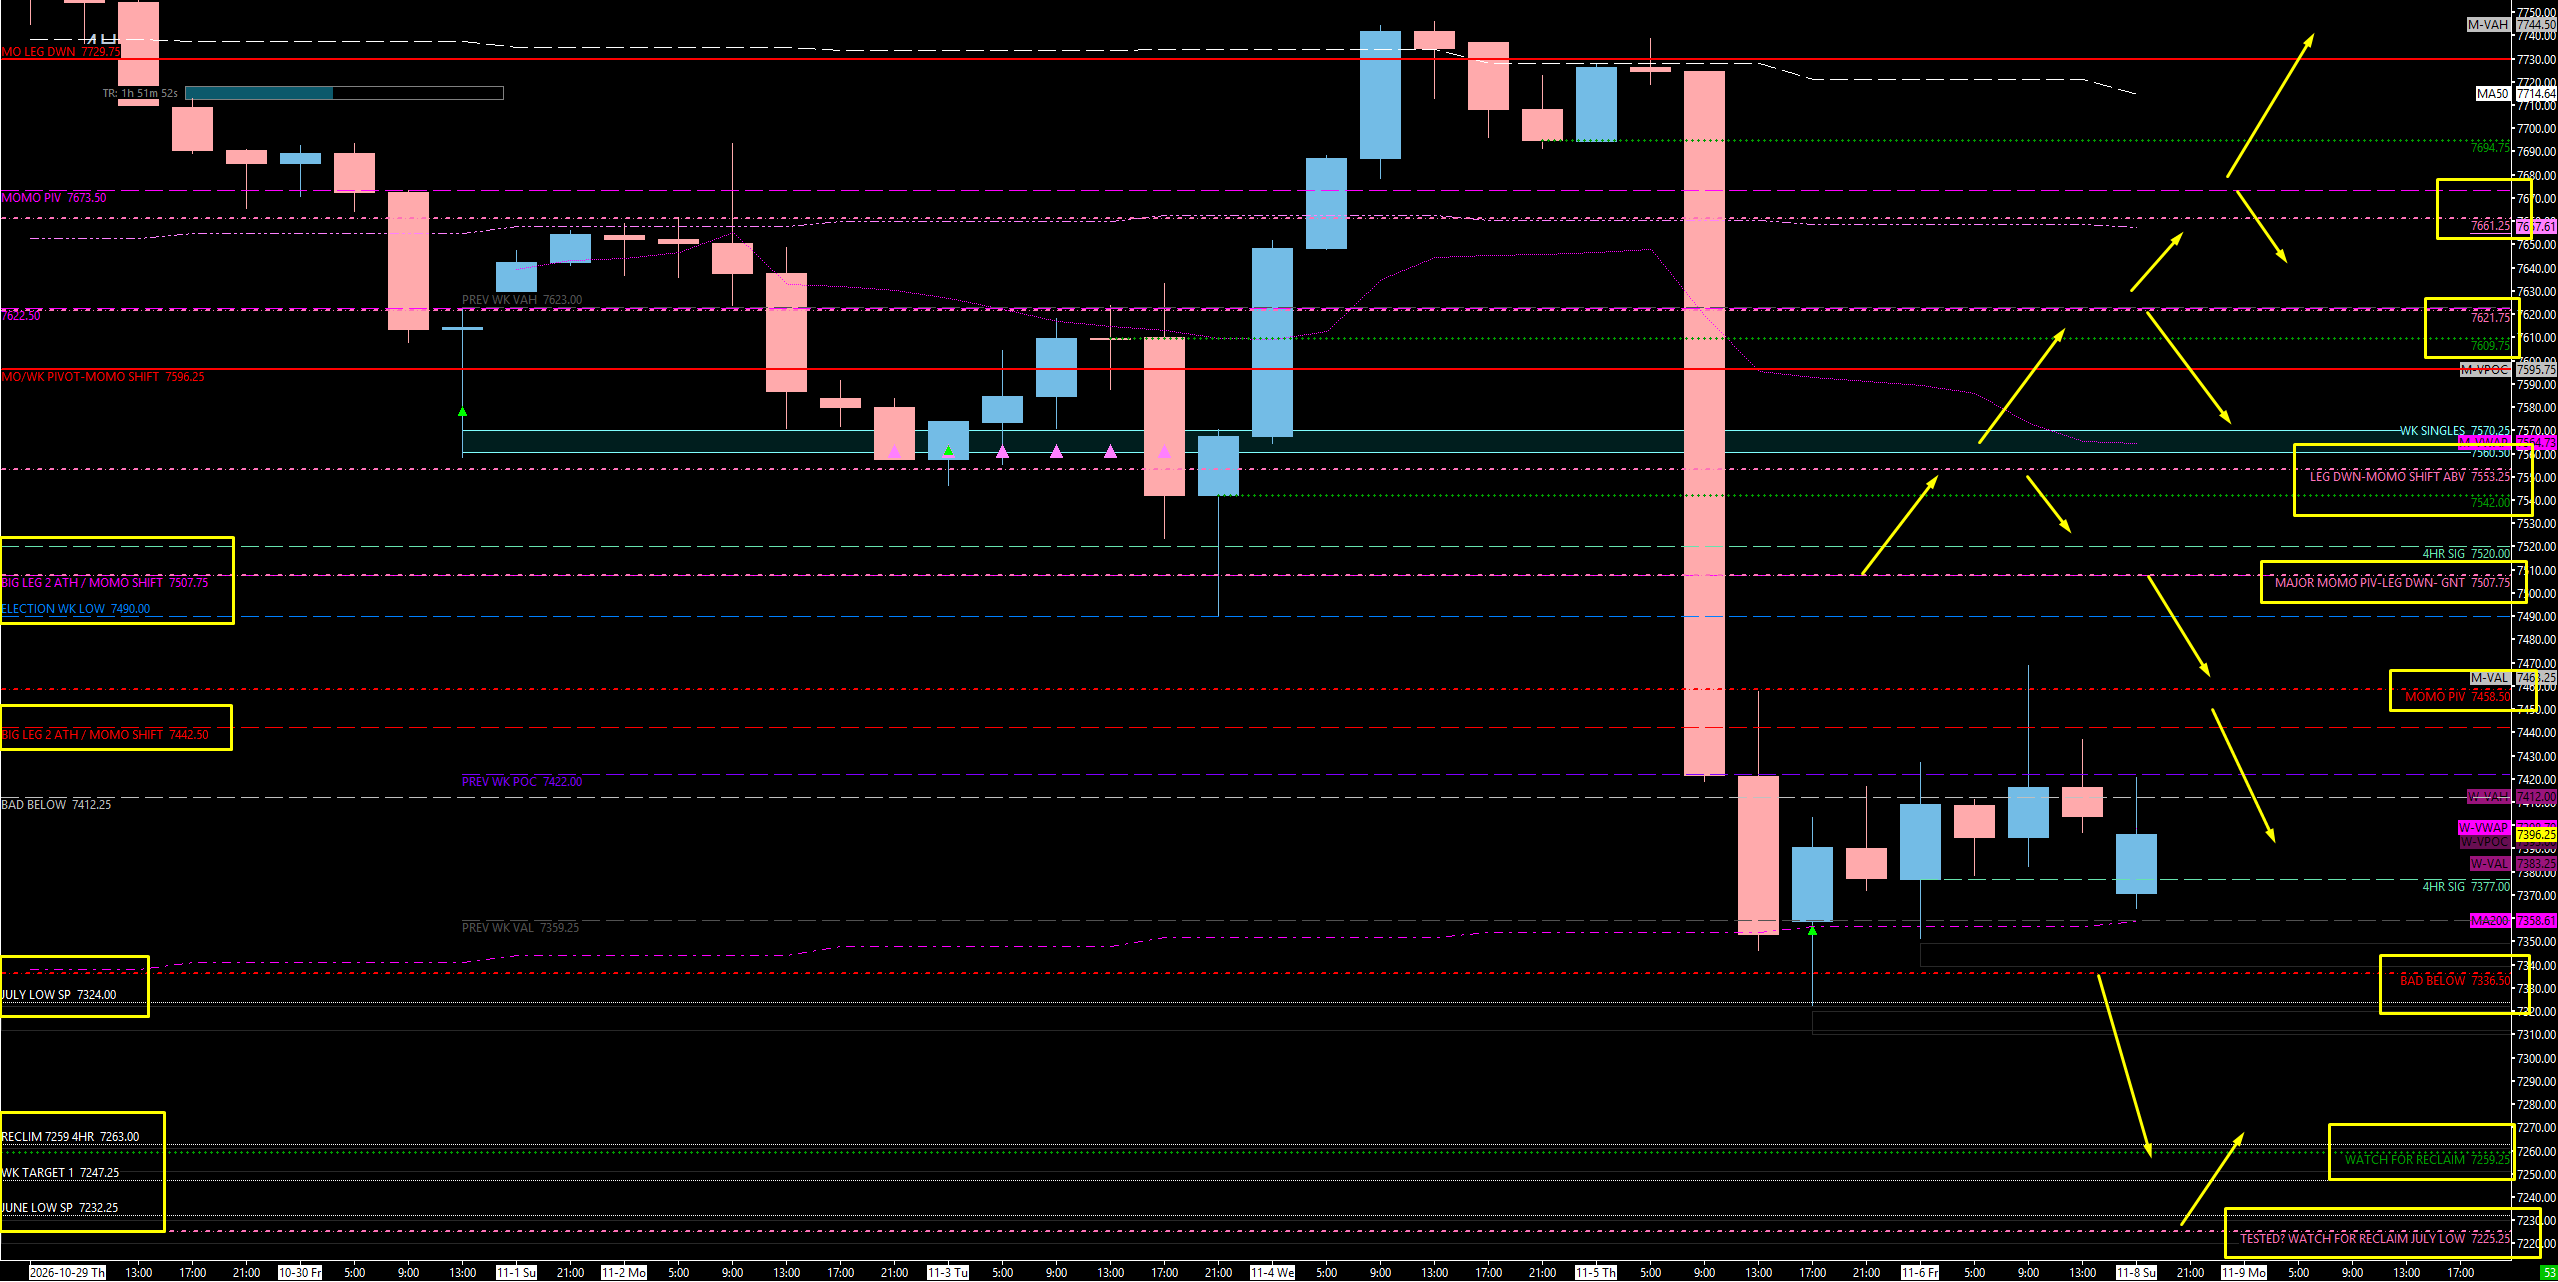
We are pointed down, so per the process we are looking for shorts. But when I saw us hold the lows all Friday, I came into the weekend saying we are probably going to pop — History Says is flashing 80%, and we already ripped 50 points in the overnight. If we pop, the first spot I am looking for is 7507.50. Let it play, get back below the 7490 weekly — the midterm election low — then under 7458.50 and under the 7442.50 weekly, and it’s over. Period. To be honest, we may not even get over 7458.50 — it is very possible we stay between that and the weekly and keep moving down. Below 7412, we have even more continuation. On the way down: the 7336.50 daily that propped us up, a sweep of the 7324 July lows, the 7259 four-hour, and the weekly target at 7247.25. Write it down. Tell your friends. Tell your mom. I will continue to short this market until we see it. It looks like a long way, but it is only about 150 points — and we just did 150 on Friday. My first real buy is 7225, and below that it is 7134 and the 7000 handle.
🔴 Key Resistance Zones & Setups
The Overnight Weekly: 7412.00
7412.00 (Tested Weekly — Played In The Overnight Session).
Context: We have another weekly at 7412. I did not make it red, because in my opinion the higher ones are more important, but we played it in the overnight session and we are getting some love off it right now.
Actionable Setup: Short Setup (Hold / Add): As long as we are below 7412, we have even more continuation and momentum to the downside. Use these levels to walk price down. The point of high-timeframe trades is not 10 points — it is 50 or 100. Below significant weeklies and dailies is where you add to the trade or hold for a deeper target, knowing that getting back above them is highly improbable.
THE MOMENTUM PIVOT — Weekly & Friday’s Above/Below: 7442.50 - 7460.00
7460.00 (Weekly TPO Momentum Shift), 7458.50 (Friday’s Big Above/Below Momentum Pivot), 7442.50 (Untested Weekly — Friday’s Ideal Short).
Context: 7458.50 was the big momentum pivot in Friday’s plan, with the 7442.50 weekly as the ideal shot — and we continue to stay contained below both. The weekly TPO is not as crystal clear as I would like, but Thursday’s move down left a massive hole in the profile. Above the 7460 area, we start to fill that in. Underneath 7460, we have a deep momentum shift, based on the curvature of the profile and where the inefficiencies sit.
Actionable Setup: Short Setup: We may not even get over 7458.50. It is very possible we stay between it and the 7442.50 weekly and continue to move down. As long as we are below both, we have lots of momentum to the downside.
Warning: Above 7460, we start to fill in the profile hole — and that opens the door to the primary short above.
THE PRIMARY SHORT — Daily/Weekly & The Election Low: 7490.00 - 7510.00
7510.00 (Weekly TPO Shift), 7507.50 (Daily / Weekly — The Primary Short), 7490.00 (Weekly — The Midterm Election Low).
Context: This is the spot I am really anxious and looking forward to shorting — the same structure as the 7464.20 spot on SPX, but on ES. It is the inception of the four-hour leg up. On the profile, above the big buying area is where we start to shift, right around 7510, so the profile read lines up perfectly with the blocks. Below 7510, we start to go down. And just below it sits 7490 — the midterm lows, which is actually a weekly level. I really think we will have a hard time getting back above 7507.50.
Actionable Setup: Short Setup: There is no reason to jump into this without it proving itself. Let it play 7507.50 and get back below 7490 — that gives us the continuation to ride this all the way down. Underneath 7458.50, then under 7442.50 — it’s over. If this thing starts to come down, it is going to come down for a long time.
Warning: Above 7510, the profile shifts and the upper range comes into play.
The Upper Range — 4-Hours, 7553 & The Weekly Singles: 7520.00 - 7570.00
7570.00 (Weekly Singles), 7553.00 (Played From The Top Down More Than Once), 7542.00 (Untested Four-Hour), 7520.00 (Tested Four-Hour).
Context: We still have four-hour overhead resistance — some of it tested at 7520, some of it not at 7542. Above that, 7553 played beautifully from the top down, more than once. This is a massive spot — big as hell. We also have weekly singles all the way up to 7570 that need to get filled if they want to get extremely aggressive. I just do not see that happening right now.
Actionable Setup: Short Setup: Another big spot to short. Size appropriately and let the trade show itself first.
The Doozy — Daily/Weekly, 4-Hour & TPO: 7609.00 - 7623.00
7623.00 (Weekly TPO), 7621.00 (Tested Daily / Weekly — Played Multiple Times), 7609.00 (Four-Hour).
Context: 7621 is a daily that is also a weekly, and it played phenomenally multiple times. It is a doozy. The 7609 four-hour sits right under it.
Actionable Setup: Short Setup: If they squeeze this high, watch for the reaction.
Warning: On the weekly TPO, if we get back above 7623, the bulls might have some gas — even with untested levels slightly higher.
The Top Of The Move Down: 7661.00 - 7694.00
7694.00 (Four-Hour), 7661.00 / 7673.00 (Top Of The Move Down).
Context: My last spot is 7661 / 7673 — this is our big move down, and its top is up around 7661. It would take a lot to get up there, and I am not sure it is possible. The overhead four-hours at 7542, 7609, and 7694 are, I truly believe, irrelevant right about now.
Warning: Once we are back above this spot, we are going all the way back up.
🔵 Key Support Zones & Setups
The Daily That Propped Us Up — 7324.00 - 7336.50
7336.50 (Daily — Held The Lows Friday Night), 7324.00 (July Low), plus the 200-Day Moving Average.
Context: Our first spot was the July low at 7324. We wicked it on Friday in Globex at the lows, which gave us a nice little liquidity grab as it held our big daily at 7336.50. The cash session shows us holding the 200-day moving average — the staple indicator that everybody knows about — so it is no surprise it got a little love. But with Friday’s terrible close, I still think we are coming down.
Actionable Setup: Take Profits: As long as we stay below the momentum pivot, we come below the big daily that kept us propped up and sweep the July lows. Take profits here. This is also the major profit-taking target for the long from 7225.
THE WEEKLY TARGET — 7247.25 - 7259.00
7259.00 (Untested Four-Hour), 7247.25 (The Weekly Target).
Context: With Friday’s terrible close, we lost my leg to the all-time high, and that tells me we are coming down to 7247.25. Write it down. Tell your friends. Tell your mom. I am putting my stamp of approval on this — I will continue to short this market until we see 7247. Will I get squeezed? It is possible. But the process rules. Right above it is the 7259 four-hour, our next area of support, which actually looks like a pretty decent buy.
Actionable Setup: Take Profits / Scalp Long: Take profits on shorts here. If you are desperate for a long, get long above 7263 — a nice four-point actionable setup that could give you a 10- or 20-point pop.
THE FIRST REAL BUY — First Untested Daily: 7225.00 - 7232.00
7225.00 (First Untested Daily), 7232.00 (June Low — Monthly Swing Low).
Context: This is my first really decent buy spot, and I like it quite a bit. It is my first untested daily, sitting right under the June low.
Actionable Setup: Conditional Long (Sweep & Reclaim): They need to play 7225 and get back above the June low at 7232. If they do that — seven points — I would have to take that long. We would be back above a monthly swing low, and we could squeeze back above the 7247.25 weekly target and all the way into 7336.50 for major profit-taking.
Warning: Below 7225, we have a world of trouble — nothing left untested for quite some time.
Bad Below — 7134 And The 7000 Pocket:
7134.00 (Tested Daily), 7004.00 / 6963.00 (The Big Pocket).
Context: My chart says “bad below” to 7004. Underneath 7225, we come directly to the 7134 daily, which is tested, and I do not expect it to get much of a reaction. Underneath that, it takes us right down to the 7000 handle. 7004 and 6963 is my big spot — my true support, my big pocket — and I think we spend some time down there once we get there.
Actionable Setup: These are high-timeframe targets for the short, not places to get long. Let the process tell us when it is time.
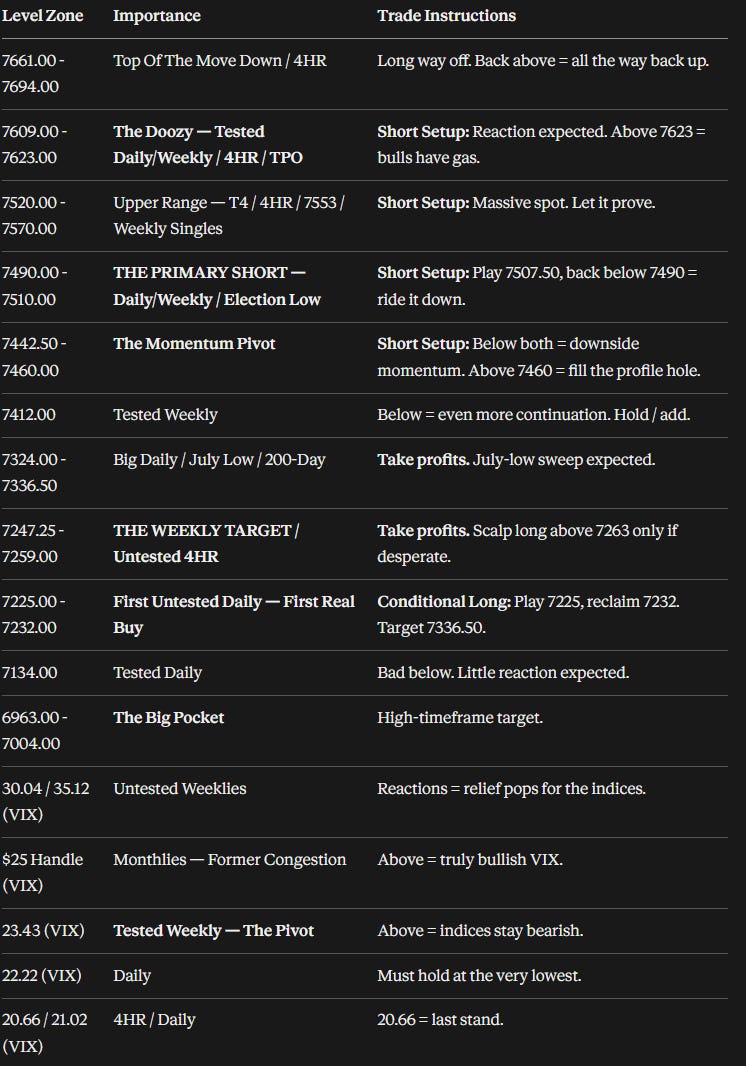
📌 Cheat Sheet – Key Levels Recap
🧠 Final Thoughts
I know this was a long one, but there was a lot I wanted to share. These are very difficult times to trade. We are doing well — our trade plans are great — and I am telling you to stick to the plan. These ranges are big and they are going to stay big. Size appropriately. You can make a ton of money with micros. On Friday I was sick and trading two micros, I did not trade well, and the money went so fast I said, “I can’t do this right now.” That is a perfect example of how careful you need to be with increased VIX and negative gamma — we are getting 10 to 20 points in minutes, if not seconds. Wait for the trade. Understand what we are above and below so you can stay in the trade, keep the runner, and let it progress. The whole point of these high-timeframe levels is to grab the banger moves.
The roadmap is clear. The process points down, but expect a pop first. The primary short is 7507.50 — play it, get back below 7490, then under 7458.50 and 7442.50, and it’s over. We may not even get above 7458.50. Below 7412, more continuation. The targets are 7336.50, the 7324 July lows, 7259, and the 7247.25 weekly target. My first real buy is 7225 with a reclaim of 7232 — and below that, it is 7134 and the 7000 pocket. On VIX, as long as it holds above 23.43, the indices stay bearish, and if it stays above the $25 monthlies, 30.04 and 35.12 are next.
Thank you for sticking with me today, and again, I am sorry I missed two post-market breakdowns last week. I am hoping my health recovers in the next few days and we are back to business as usual. I will see you tomorrow in the Inner Circle and, hopefully, for the post-market breakdown — and I will have the Trade Plan out Tuesday morning. Have an excellent rest of your Sunday.
Until next time—trade smart, stay prepared, and together we will conquer these markets!
Ryan Bailey, VICI Trading Solutions.
📊 Indicator String
Copy and paste the levels below into your S&P Edge Levels indicator to automatically plot today’s key levels on your chart:
7694.00|4HR|4H
7621.00|Tested WK|TW
7609.00|4HR|4H
7542.00|4HR|4H
7520.00|Tested 4HR|T4
7507.50|WK|W
7490.00|WK|W
7442.50|WK|W
7412.00|Tested WK|TW
7336.50|D|D
7259.00|4HR|4H
7225.00|D|D
7134.00|Tested D|TD


