
The 70% Warning: Why History Says the S&P 500 Will Crash This Year
Every 4 years, the market does the same thing. 12 of the last 17 times, it ended in correction. Here’s what the data says about 2026—and how to position.

Hello Team,
I’ve got a pattern for you today that most retail traders have never heard of—but institutions have been tracking it for decades.
~70%
That’s the probability of a stock market correction in 2026, based on 69 years of historical data.
Why? Because 2026 is a midterm election year. And midterm election years have a nasty habit of destroying portfolios.
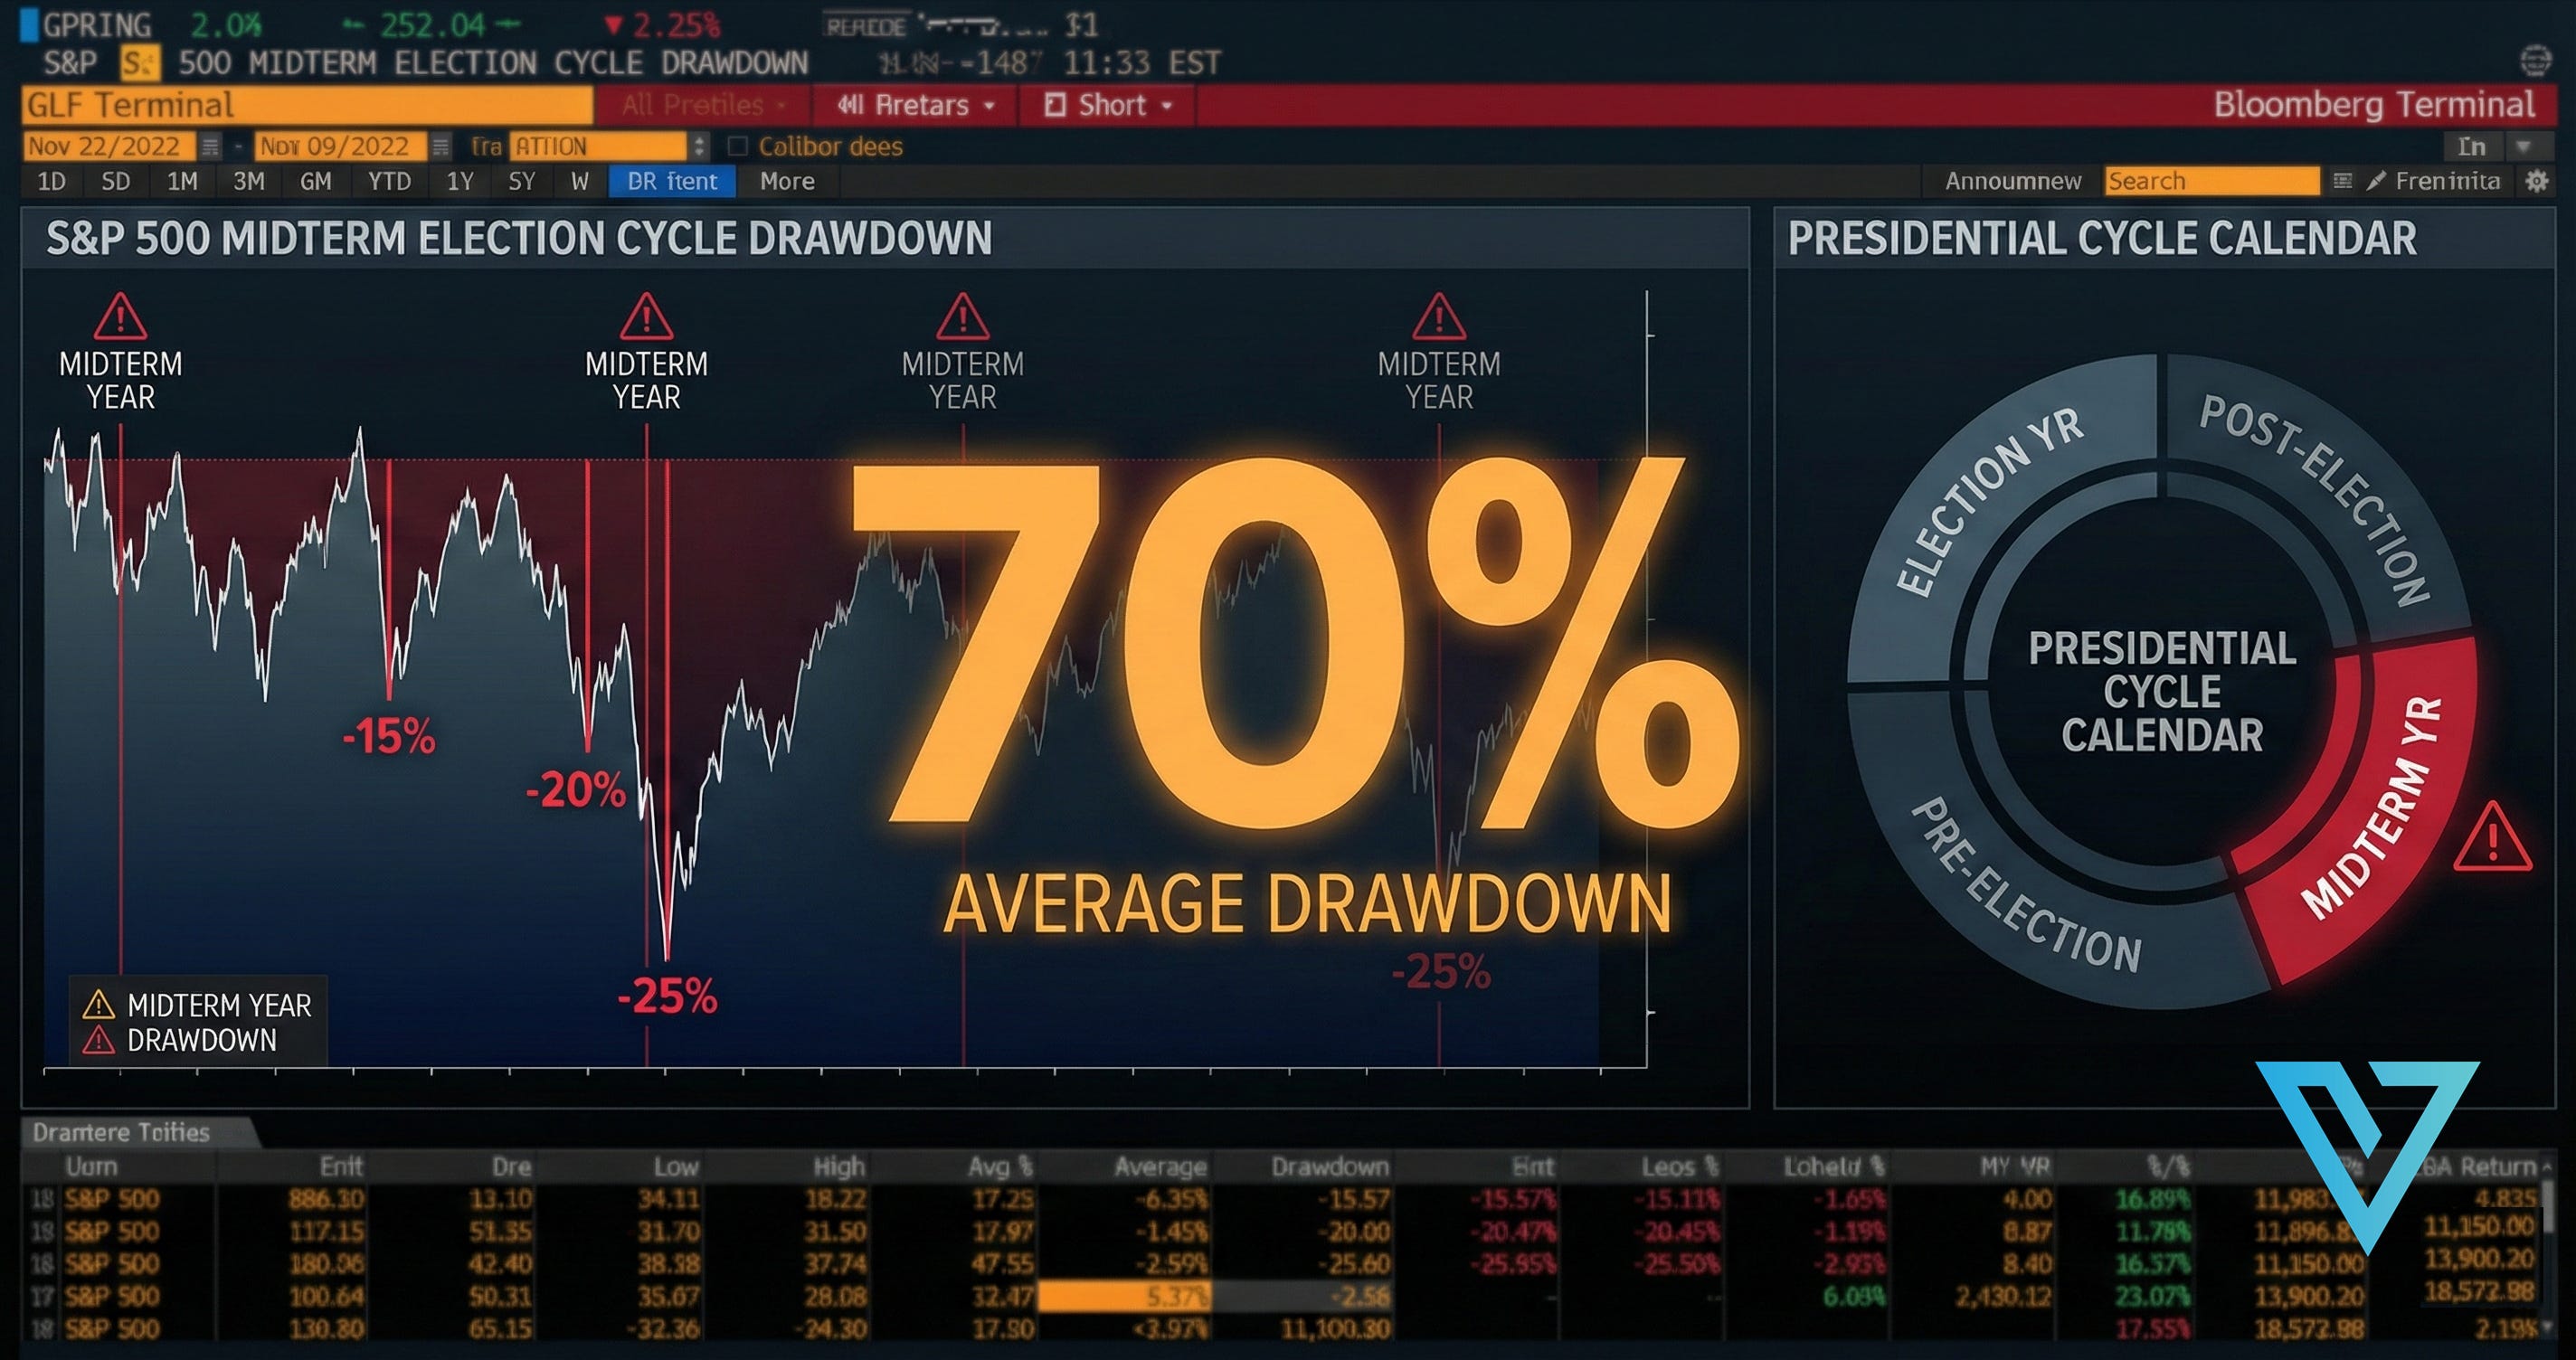
The Midterm Curse: What the Data Shows
Since the S&P 500 was created in 1957, there have been 17 midterm election years. Let’s look at the numbers:
Correction Rate:
12 of 17 midterm years saw a correction (10%+ decline)
That’s a 70% hit rate for market corrections
Average Intra-Year Drawdown:
18% — meaning at some point during midterm years, the S&P 500 typically falls 18% from its highs
Average Full-Year Return:
1% — midterm years are essentially flat when all is said and done
Let that sink in. History says the S&P 500 will fall 18% at some point this year—and finish roughly where it started.
Why Does This Happen?
Midterm elections create uncertainty. And markets hate uncertainty.
Here’s the pattern:
1. The political party in power almost always loses seats in Congress
2. Investors can’t predict the future direction of fiscal, trade, or regulatory policy
3. Money moves to the sidelines
4. Stocks sell off
This isn’t conspiracy theory. It’s documented across decades of academic research. One study noted this is “one of America’s most persistent, but least-known market anomalies.”
Recent Midterm Year Performance
Let’s look at the last three midterm cycles:
2022 (Biden midterms):
• S&P 500 drawdown: -27% (peak to trough)
• Full-year return: -18%
• Correction? ✅ YES
2018 (Trump midterms):
• S&P 500 drawdown: -20% (Q4 crash)
• Full-year return: -4%
• Correction? ✅ YES
2014 (Obama midterms):
• S&P 500 drawdown: -7% (mild by comparison)
• Full-year return: +11%
• Correction? ❌ NO (one of the exceptions)
The pattern isn’t perfect—but 70% odds are significant. Would you take a trade with a 70% probability of a major adverse move?
The Silver Lining: What Happens AFTER Midterms
Here’s where it gets interesting.
According to Carson Research, the six-month period following a midterm election (November through April) is the strongest period of the entire four-year presidential cycle.
Post-Midterm Rally (Nov-April):
• Average return: +14%
• This has been consistent across decades
The uncertainty dissipates. Markets know who controls Congress. Policy direction becomes clearer. And stocks rip higher.
So the playbook isn’t “sell everything and hide.” It’s “prepare for volatility, then capitalize on the recovery.”
2026: Why This Year Could Be Different (Or Worse)
Wall Street is currently forecasting the S&P 500 to hit 8,146 in the next 12 months—implying 17% upside from current levels around 6,976.
But there are compounding factors that could make 2026’s midterm turbulence worse than usual:
1. Tariff Chaos
President Trump’s sweeping tariffs are creating policy uncertainty on top of the normal midterm uncertainty. Trade war headlines will amplify volatility.
2. Elevated Valuations
The S&P 500 currently trades at 22.2x forward earnings—a premium to the 5-year average of 20x. Expensive markets fall harder when sentiment shifts.
3. Three Consecutive Years of Gains
The S&P 500 just posted triple-digit gains in three consecutive years—a feat accomplished only five times in history. Mean reversion is a real force.
4. Fed Uncertainty
With Kevin Warsh potentially taking over the Fed, monetary policy direction is in flux. That’s another layer of uncertainty markets will need to price in.
What This Means for Traders
Here’s how I’m thinking about this:
✅ Don’t try to time the exact top. Peter Lynch famously said: “Far more money has been lost by investors trying to anticipate corrections than has been lost in corrections themselves.”
✅ Expect volatility. An 18% drawdown means if the S&P is at 7,000, we could see 5,740 at some point this year. Trade smaller, keep stops tighter.
✅ Watch for the post-midterm setup. November through April has historically been the best time to be long. If we get the correction, that’s when to get aggressive.
✅ Quality over quantity. This isn’t the year to swing for the fences on speculative plays. Focus on your highest-conviction setups.
The Bottom Line
The stock market has a 70% chance of correcting in 2026 based on 69 years of midterm election data. The average intra-year drawdown is 18%. The average full-year return is just 1%.
Does this mean panic? No.
It means prepare.
History doesn’t repeat exactly, but it rhymes. The traders who acknowledge this pattern—and position accordingly—will be the ones capitalizing when the post-midterm rally hits.
The setup is forming. The data is clear. Now it’s about execution.
Until next time—trade smart, stay prepared, and together we will conquer these markets.
Ryan Bailey
VICI Trading Solutions