

Welcome back, everybody — it’s Bailey the Conqueror, and it’s time for the Weekend Review. Today is Sunday, November 1st, and here we go again with another spectacular week. Man, unbelievable. We have been short all week — or at least carrying a short-side bias — knowing we could not gain on any timeframe after losing on the Weekly once again the Friday before. They squeezed us all the way to the leg end, and you guys know I remained bearish all the way to the top into FOMC, only for us to distribute sideways, puke it on Friday, and hit our massive Weekly target. We called 7575.00, and we played it to perfection — coming down well over 250 points only to sweep that low. And I’ve got to ask you one question: Are you not entertained?
While other gurus were pointing for all-time highs, our process played true, our conviction held, and we hit our target only to get the liquidity we deserved. So far, we are on track to play this week exactly as planned. We came down, we wicked the lows, we hit our target perfectly, and we played some support — popping almost 75 points off the lows into Friday’s close. Now what happens? We could potentially squeeze a little bit, only to come back up and get smacked again. As usual, we’re going to do VIX, SPX, and ES, so let’s get right into it and get the week started right.
📧 IMPORTANT — Check Your Spam Folder. Please whitelist rbailey@vicitradingsolutions.com and info@vicitradingsolutions.com, mark them “Not Spam,” and add them to your contacts so every trade plan and brief lands in your inbox.
📈 The New & Improved SPX Morning Brief — Free. Seats are limited and they will fill up fast. Grab yours now: https://go.vicitradingsolutions.com/spx-brief
A Note on This Week’s Market:
News:
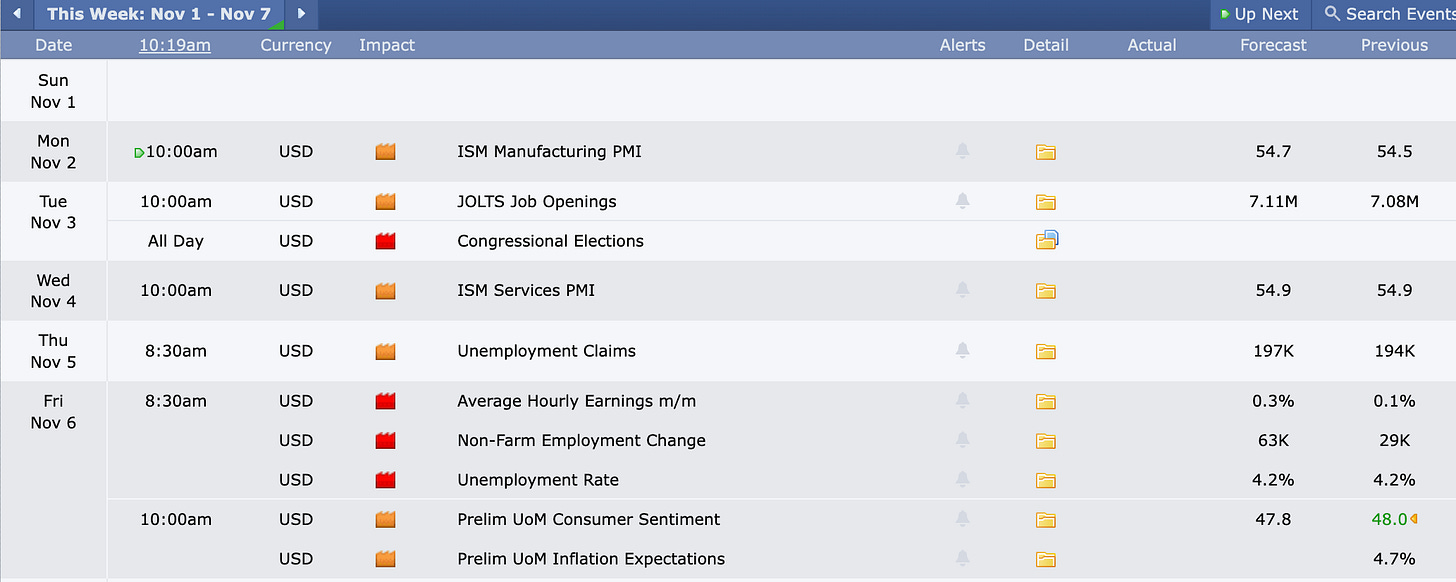
Range: We came down well over 250 points from the leg end into the 7575.00 sweep, then popped almost 75 points off the lows into the close. VIX closed up well over 20% on Friday. The ranges are serious — and so is the opportunity.
Value: Two overlapping weeks sit right on top of each other — massive overlapping value, including the value area low. The two-month composite value area low at 7674.00 lines up with our massive Weekly at 7673.50, with a small gap sitting right there and massive volume on both sides. The previous weekly value area low at 7701.00 is the bull/bear trigger to take us higher.
Inefficiencies: Excess on the weekly profile, left over from the massive move up, still needs to be cleaned up all the way down to 7547.00 — they nearly got it Friday. On SPX, there is still liquidity to sweep down in the 7464 pocket.
Trend: Still pointed down on all timeframes. We have not gained on any timeframe, and we have no reason to believe they can’t continue lower. A squeeze is imminent after Friday’s massive selling — but they are setting us up for more down.
🧠 Current Market Context
The 7575 Sweep & The Setup for More Down
We have not gained on any timeframe, and we are still pointed down on all of them. We saw the exact same thing happen last week: they came down, swept the lows, and squeezed all the way to the highest untested at the leg end — only to get smacked once again. I truly believe that same play is certainly possible right now, given the state of the charts. Why? Because we still have not gained on any timeframe. Friday’s big push down left us in a position to sweep the lows and potentially pop, but once again, they are just setting us up for more down. We’ll keep an eye on VIX to see whether that plays out with VIX staying above 17.50.
Make no mistake — I am clearly not done with this downside move. The 7575.00 area was just our first target. However, I do believe a squeeze is imminent. We are due for a pop back up after the massive selling on Friday, and ultimately we could retrace up just to get smacked again. That is certainly the setup they have given us right now.
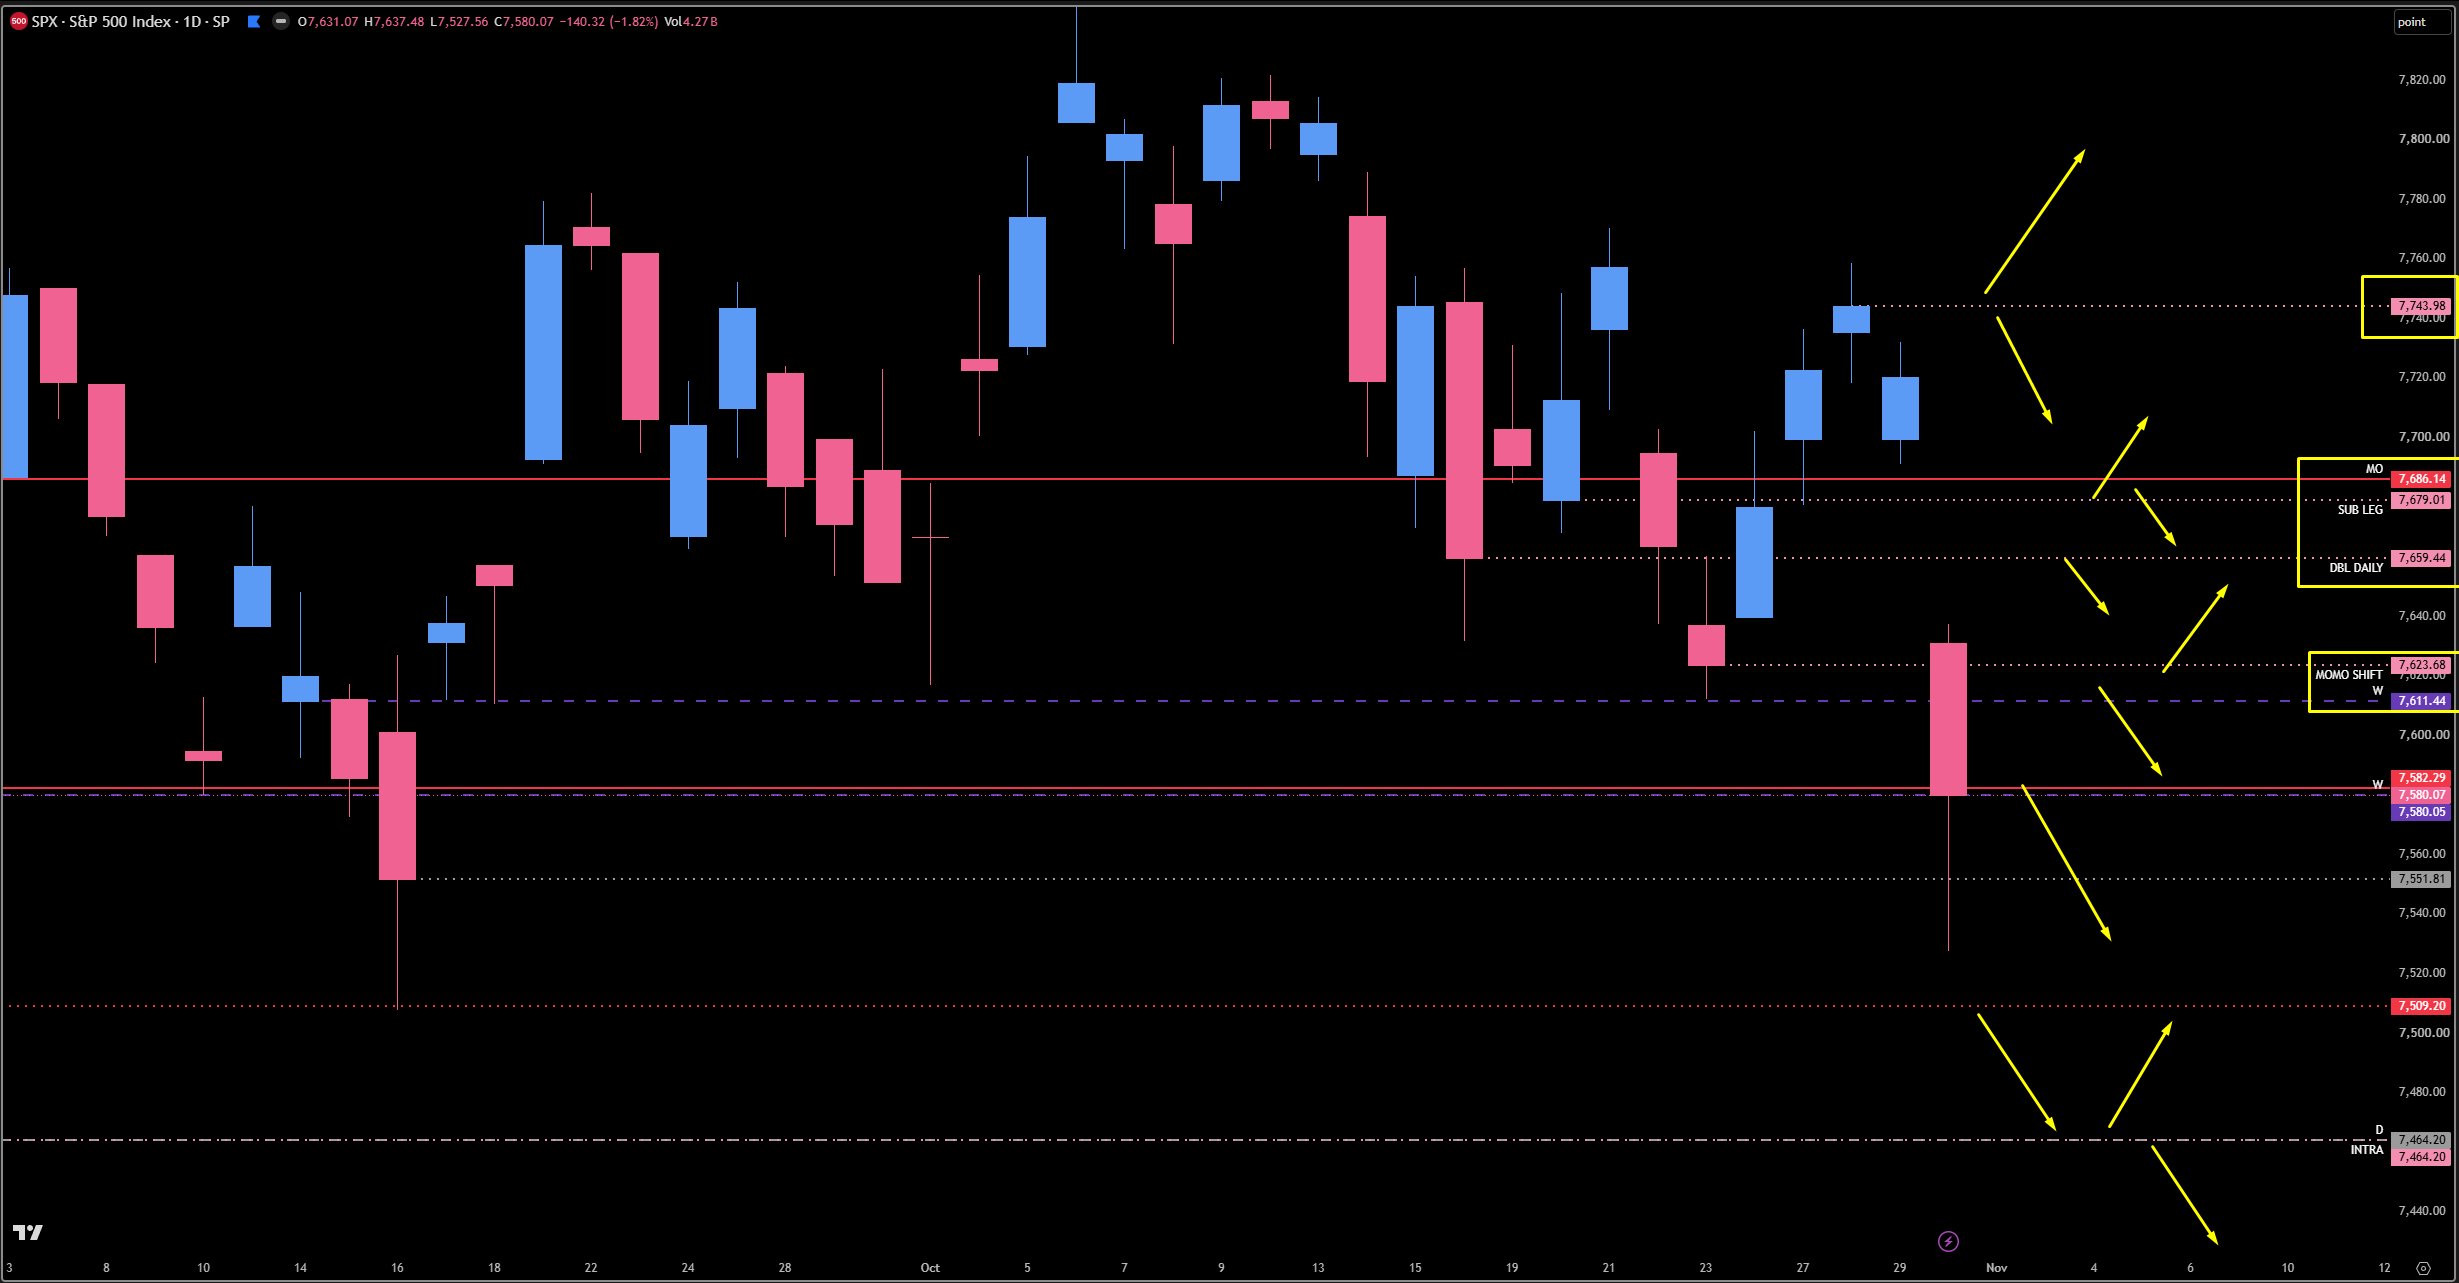
Here’s something interesting on SPX. We cleared the Weekly leg on ES, taking us well below it — but SPX does not give us the same image. In my opinion, that means SPX can still come down farther, as we really need to sweep that liquidity and get back down into the 7464 pocket. Ultimately, I think that is where we can come at some point. As we talked about, the SPX Daily at 7551 was not my favorite.
SPX: The 7623 Pivot & The 7582 Floor
This is going to be very simple and very clear. On the way up, the first big spot is the 7582 Weekly/Monthly pivot — this has been a very significant Monthly for us time and time again, and it is our above/below on the lower side. If they push up through it, we have the big Weekly at 7611 and the Daily at 7623. Look at the daily timeframe and you can see why this Weekly is so important: not once, not twice, not three times, but four times this level has played from the bottom side — telling us this will be massive. This zone played Friday for the short, and that is exactly what we played in the Inner Circle for the move down. 7623 is my obvious favorite and our huge pivot for above or below to change momentum — but you definitely can’t ignore the 7611 Weekly given how many times it has played.
If we want to continue our progression down immediately, we really need to stay below 7623 and 7611. Push above, and this is a massive momentum shift: we can easily come into the double Daily at 7659, which is located with a 4-Hour, and ultimately up into our final huge area of untested resistance as price gets back inside this leg and rotates higher. 7623 above/below on top, 7582 above/below underneath — that’s the SPX map.
🚨 VIX Analysis: The 18.90 Line & The 17.44 Bull/Bear Pocket
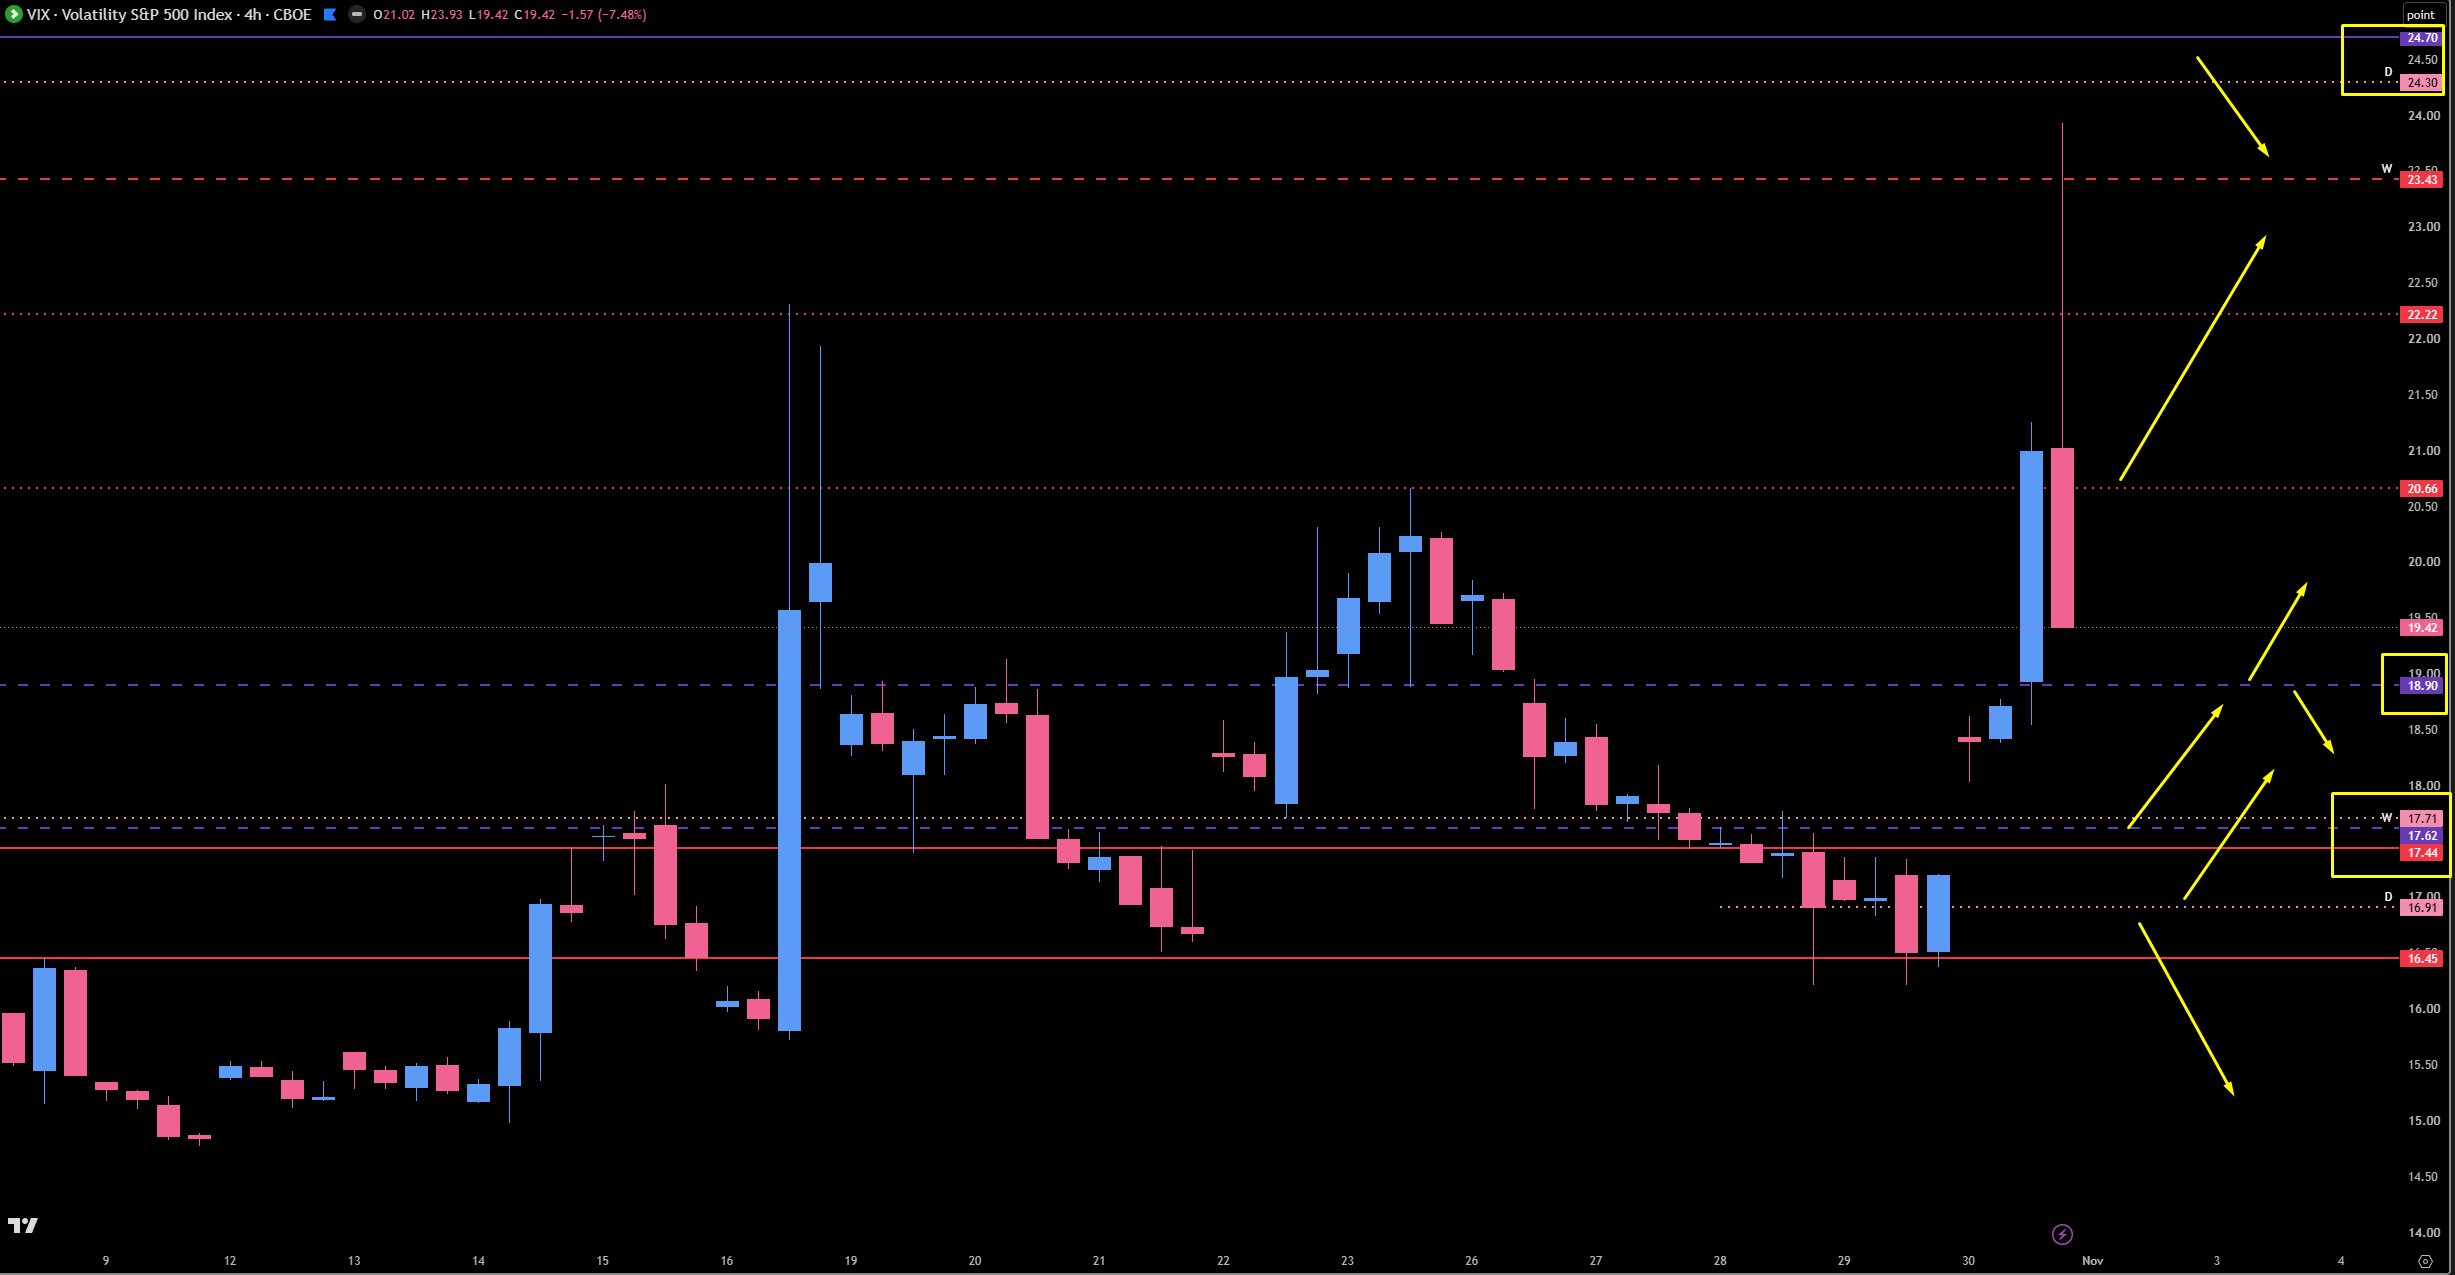
As promised, we start with VIX. This thing was on an absolute tear Friday when the market sold off, closing up well over 20% on the day. We have seen this happen multiple times before, and when VIX closes up 20% on a Friday, there is a very strong possibility — well over a 70% chance — of a rebound in price the next day, or even within the next 48 hours. We certainly believe that is possible here.
We have talked about the 16 handle providing massive support, and getting above our 17.44 Monthly was the big bullish trigger for VIX. Then they settled above 18.19 Friday morning for the gap up, squeezing VIX well into our massive area. They wicked the 23.43 Weekly high, only to come right back down — a massive pop-up that settled almost right back where it started the day. As we’ve said many times before, as long as VIX is above 17.44, we are inherently bearish on the indices — and below it, bullish. VIX is coming back down into support, and we need to look at it in two specific ways.
The Untested Overhead: 23.43 – 25.25
We still have the untested spot around 24.70 to 25.25 sitting overhead. VIX wicked the 23.43 Weekly high and came back down, so that untested pocket has not been touched. A push back up toward it would be a massive headwind for the indices.
The Bears’ Line: 18.19 – 18.90
18.90 is our first untested support. If the Bears want to get their stuff together, they need VIX to hold this level for the indices to continue to come down. If not — if VIX drifts below 18.19 — we come down into our fat pocket.
The Fat Pocket: 16.91 – 17.44
This is the huge pocket of support we’re going to look to play. It starts in the 17 handle with our 17.44 Monthly — this Monthly is tested, but given its significance, I do feel it can provide a reaction. Our last stand is the Daily at 16.91 that was created on the move up. This pocket is where VIX makes the decision whether to continue higher or ultimately traverse lower.
The Relief Scenario: Below 17.44
If VIX traverses lower through the pocket and below 17.44, we flip inherently bullish on the indices — sending them back up to potentially test what we lost on Friday’s massive move down. Quite an interesting spot that VIX is in.
🎯 Detailed Actionable Trade Plan (ES Futures)
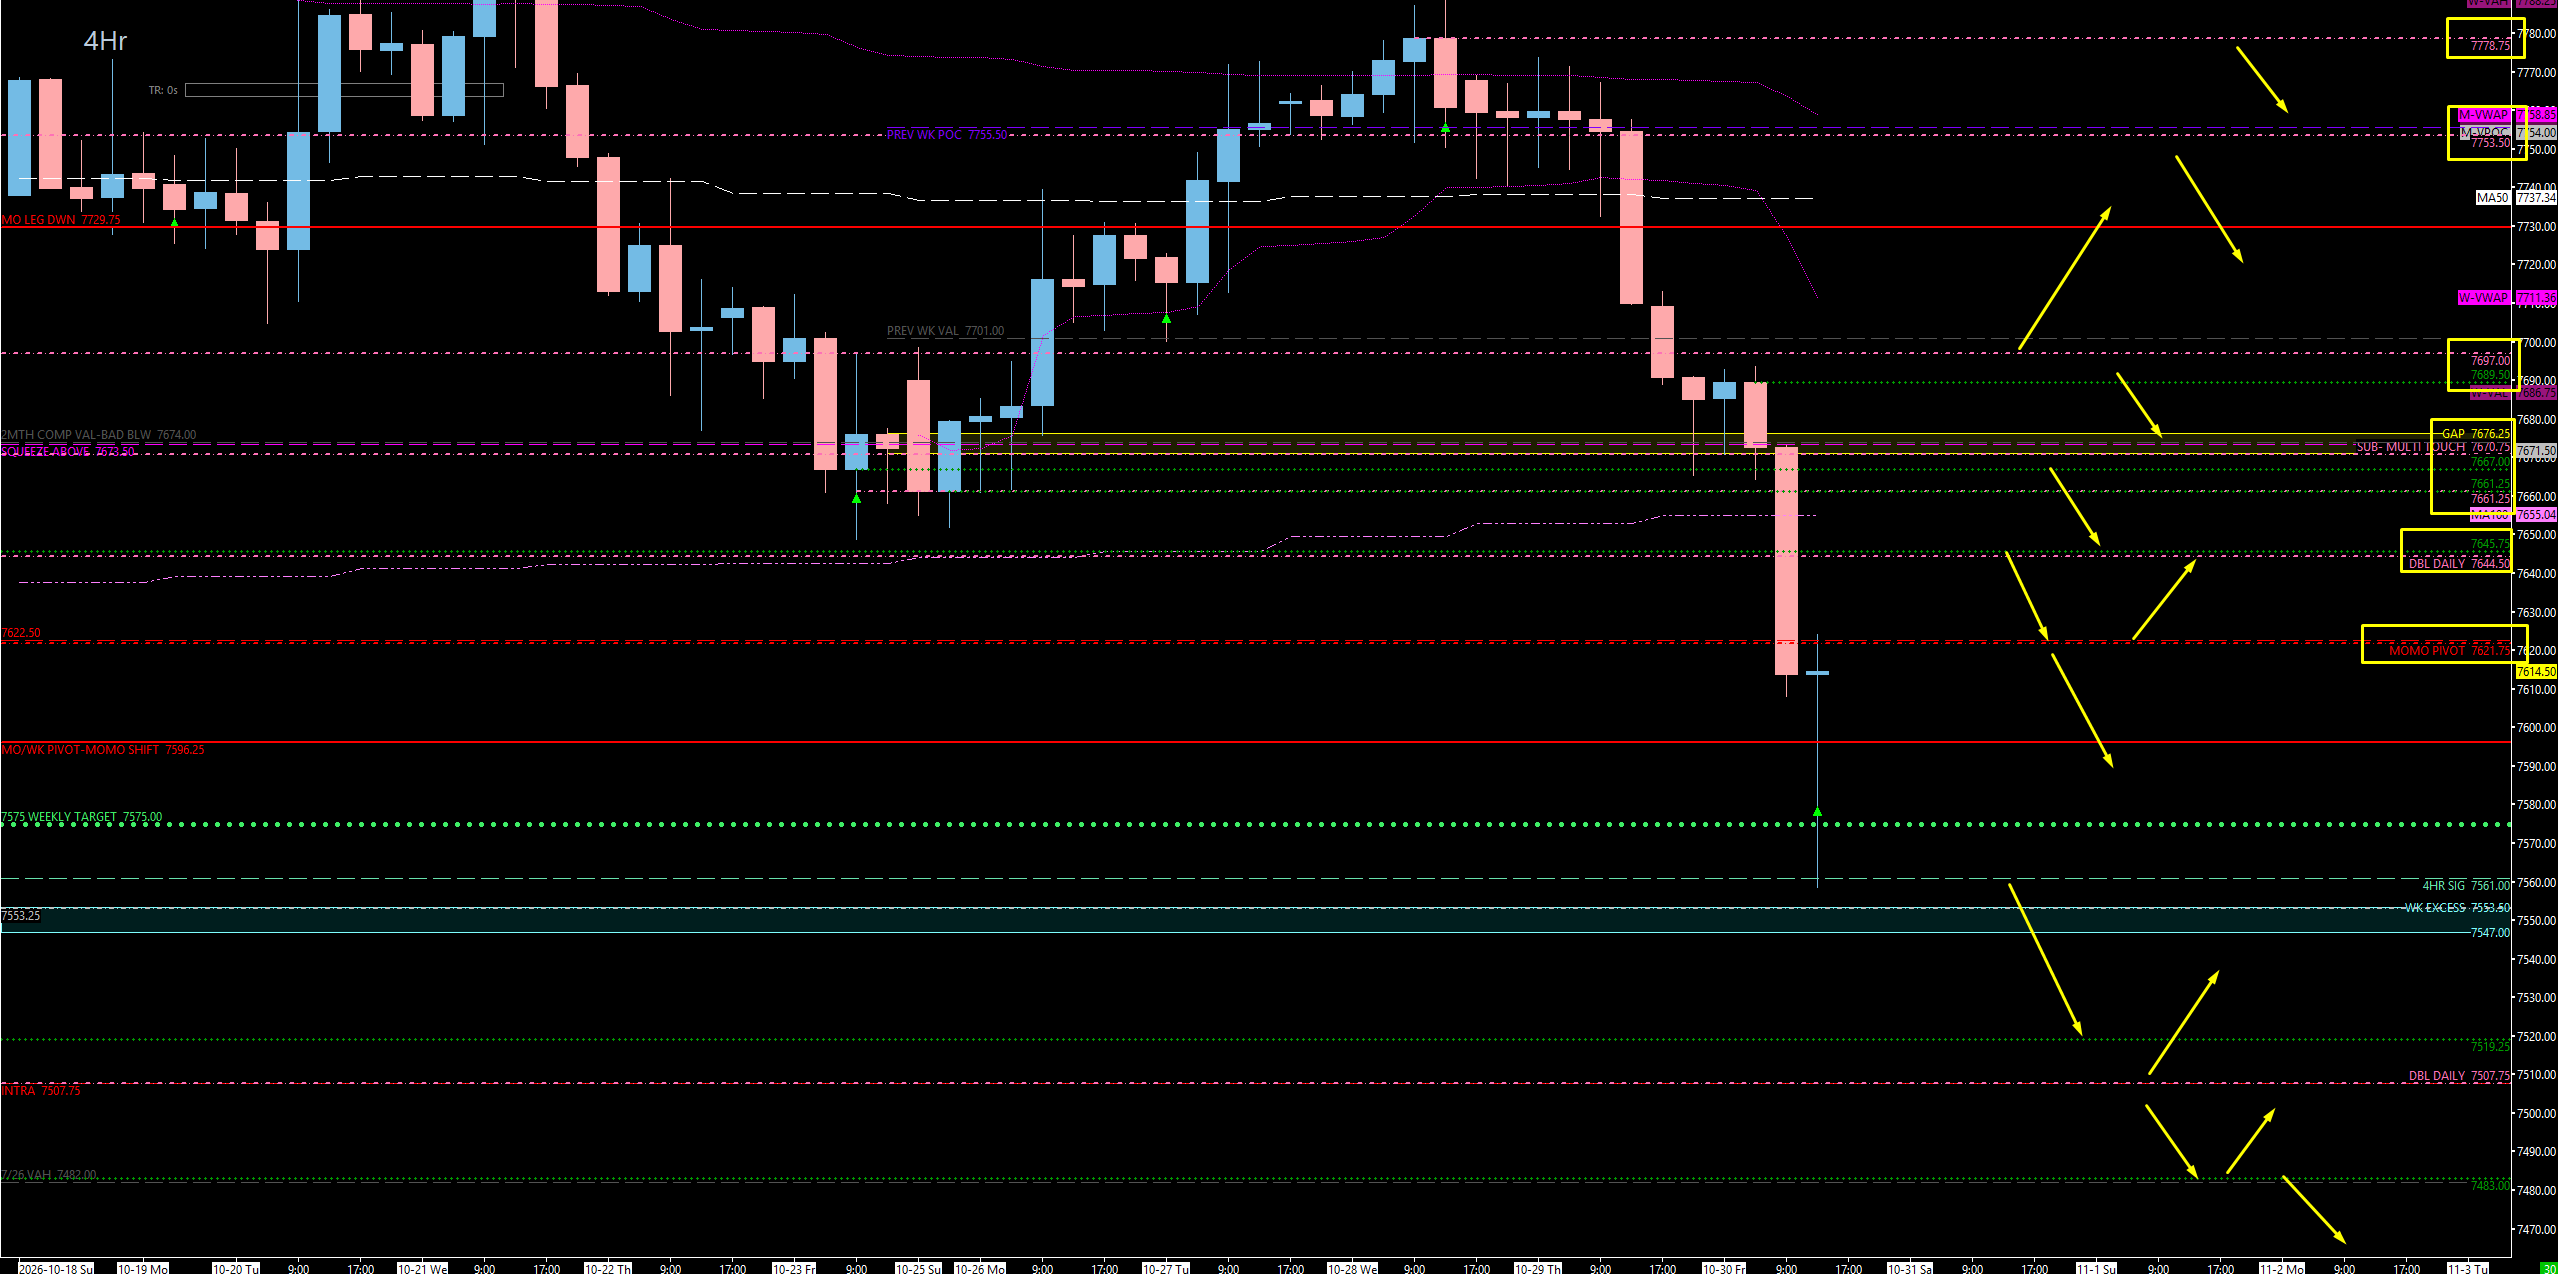
We are pointed down on all timeframes and have not gained on any of them. Our momentum shift pivot is the 7621.00 Daily / 7622.50 Weekly — right where we are sitting now. Above it, we should easily squeeze into 7644.50 or higher, with a lot of untested resistance stacked overhead and a reaction coming from each level. To get this thing moving back to the downside, I want to see us stay below 7670.75, and as long as we are below the 7674.00 two-month composite value area low, I lean massively to the downside. Above 7697.00 we need to be concerned, and the 7701.00 previous weekly value area low is the bull/bear trigger to take us higher.
🔴 Key Resistance Zones & Setups
The Momentum Shift Pivot: 7621.00 – 7622.50
7622.50 (Weekly), 7621.00 (Daily).
Context: This is our big Weekly/Daily momentum shift pivot, and we are sitting right on it. Friday’s pop off the 7561.00 4-Hour took us right back up into this area. There is a lot of untested resistance coming all the way up from here, and we could absolutely squeeze.
Actionable Setup: If we get above this pivot, we should easily squeeze into the 7644.50 area or even potentially higher. Below it, the downside lean stays in control.
Warning: Pointed down on all timeframes or not, a push above this pivot puts the squeeze in play — respect it.
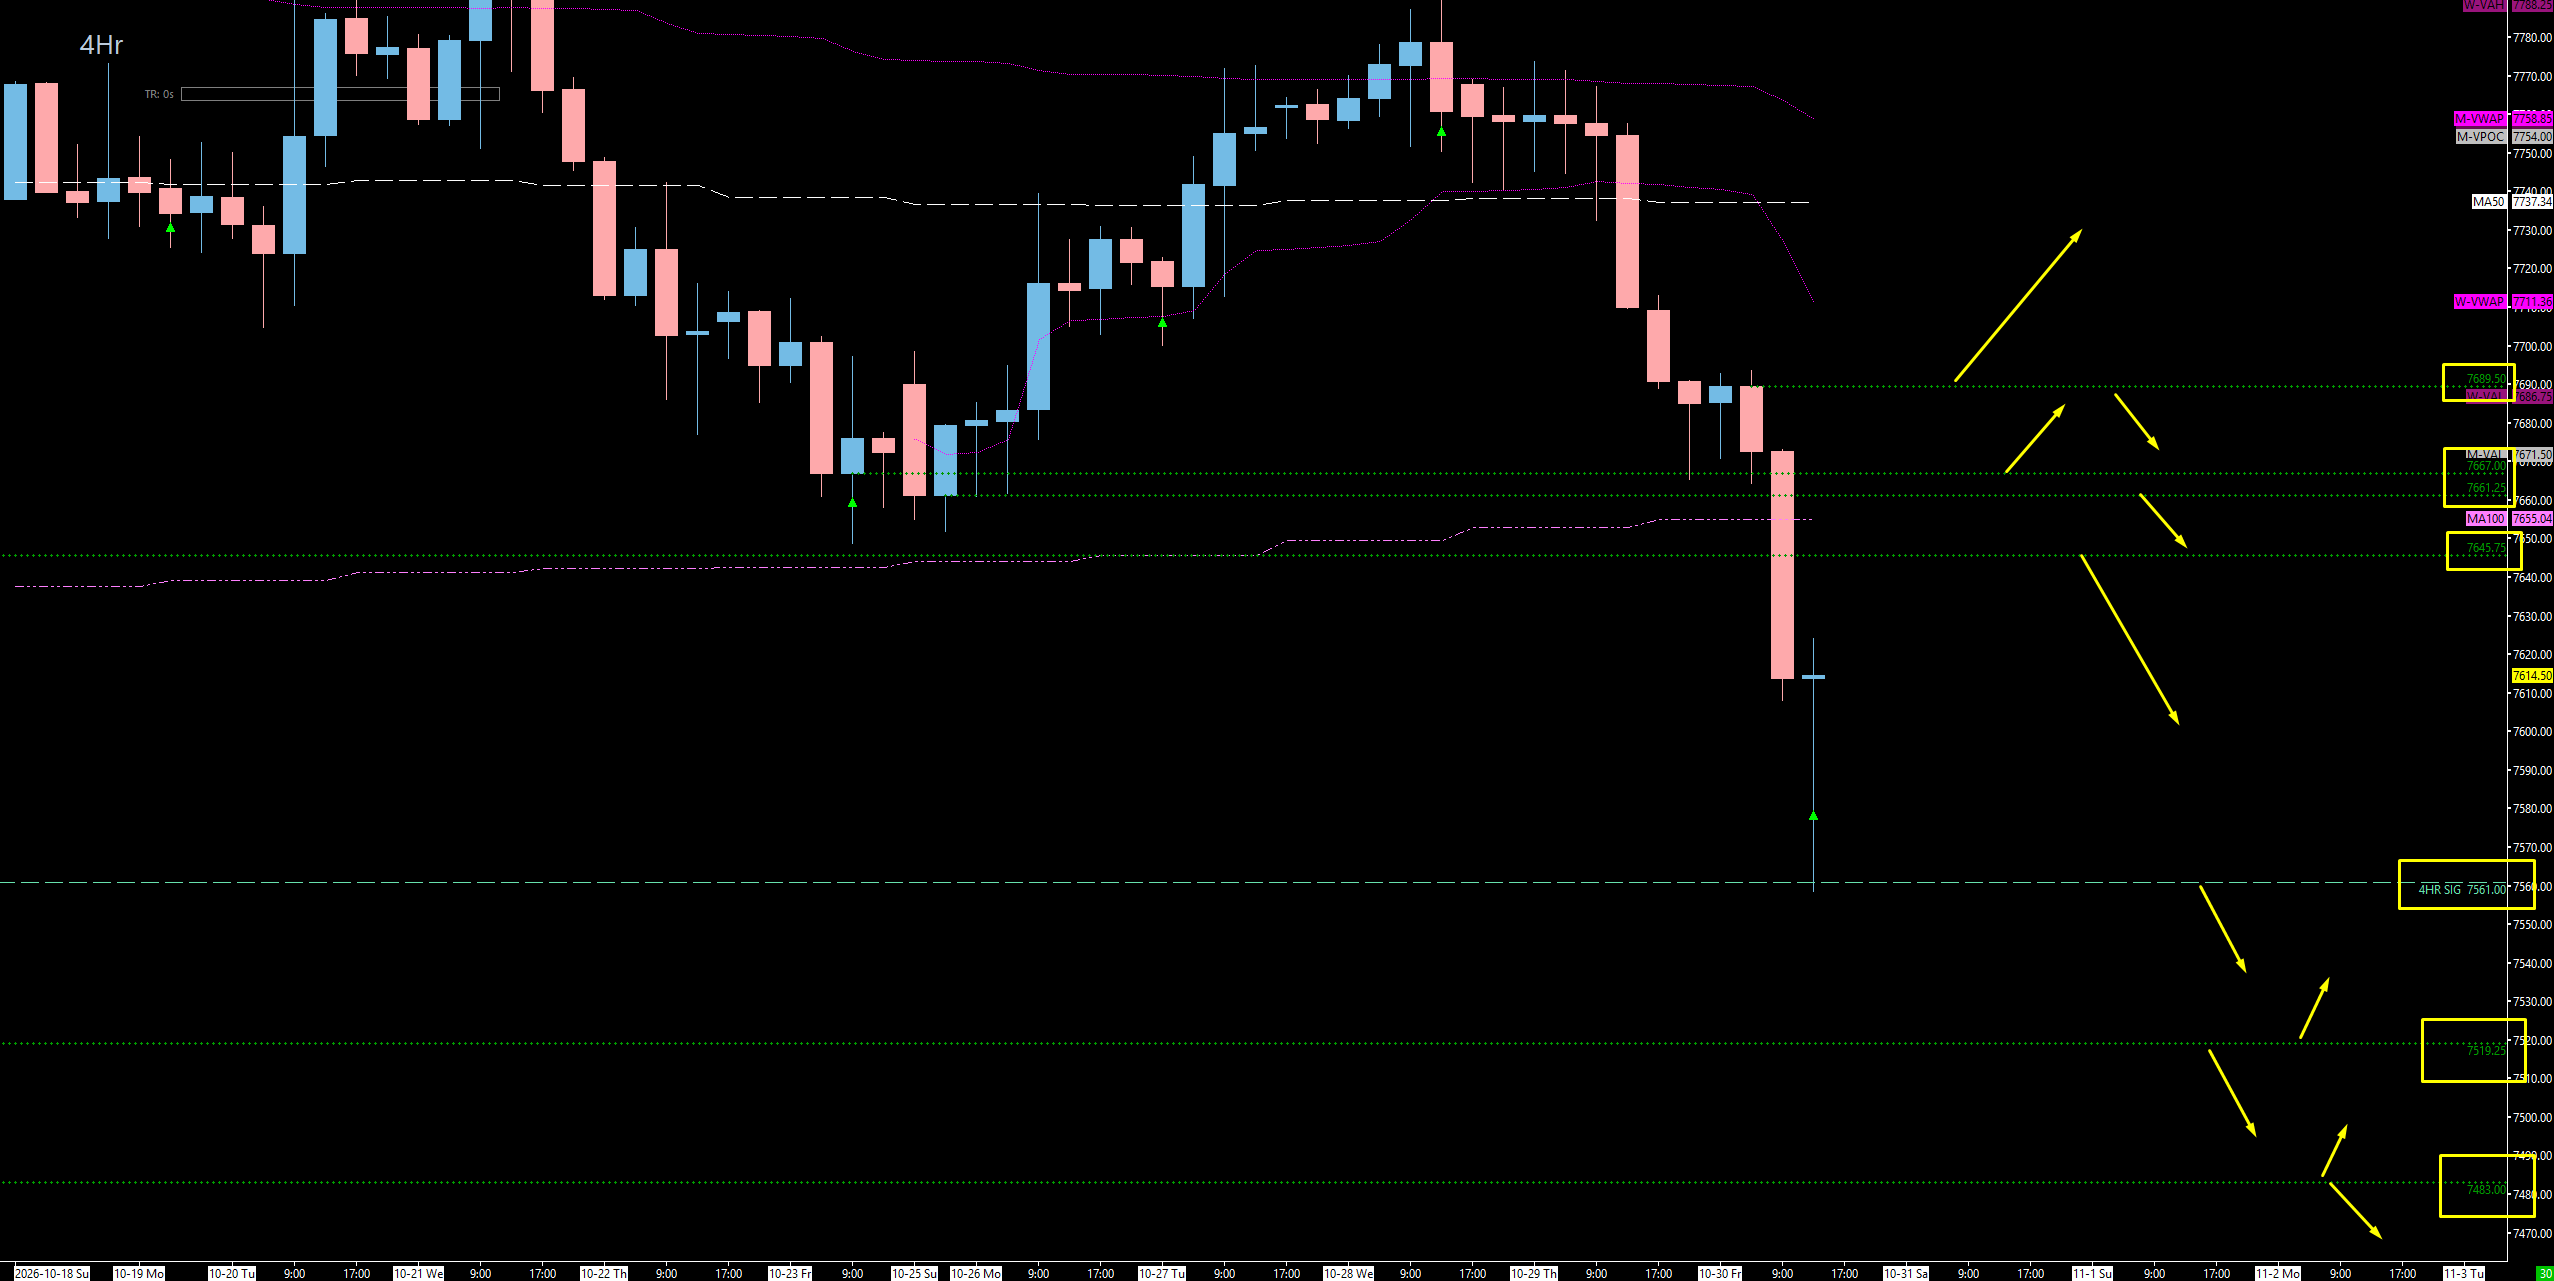
The 100-Day MA Alignment: 7644.50
7644.50 (Daily / 4-Hour), with the 100-day moving average sitting right in between our levels.
Context: This Daily aligns with that first 4-Hour — a great spot for a potential reaction, and I absolutely love it. Right in between our levels sits the 100-day moving average, a high-timeframe moving average that other big players will be looking at. All these touches from the bottom side make this area extremely important.
Actionable Setup: Short Setup: Watch for a reaction here on the squeeze. I do see a reaction coming from each one of these levels — which one is going to be the one that sends us down is hard to say.
The Clean Double: 7661.00
7661.00 (Daily / 4-Hour).
Context: The Daily at 7661.00 aligns perfectly with the 4-Hour at 7661.00. I don’t think that could get any cleaner. This is where the serious resistance begins — running from 7661.00 up through the 7670s and ultimately into 7689.50.
Actionable Setup: Short Setup: Another prime reaction spot on the way up. Look for the smack.
The Massive Weekly & Composite VAL: 7670.75 – 7674.00
7674.00 (Two-Month Composite Value Area Low), 7673.50 (Weekly), 7670.75 (Daily).
Context: The two-month composite value area low we used as our guide last week proved very well for where the momentum shifts. Two overlapping weeks sit right on top of each other — massive overlapping values, including the value area low. There is a small gap directly at this level with massive volume on both sides, and the little gap fill comes all the way up into it. It lines up with our massive Weekly at 7673.50 and the Daily at 7670.75. This is the big spot we need to pay attention to.
Actionable Setup: Short Setup: We want to stay below this to continue our downside momentum. I really want to see us stay below 7670.75 to get this thing moving back to the downside — and as long as we are below 7674.00, I continue to lean massively to the downside.
The Highest Resistance & The Bull/Bear Trigger: 7689.50 – 7701.00
7701.00 (Previous Weekly VAL / Bull-Bear Trigger), 7697.00 (Momentum Concern Line), 7689.50 (Resistance — Missed Friday).
Context: 7689.50 is the level I was looking to get played on Friday that they missed. On a squeeze, we could come all the way up to 7689.50 and 7697.00 — and as you guys know, they always seem to squeeze into the highest. Let’s just hope that doesn’t happen. The previous weekly value area low at 7701.00 is our bull/bear trigger to take us higher.
Actionable Setup: Short Setup: If they squeeze us all the way up here, watch for the reaction. We really want to maintain below 7697.00 and ultimately below 7670.75 to continue this downside progression.
Warning: Above 7697.00, we need to start being concerned about momentum. That does not mean they are not still pointed down on all timeframes, but we know what squeezes look like. Above 7697.00 and the 7701.00 trigger, we start to find ourselves in some trouble and could potentially squeeze much higher.
🔵 Key Support Zones & Setups
The Swept Target & 4-Hour Launch Pad: 7561.00 – 7575.00
7575.00 (Weekly Target — Hit & Swept), 7561.00 (Tested 4-Hour).
Context: Look at the way they came down and swept 7575.00, our big target, and played our 4-Hour level to the left with absolute precision. This was a massive pivot where the move turned — we figured there was some volume there and we’d get a reaction, especially after sweeping our massive Weekly target. The pop off 7561.00 paid well over 60 points right back into the 7622.50 Weekly.
Actionable Setup: 7575.00 was just our first target. Watch this area on any retrace — below it, the excess cleanup is next.
The Excess Cleanup: 7547.00 – 7553.25
7553.25 (Tested Daily), 7547.00 (Weekly Profile Excess).
Context: I still have excess in the profile — left over from the massive move up — that needs to get cleaned up, all the way down to 7547.00. They nearly got it Friday. Very, very close. The Daily at 7553.25 is very much tested now.
Actionable Setup: Close is only good in horseshoes and hand grenades. For us, we are looking for the touch and the cleanup — this is our lower target, and I do think it gets cleaned up at some point.
The Thick Support Pocket: 7507.75 – 7519.25
7519.25 (4-Hour), 7507.75 (First Major Support).
Context: This is the spot we have been focusing on since last week or two weeks ago — if we come down and sweep that low, where do we find support? 7507.75 is the first spot I’ll be looking at, with the 4-Hour at 7519.25 just above. This area is thick with support and I like it quite a bit.
Actionable Setup: Look for a reaction somewhere in here that could provide us some serious liquidity.
The Untested Island VAH: 7483.00
7483.00 (4-Hour / Untested Weekly Value Area High).
Context: This 4-Hour lines up beautifully with a Weekly value area high that is absolutely untested. For those of you familiar with profile terms, this is an island — and this is the value area high on the island side.
Actionable Setup: Between this spot and the 7507.75 – 7519.25 pocket, I do truly believe we get a reaction that could provide us some serious liquidity.
The Naked Weekly POC: 7413.00
7413.00 (Untested Weekly / Untested Value Area Low / Naked Weekly POC).
Context: If they push below the island, we have an untested Weekly at 7413.00 that also aligns with an untested value area low and a naked Weekly POC.
Actionable Setup: Sweep Setup: This would be a beautiful spot to sweep the low, play this Weekly, and get back above it — only to push much higher.
The Final Confluence: 7368.00 – 7380.00
7380.00 (Daily / 4-Hour), 7368.00 (Daily / 4-Hour).
Context: If they move lower than that, these are my last two spots. They are aligned with two Dailies and two 4-Hours.
Actionable Setup: First-Touch Reaction: This confluence should give us the confidence to play these areas on first touch.
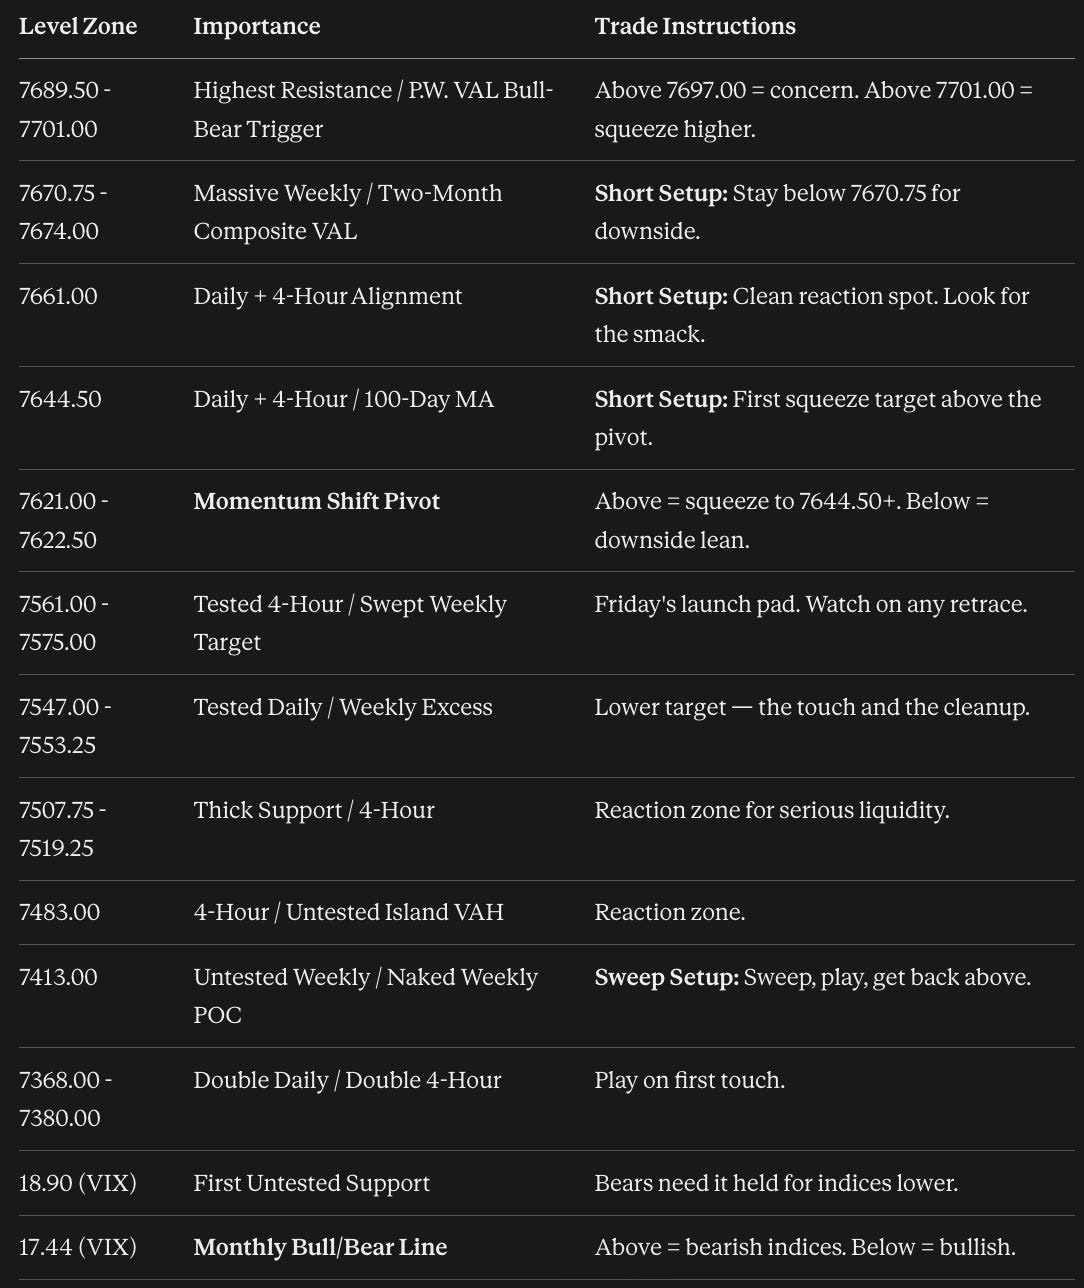
📌 Cheat Sheet – Key Levels Recap
🧠 Final Thoughts
Last week was crazy, and it was tough — they squeezed us all the way up until FOMC only to distribute sideways and puke it on Friday. But our process played true and our conviction paid. If that wasn’t a beautiful display of trade plan perfection, I don’t know what is. Coming into this week, we are still pointed down on all timeframes, we have not gained on any of them, and 7575.00 was just our first target. A squeeze is imminent — but they are setting us up for more down. Your make-or-break levels are the 7621.00 – 7622.50 momentum shift pivot, the 7670.75 – 7674.00 line we want to stay below, and 7697.00 – 7701.00, where we start to find ourselves in trouble. On SPX, it’s 7623 above/below on top and 7582 underneath. And keep your eyes on VIX: 18.90 is the Bears’ line, and as long as VIX is above 17.44, we stay inherently bearish on the indices. Be patient and let the levels play and prove themselves before you engage.
Make sure you strap in and enjoy the ride — it is going to be a volatile week, and I’m looking forward to making some points. I’ll see you all Monday in the Inner Circle and Tuesday for the trade plan, and next week, you already know — we’re going to conquer the market. Cheers, and have a great rest of your weekend.
Until next time—trade smart, stay prepared, and together we will conquer these markets!
Ryan Bailey, VICI Trading Solutions.
📊 Indicator String
Copy and paste the levels below into your S&P Edge Levels indicator to automatically plot today’s key levels on your chart:
7701.00|P.W. VAL|GD
7673.50|WK|W
7670.75|D|D
7661.00|D|D
7644.50|D|D
7622.50|WK|W
7621.00|D|D
7561.00|Tested 4HR|T4
7553.25|Tested D|TD
7519.25|4HR|4H
7483.00|4HR|4H
7413.00|WK|W
7380.00|D|D
7368.00|D|D


