

Welcome back everyone, and happy Sunday. It is the week of 4/20 — time to celebrate, because what we just witnessed over the past three weeks was truly one for the history books. I was reading through some news articles and the data confirms it: this move has reached the 99.7 percentile of all rallies since 1950. We have gone from losing on all timeframes to officially regaining on all timeframes, and from a Negative Gamma regime into a full-blown Positive Gamma regime. That is a massive structural shift.
As you guys know, we gapped down last Sunday and then squeezed all week. When I look back at the move, we are talking roughly 350 points to the upside on ES. Absolutely unbelievable. And the crazy part is — we actually called the lows on the double sweep at 6362. I will be honest, I had no idea that what came next was in the bingo cards. But here we are. As we head into the week of 4/20, the chart is giving us no reason to believe anything other than continuation higher. We just trade the chart whether we like it or not — and right now the chart points up. We are going to keep this review focused on VIX and ES today. SPX is pretty much mooning all-time highs, so we will keep it easy and keep it brief.
New Product Drop — SPX Edge Morning Brief: I just released a new free tool for the community. It is a daily brief that comes out at 5 a.m., takes 60–90 seconds to read, and gives you the point of controls and value areas for the week, month, and day on SPX, TWAP positioning, pattern intelligence reports, and fresh news pulled at 4 a.m. that is no more than eight hours old. TWAP is the institutional standard for SPX since there is no real volume on the index — it is time-weighted average price. I use this every single morning with my coffee. I am giving it away free to the first 500 subscribers. The landing page link, Substack post, and Twitter announcement are all out — sign up takes 15 seconds. Get it, enjoy it, and sharpen your edge.
📊 Introducing The SPX Brief: The Morning Edge I’ve Been Waiting to Give You

For years, I’ve started every trading day the same way.
A Note on This Week’s Market:
3-Week Context: We are sitting at roughly 350 points of upside over the past three weeks — a 99.7 percentile move since 1950. We had a massive gap up two weeks ago, then another gap up last week, with singles left on the way up and price balancing at the highs as the week closed.
Range: The weekly TPO is loaded with inefficiencies from the historic push higher. There is a real possibility we come back in this week to clean up some of those singles, particularly if price moves below 7152. Balance at the highs suggests acceptance of value up here, but the chart can always come back to fill what it left behind.
Gamma: We are now in a full Positive Gamma regime. Dealers are hedging to the upside, which is a completely different environment than the Negative Gamma chop we were trading in for weeks. This is a structural tailwind for the indices.
Trend: Upside on all timeframes. After the close last week, we have officially gained on the weekly — which means daily, 4-hour, 1-hour, and weekly all point up. The chart gives us no reason to believe this squeeze is over. We trade the chart, and the chart points higher.
🧠 Current Market Context
The Historic Squeeze & The Inefficiencies Left Behind
The weekly TPO tells the entire story — we have had an unbelievable push over the past few weeks, with a massive gap up two weeks ago followed by another massive gap up last week. Price pushed higher and higher in an extremely inefficient fashion, leaving singles on the way up, before ultimately starting to balance at the highs just toward the end of the week. We have accepted value at these highs, but the efficiencies below are real, and I do think we come back in this week to start cleaning some of them up — at least partially.
The key level to watch is 7152. As long as we hold above this area, we continue to push higher with no real roadblocks. However, a move below 7152 opens the door to fill in that big TPO gap below, and my first real target on a pullback would be the Weekly POC at 7062, which lines up beautifully with a 4-hour level at 7060.50. That is where I would look for our first meaningful reaction on the long side. Underneath that, we have the previous all-time high at 7043 — and it would not surprise me one bit to see a sweep below the previous ATH to clean up the remaining singles, followed by a reclaim and a squeeze right back to the upside. That is the kind of play I am watching for.
Zooming out to the weekly timeframe, I have three major support spots lined up: the 7004 Weekly, the 6963.50 Weekly (my favorite), and the 6883 Weekly. We have officially gained on all timeframes after the close last week, which sets up some really interesting support levels for us to buy. The structural bullish thesis is fully intact, and every pullback into these zones should be treated as a potential buying opportunity — not a reason to panic. One step at a time, and remember: first support is the best support to hold if we want this up-move to continue. Every time we lose a major area of support, the bulls have a bigger lift to reclaim it.
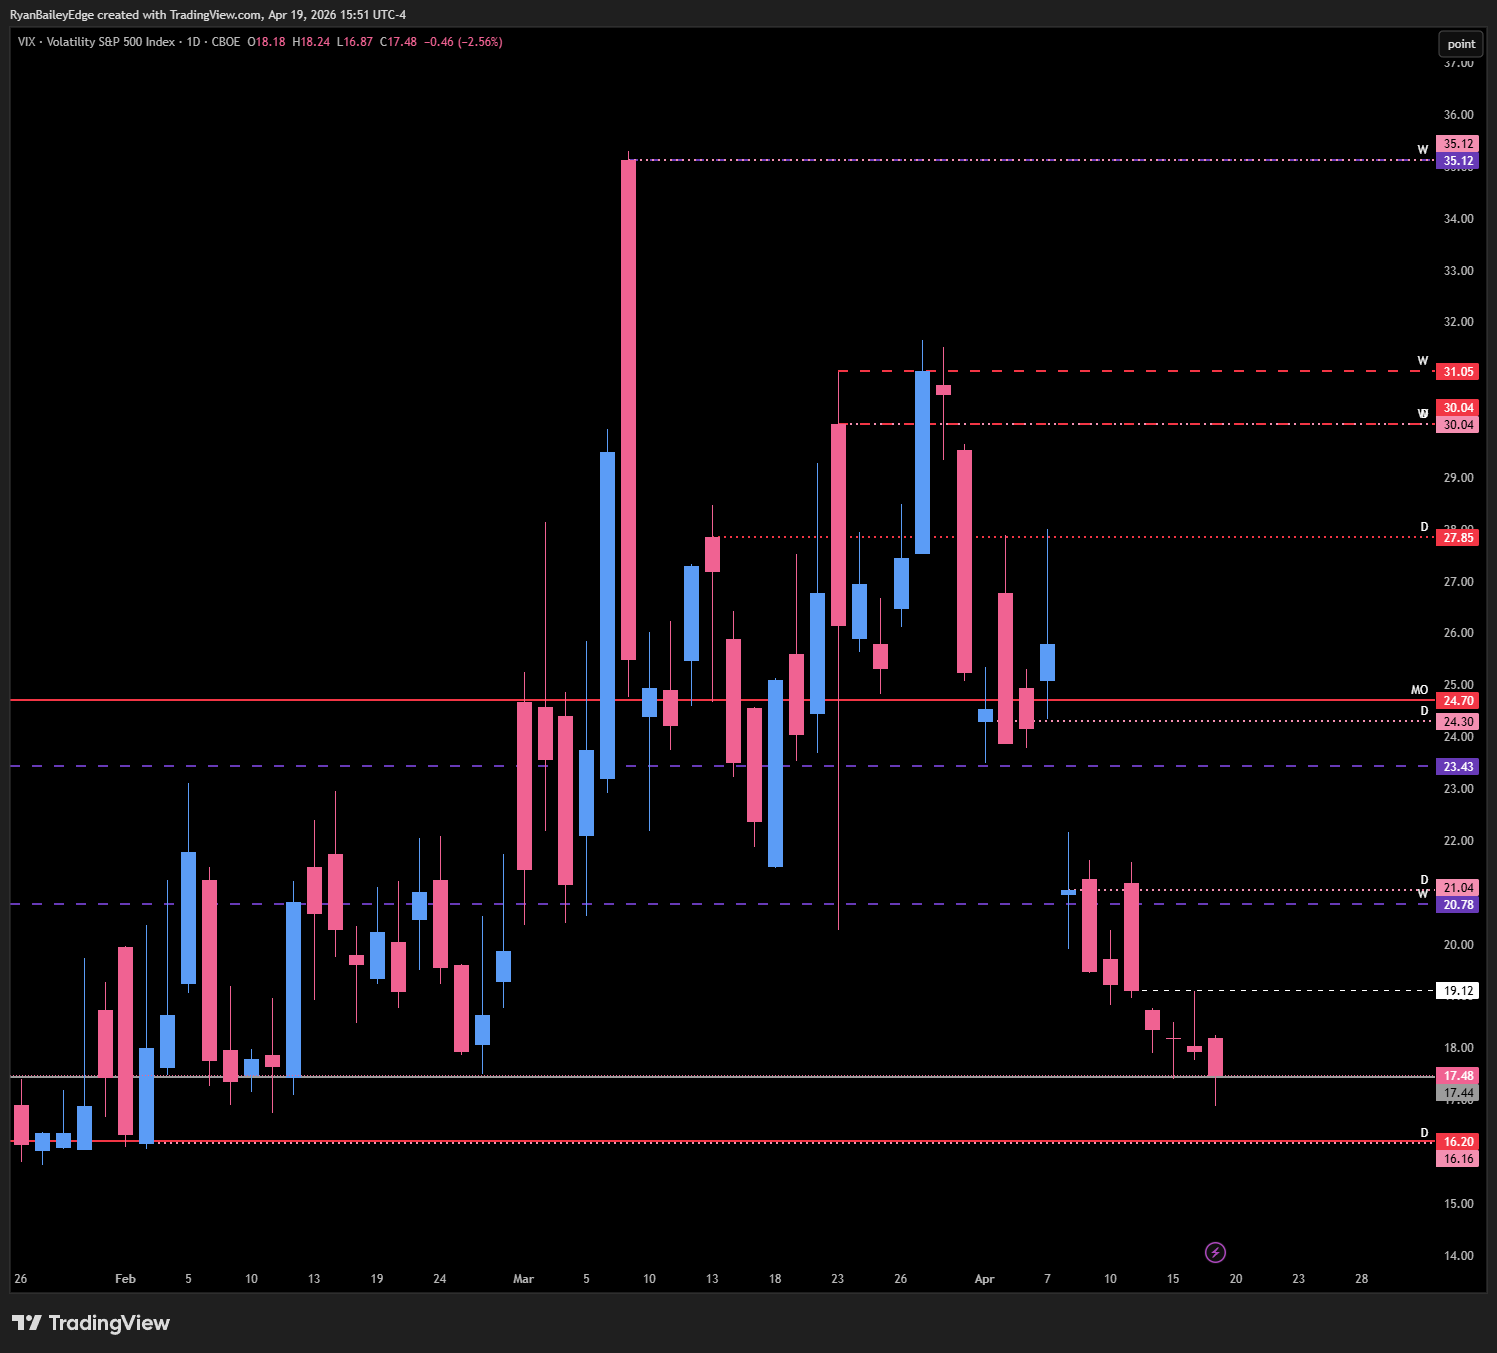
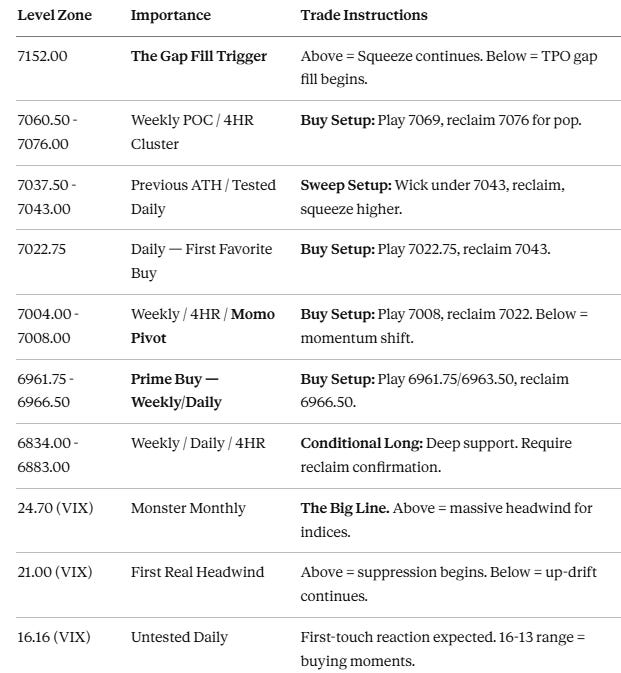
🚨 VIX Analysis: The 24.70 Monster Monthly
VIX continues to drift lower and is holding the significant monthly support at 17.44 right now. To be frank, it currently looks like we could come a little lower from here. As long as VIX remains below 19.00, the indices stay suppressed on volatility and the up-drift continues. Above 19.00 is where we start to feel the pressure, and above 21.00 is where real suppression on the indices begins.
The Downside Reaction Zone: 16.20 (Tested Monthly) and 16.16 (Untested Daily). If VIX comes down into this area, I would expect a reaction here on first-touch. I don’t know if this will be the absolute low, but the combination of a tested monthly and an untested daily so close together is meaningful. Keep in mind — when we get down into the 16.00 to 13.00 range, history shows we typically get a violent reaction at some point. Those reactions are sharp and scary, but they are truly buying moments for the indices when they come. We will play that when the time comes.
The First Real Headwind: 21.00 (Key Above/Below). I do believe VIX gets a reaction here on first touch if price comes up to play it. As long as price rejects this level, we continue our up-drift in the indices. However, a push above 21.00 would give us quite a bit of suppression in the indices and bring us back down pretty good.
The Heavy Resistance Stack: 23.43 (Untested Weekly from the bottom up), 24.30 (Daily), 24.70 (Massive Monthly). If you have been trading with me longer than a month, you know 24.70 is our monster level. Anytime VIX is above or below this, we have a severe amount of pressure moving against or for the indices. A push above 24.70 creates a massive headwind that would bring the indices down significantly. We are nowhere near this right now, but it remains the structural line in the sand for VIX.
🎯 Detailed Actionable Trade Plan (ES Futures)
We are playing the bullish thesis this week. The major above/below pivot is 7152 — above this, we continue the squeeze with no real roadblocks; below this, we start cleaning up the inefficiencies left behind. Our prime buy zone lower is the Weekly/Daily confluence at 6961.75 - 6963.50, with the momentum pivot at the 7004 Weekly marking the line between continuation higher and a bigger structural shift lower.
🔴 Key Resistance Zones & Setups
The Gap Fill Trigger: 7152
7152.00 (Key Above/Below Pivot / Edge of Weekly TPO Gap).
Context: This is the key pivot for the upcoming week. We are balancing at the highs right below this area, and what this level does on the smaller timeframes is very clear: above it, we continue to push higher and accept value up here; below it, the weekly TPO gap opens up and we have a high probability of filling that inefficiency. The chart left a lot of room behind it on the way up, and 7152 is the trigger that determines whether we clean it up this week or keep squeezing.
Actionable Setup: As long as price holds above 7152, we maintain the squeeze and look for continuation higher. A sustained push below 7152 opens the door to fill the gap and pulls us toward our prime buy zones below. This is your above/below gauge for the entire week.
Warning: Do not confuse a break below 7152 with a bearish trend shift. This is a buying mechanic — price is coming back in to clean inefficiencies before the next leg up. Treat pullbacks into support as opportunities, not exits.
🔵 Key Support Zones & Setups
The Weekly POC Zone: 7060.50 - 7076.00
7076.00 (Previous Overnight Low / Reclaim Target), 7070.00 (Naked 4-Hour POC), 7069.00 (Untested 4-Hour), 7062.00 (Weekly POC), 7060.50 (4-Hour).
Context: This is our first major reaction zone on a pullback. The Weekly POC at 7062 lines up beautifully with a 4-hour level at 7060.50, and directly above we have the naked 4-hour POC at 7070 and the untested 4-Hour at 7069 — which we were looking to play on Friday but never got. That one was left untested, and I still want it. The previous overnight low at 7076 sits right above, making the entire 7060.50 - 7076 band a prime first-reaction zone.
Actionable Setup: Buy Setup: If price plays the 7069 4-Hour, look for it to immediately get back above 7076 (previous overnight low) for our pop higher and a squeeze right back to the upside. This is the clean play I wanted Friday — if it sets up Monday, take it.
The Previous All-Time High Reclaim: 7037.50 - 7043.00
7043.00 (Previous All-Time High), 7037.50 (Tested Daily).
Context: This is a zone I am watching very carefully for a sweep play. Given the singles still left in the weekly profile just above the previous ATH, it would not surprise me at all to see a wick underneath this area, clean up those singles, play the previous all-time high at 7043, reclaim it, and squeeze back higher.
Actionable Setup: Sweep Setup: Look for a wick/sweep under 7043, reclaim back above, and target continuation higher. This is exactly the kind of play that pays when price is squeezing and just needs to shake out the last of the weak hands before resuming.
The First Favorite Buy: 7022.75
7022.75 (Daily).
Context: This is the spot I really like for our first meaningful buy. This Daily played from the underside on the way up, which gives us a reason to believe in it as a potential reaction point. I know it is only about 20 points away from the previous ATH, but if it plays and pushes back above 7043, we are going to continue squeezing even further.
Actionable Setup: Buy Setup: Look for 7022.75 to play and get back above 7043 for confirmation that the squeeze continues. Above 7043, we are right back in new-highs territory.
The 7022 to 7000 Zone: 7004.00 - 7008.00
7008.00 (4-Hour), 7004.00 (Weekly — uncertain tested/untested).
Context: This is the next major support spot and it has some really interesting structure. The 7004 Weekly is a level I cannot quite decide on — it shows tested on the RTH timeframe but untested on the ETH timeframe, so I would normally consider it untested, but given how things are setting up, it is going to be very important for us. It pairs with a 4-Hour level at 7008 right above, giving us a clean risk/reward lean on this zone. Importantly, this is also our Momentum Pivot — below this level, momentum shifts to the favor of the downside for at least a short-term move.
Actionable Setup: Buy Setup: Watch for 7008 to play and get back above 7022 for confirmation that buyers have stepped in. Lean on this level — the risk/reward is pretty clean here, and I would not count this area out at all.
Warning: A push below 7004 shifts momentum. It does not mean we crash, but the momentum certainly shifts to the favor of the downside, and the bears can take over at least for a short-term move. We also fill in the last weekly single below this zone.
The Prime Buy — Weekly/Daily Confluence: 6961.75 - 6966.50
6966.50 (Confirmation/Continuation Level), 6963.50 (Weekly — My Favorite), 6961.75 (Daily).
Context: This is my favorite spot on the entire map. The Weekly at 6963.50 and the Daily at 6961.75 form a powerful confluence, and this area also corresponds to our big leg down from earlier in the move. Every time we have moved lower into a subsection, we have had to start reclaiming levels to get back above stuff — and this is the zone where the bulls need to step in big if we make it this far. This is a prime buy.
Actionable Setup: Buy Setup: Look for 6961.75 to play or 6963.50 to play and immediately get back above 6966.50 — that gives us our continuation and our confirmation that buyers have stepped in. From there, we will be gunning for targets back up around 7000.
Warning: If we start to lose this zone, there is not much directly underneath — just one more weekly single and a daily that acts as another momentum pivot. Every time we push below a major area of support, reclaiming it becomes a larger accomplishment for the bulls. Respect the level.
The Deep Support Cluster: 6834.00 - 6883.00
6883.00 (Weekly), 6875.00 (Daily Continuation), 6834.00 (Daily — Last Leg Up / 4-Hour Confluence).
Context: This is our last line of structural support before the bullish thesis really starts to come into question. The 6883 Weekly is a fantastic spot if we get down there — we played it perfectly on the way up and I am sure everyone remembers that move. Below that, the 6875 Daily gives us continuation support, and then the 6834 Daily — which was the big push up from Sunday that created this beautiful leg — pairs with a 4-hour level perfectly. This whole area has serious support to buy.
Actionable Setup: Conditional Long: If price makes it all the way down into this zone, look for a reaction on first touch. The deeper we go, the stronger the buy — but also the more work the bulls have to do to get back above each major pivot. Lean on the levels, but require reclaims above the pivots for confirmation.
Warning: The further we pull back into this zone, the more the short-term momentum favors the downside. The broader bullish trend is not broken until these levels fail, but trading a pullback that deep requires patience and confirmation — do not front-run it.
📌 Cheat Sheet – Key Levels Recap
🧠 Final Thoughts
We just lived through a 99.7 percentile move since 1950, and the structural picture heading into the week of 4/20 could not be clearer: we have gained on all timeframes, flipped into Positive Gamma, and the chart is pointing up. There is no reason to believe this thing is going to spill and get absolutely murdered — we have massive support stacked underneath us, great solid weekly closes, and a bullish thesis that is fully intact. At the same time, the weekly TPO is full of inefficiencies, and if we move below 7152, I do expect us to come back in this week to clean some of that up — at least partially.
The plan is simple. Above 7152, we keep squeezing. Below 7152, we pullback into our buy zones — first reaction at the 7060.50 - 7076 Weekly POC cluster, then the 7022.75 first favorite buy with the 7043 previous ATH reclaim, then the 7004 Momentum Pivot that separates continuation from a real momentum shift, and finally my absolute favorite: the 6961.75 - 6963.50 Weekly/Daily prime buy with 6966.50 as the reclaim target. Keep an eye on VIX — as long as it stays below 19.00, the indices remain suppressed and we keep drifting higher, and watch for a first-touch reaction around 16.16 for a potential violent buying moment on the indices. The chart points up. Trade the chart. Let the pullbacks come to you, lean on the levels, and require reclaims above the pivots for confirmation. Patience pays here.
Don’t forget to sign up for the free SPX Edge Morning Brief — link is in the Substack post, Twitter, and Discord. Free to the first 500 subscribers. It is good stuff and I use it every single morning with my coffee.
📊 Introducing The SPX Brief: The Morning Edge I’ve Been Waiting to Give You
For years, I’ve started every trading day the same way.
Until next time—trade smart, stay prepared, and together we will conquer these markets!
Ryan Bailey, VICI Trading Solutions.
📊 TradingView Indicator String
Copy and paste the levels below into your S&P Edge Levels indicator to automatically plot today’s key levels on your chart:
7069.00|4HR|4H
7060.50|4HR|4H
7037.50|Tested D|TD
7022.75|D|D
7008.00|4HR|4H
7004.00|WK|W
6963.50|WK|W
6961.75|D|D
6883.00|WK|W
6875.00|D|D
6834.00|D|D
