Welcome back everyone — it is that time again. It is time for the Weekend Review, and I have to tell you, last week was absolutely amazing. We continue to have bangers back to back to back. For those of you in the Discord room, the post-market breakdowns, and the Substack — we have been slaying it, calling every turn and catching every nook and cranny. We are a privileged group, and I appreciate every single one of you riding with me on this journey. People are making serious money, getting serious payouts, and lives are getting changed. We are doing something together that no other group has done before — and we are just getting started. I have some great buy spots lined up for this week, so let’s get right into it. We will start with VIX, move to SPX, and then whittle our way down to ES. Keep it clean and simple — we are still traversing all-time highs, so we just need to talk about the levels we want to buy and where it all goes bad.
📧 IMPORTANT — Please Check Your Spam Folder I have been sending out follow-ups and touch-ups to all subscribers as well as everyone signed up for the SPX Edge AM Brief, and I can clearly see that many of these emails are not getting opened — they are landing in spam folders. Please take 30 seconds to check your spam/junk folder for emails from rbailey@vicitradingsolutions.com and info@vicitradingsolutions.com, mark them as “Not Spam,” and add them to your contacts so you keep receiving them in your inbox. There is valuable information in those emails — daily plan notifications, brief updates, and webinar reminders — and I want to make sure you are actually getting them. Do it now and you will thank yourself this week.
A Note on This Week’s Market:
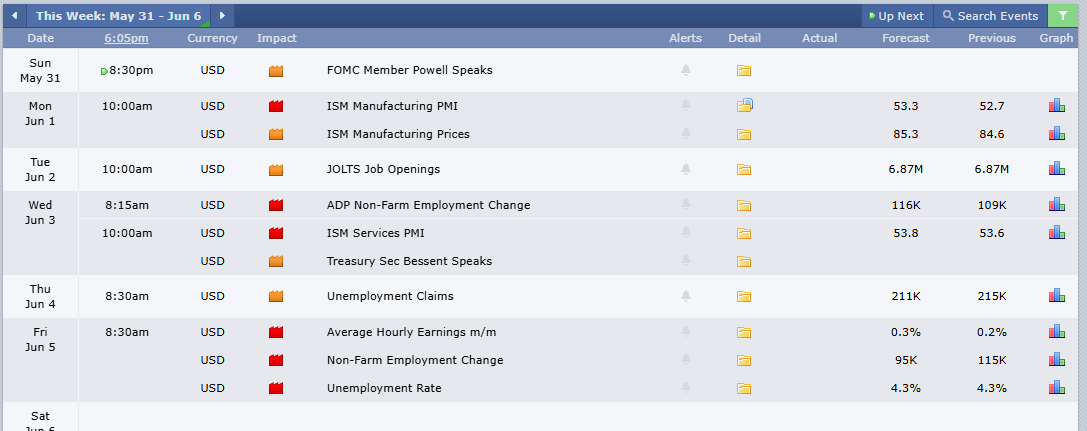
News: No specific Red Tag events on the immediate radar heading into the new week. Continue to monitor for any geopolitical or macro developments that could shake the open — anything can happen, especially with VIX this suppressed.
Volume & Timeframe Posture: We closed Friday extremely close to the all-time highs — within roughly 20 points — and we have not lost on the weekly, daily, four-hour, or even one-hour timeframes. That is rare structural air cover. Every timeframe currently agrees with the trend.
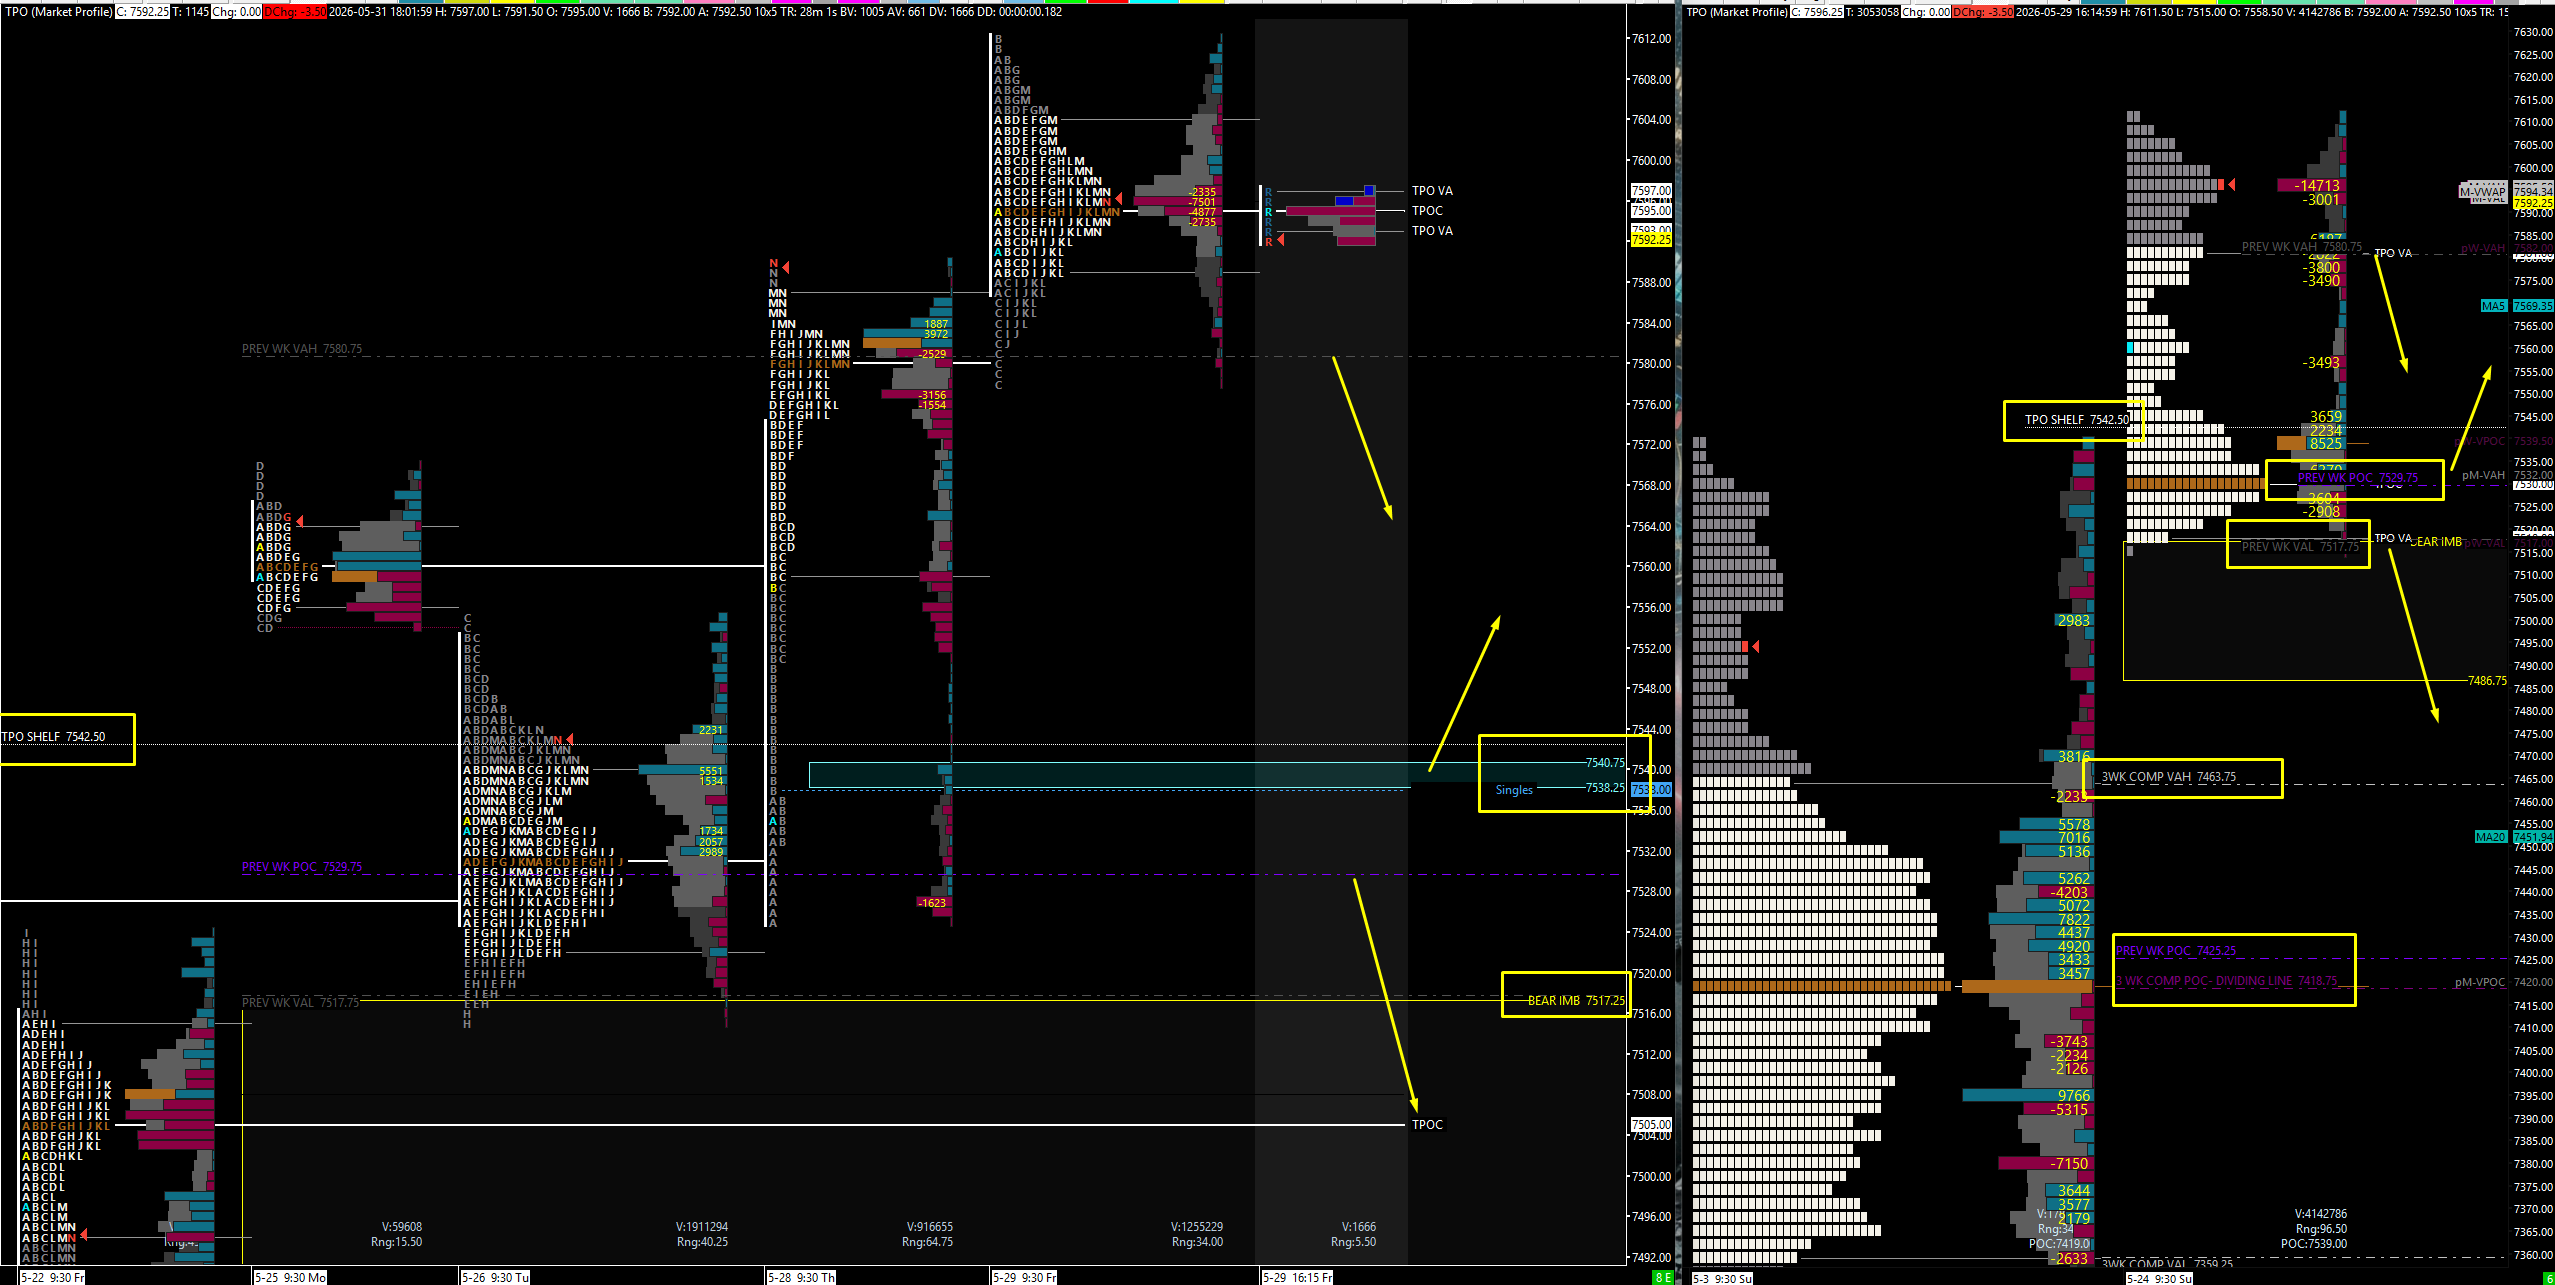
Range: The trend continues to grind higher with low volatility — we are now multiple green weeks deep and the squeeze just refuses to quit. The weekly TPO shows a clean three-week composite of overlapping value areas, with a notable bearish imbalance below that points down to 7486.75 for cleanup. There is also a daily TPO inefficiency with singles down to 7538 that needs to get filled at some point.
Gamma: Positive Gamma regime intact. Dealers continue hedging to the upside as we traverse all-time highs, which structurally supports the buy-the-dip thesis. This is a tailwind, not a headwind — at least until something breaks.
Trend: Buy the dip until the chart says otherwise. From a pure chart and technical standpoint, there is no reason to be looking short. That said — VIX is suppressed in the $15-$14 handle, and when it gets this low, sell-offs can be sharp and fast. We continue to favor longs at our spots, but we are not heroes — if a flush comes, we wait for the buy zones to set up.
Scheduled News
🧠 Current Market Context
The Three-Week Composite & The Dividing Line at 7418
We come into the week of June 1st surfing fresh all-time highs with every timeframe pointed up — weekly, daily, four-hour, and one-hour all in agreement, which is the cleanest structural posture you can ask for. The story on the high-timeframe profile is the three-week composite: I have merged the last three weeks of overlapping value areas into a single profile, and the standout observation is the dividing line at 7418 — the three-week composite point of control. Last week I showed you how dramatically the buyer-versus-seller dynamic shifts beneath that level, and that read remains unchanged this week. Above 7418, buyers are in firm control; below it, the buyers do not disappear, but they certainly are not running the show anymore. That dividing line aligns perfectly with the 7414 Tested Daily — the same daily that was insane resistance on the way up before they couldn’t break it and shot us to all-time highs. Now it sits tested, and underneath it, things get shady fast. Add to that a bearish imbalance in the current weekly profile — the value area high is established but the value area low is missing — pointing us toward 7486.75 as a natural cleanup target if rotation comes.
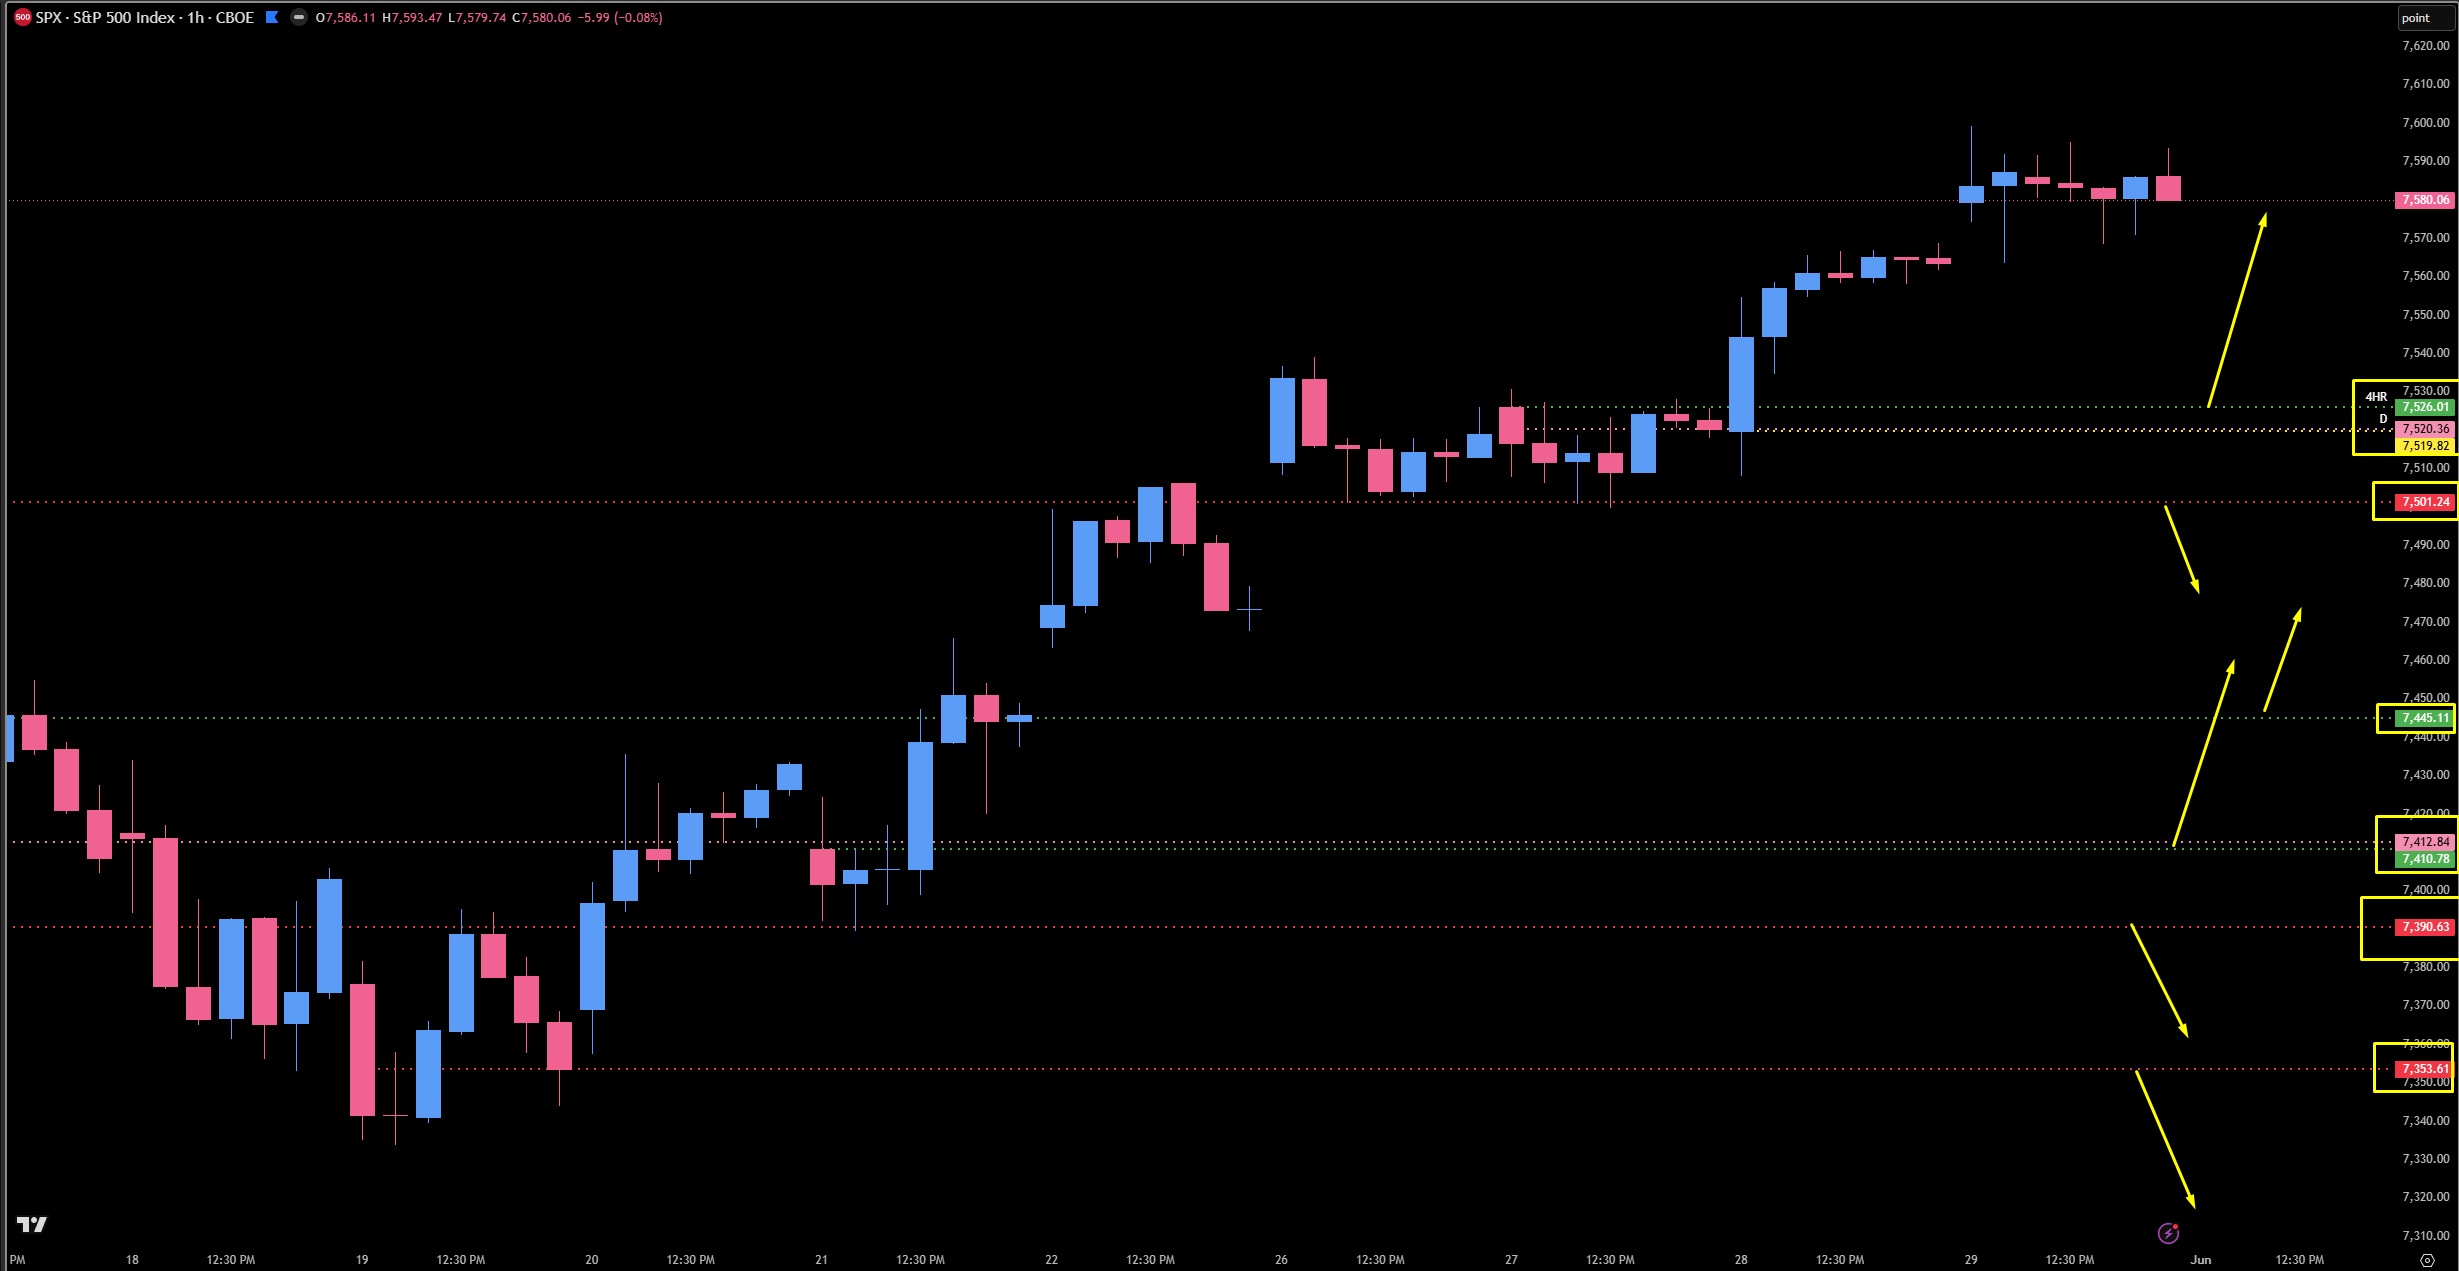
On SPX, the structure mirrors ES with two prime levels and one intermediate. The first major buy is the 7520-7526 zone — a beautiful confluence of the 4-Hour leg to the high, the 1-Hour leg at 7519, and the Daily at 7520. This is the buy that needs to hold if we are going to continue traversing all-time highs. If we lose it, we flirt with the 7501 Daily, which is extremely tested now (same level as ES 7527) and likely fails fast on the next visit. Below 7501, we have the intermediate 7445 4-Hour, which also fills a gap and cleans up a nice inefficiency. Then the big one: 7412 Daily paired with the 7410 4-Hour — the last untested daily leg-up in the massive valley that powered this entire rally. Want to see this play and get back above the 7416 wick for confirmation that buyers have stepped in, then we look for 7445 and higher. Below that, 7390 and 7356 are tested multiple times, and below 7353 we come down well over 230 points to the next real support. The cross-market confluence: SPX 7412 ≈ ES 7434.50 (last untested daily on both), and SPX 7520-7526 ≈ ES 7542. Watch them together.
🚨 VIX Analysis: The 14.95 Lower Pivot
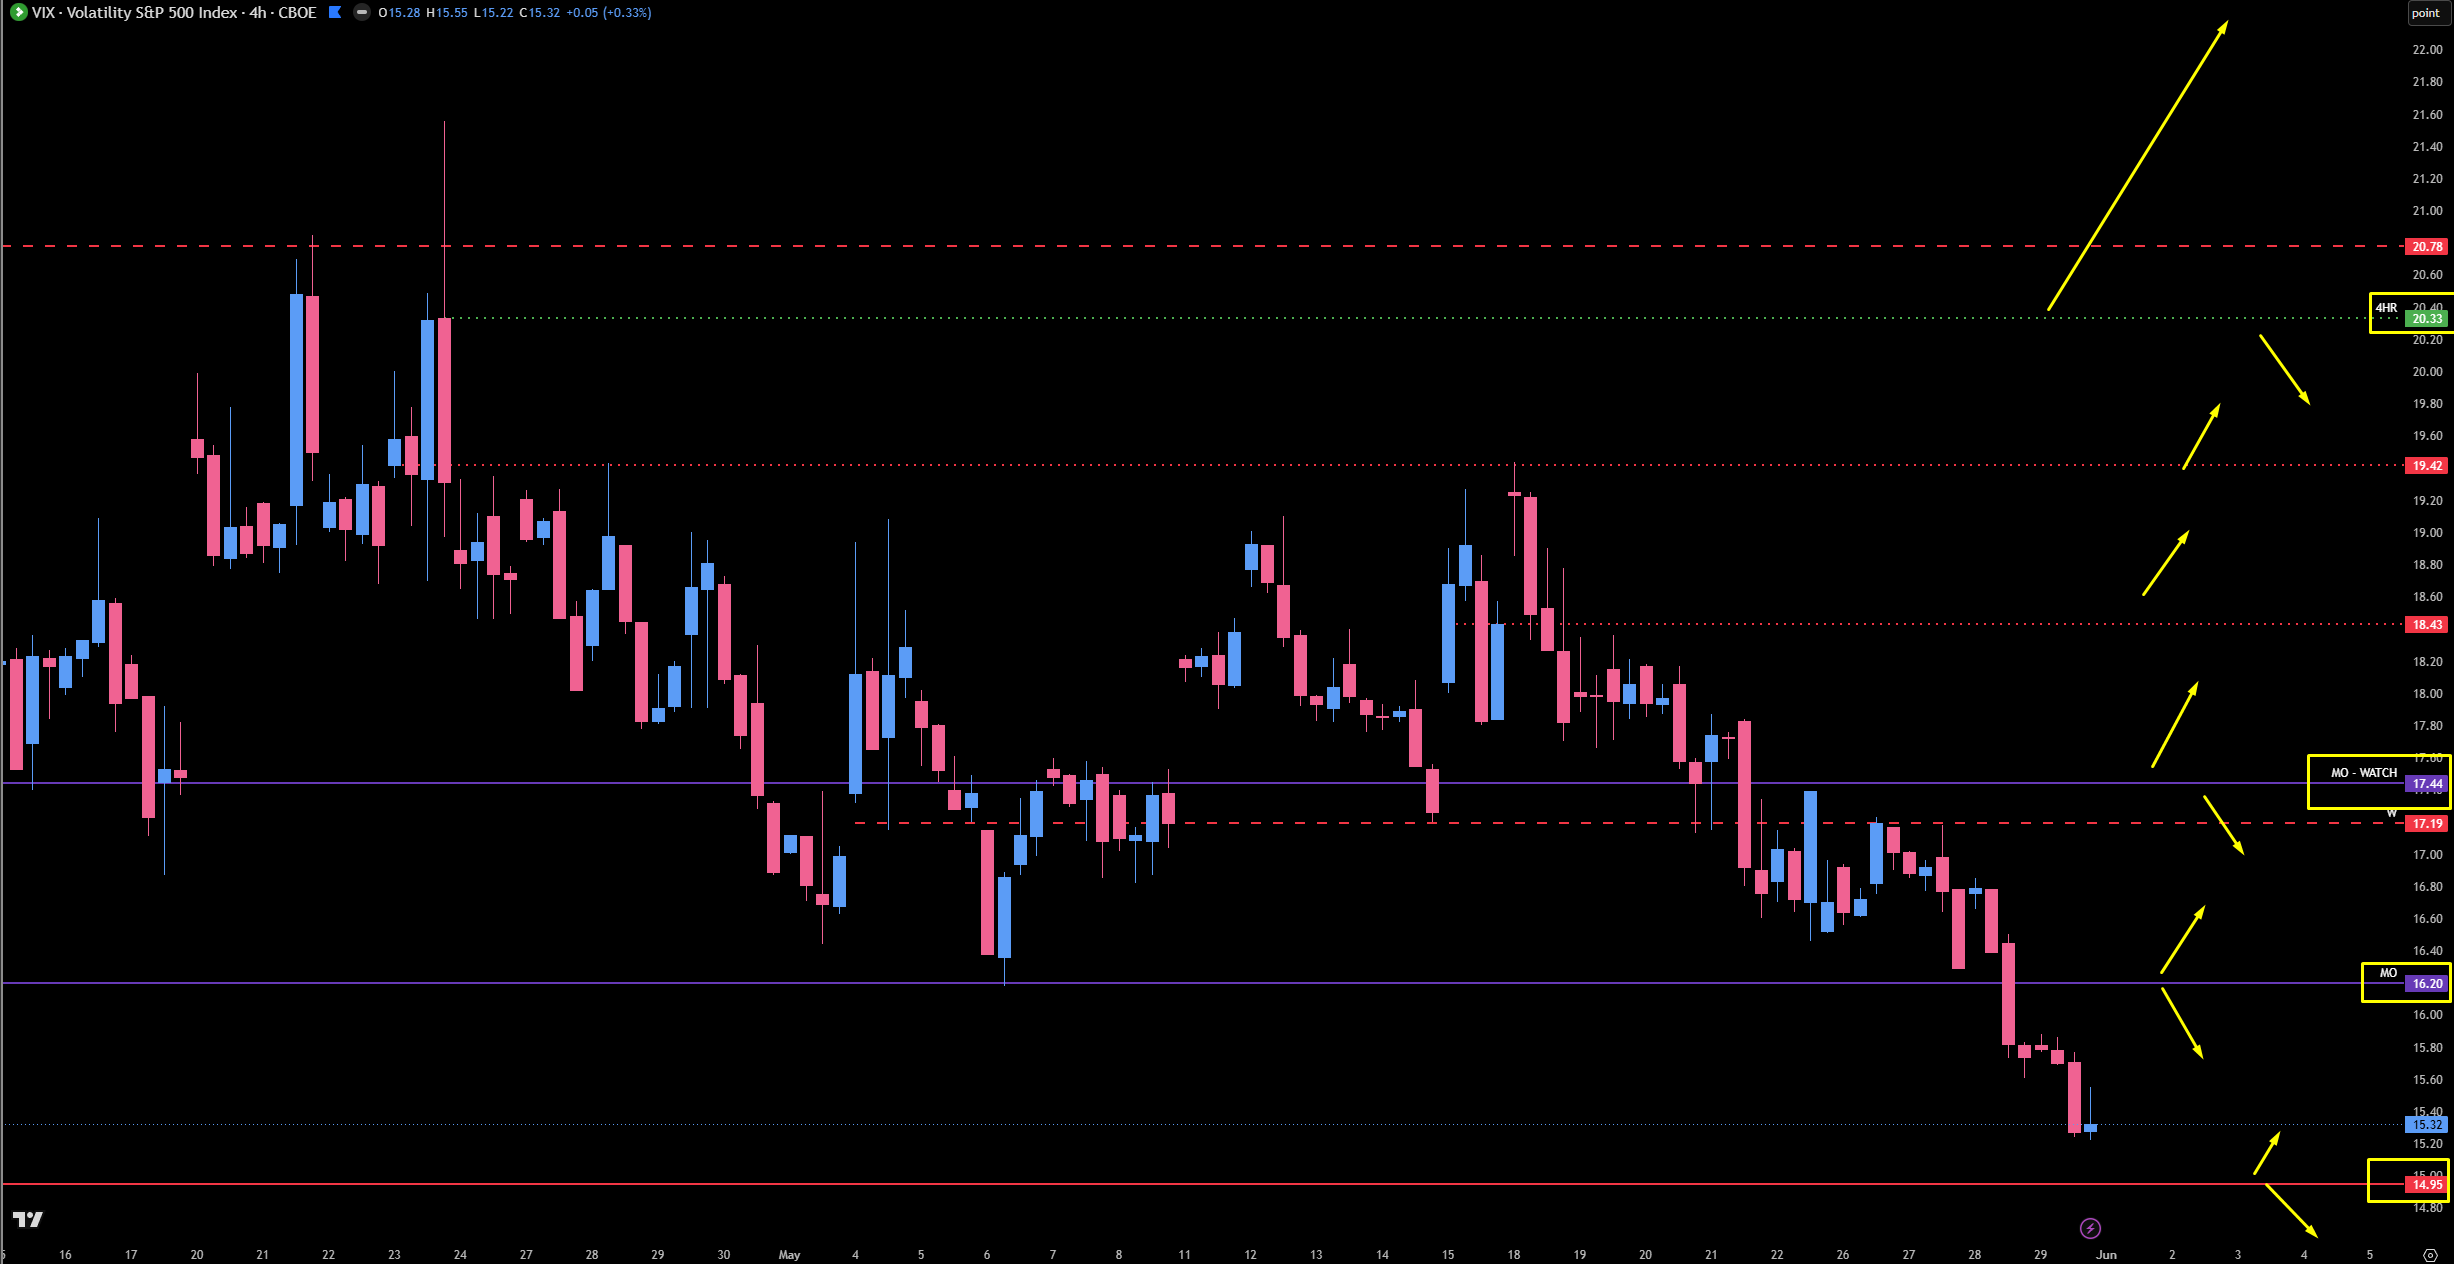
VIX has been absolutely getting beat down since the middle of May, reducing volatility in the air as the indices traverse all-time highs in a positive gamma regime. It is a nonstop game of buying support to push the highs, and based on VIX, it does not look like it is stopping anytime soon. However — every time we get into the $15-$14 handle, I put out a reminder, and I am putting it out again: be aware that we are down here. When VIX gets this suppressed, it is very sensitive to risk, and the squeezes can be brutal. I am not calling for a pop this week, but the conditions exist.
The Lower Pivot: 14.95 (Tested Monthly). This has been the big lower side cue I have been talking about for some time, and I do think it could get a reaction if we touch it. It is tested, so it may not provide a hard floor, but it is significant enough that I would not ignore it. Watch for above or below 14.95 if VIX comes down here. Below it, we stay suppressed and the indices stay afloat for more all-time high price discovery.
The Leg-In Tip: 13.60 (Untested Weekly). Way down there. If we get here, the indices should be extremely high (around 7700+) and we would be looking for rotation — this is an untested weekly that was left months and months ago, and it would likely produce a real reaction.
The First Resistance Above: 16.20 (Now Untested From The Bottom Up). As we roll into a new month and a new week, this pivot is now untested from the bottom up. It played excellent from the topside previously, so I would look for a potential reaction on first touch back up. As long as VIX stays below 16.20, we stay fairly suppressed.
The Next Major Hurdle: 17.44 (Monthly — Technically Untested). The previously tested monthly was a near-miss but technically remains untested as we roll into the new month. Cognizant — it could go either way on first touch. Above the 17.50s, we start to feel immediate suppression on the indices, which is the big above/below for the bigger picture.
The Tested Stack Above: 17.19 (Tested Weekly), 18.43 (Tested), 19.42 (Ceiling — Tested Multiple Times). All of this overhead has been played and tested. We would push through these on the way up — 20.33 (Untested 4-Hour) is the only untested resistance until we get all the way up into the $23-$24 handle, which is about a 30-40% pop from current. That kind of move would be a serious sell-off on the indices, but it is pure high-timeframe speculation right now. We stay in buy-the-dip mode.
🎯 Detailed Actionable Trade Plan (ES Futures)
We are playing the bullish thesis with disciplined buy zones below current price. The plan is clean and simple: above current ATH = continuation higher with no real overhead resistance worth charting. On a pullback, we work the ladder. The 7542 TPO confluence is the high-quality first major buy with multiple confluences. The dividing line is 7418 (three-week composite POC) paired with the 7414 Tested Daily — below that, things get shady and shady fast. The 7434.50 last untested daily right above the dividing line is the prime buy I would build a position around. Below 7414, stand aside and let the deeper zones prove themselves.
RTH Daily (ES):
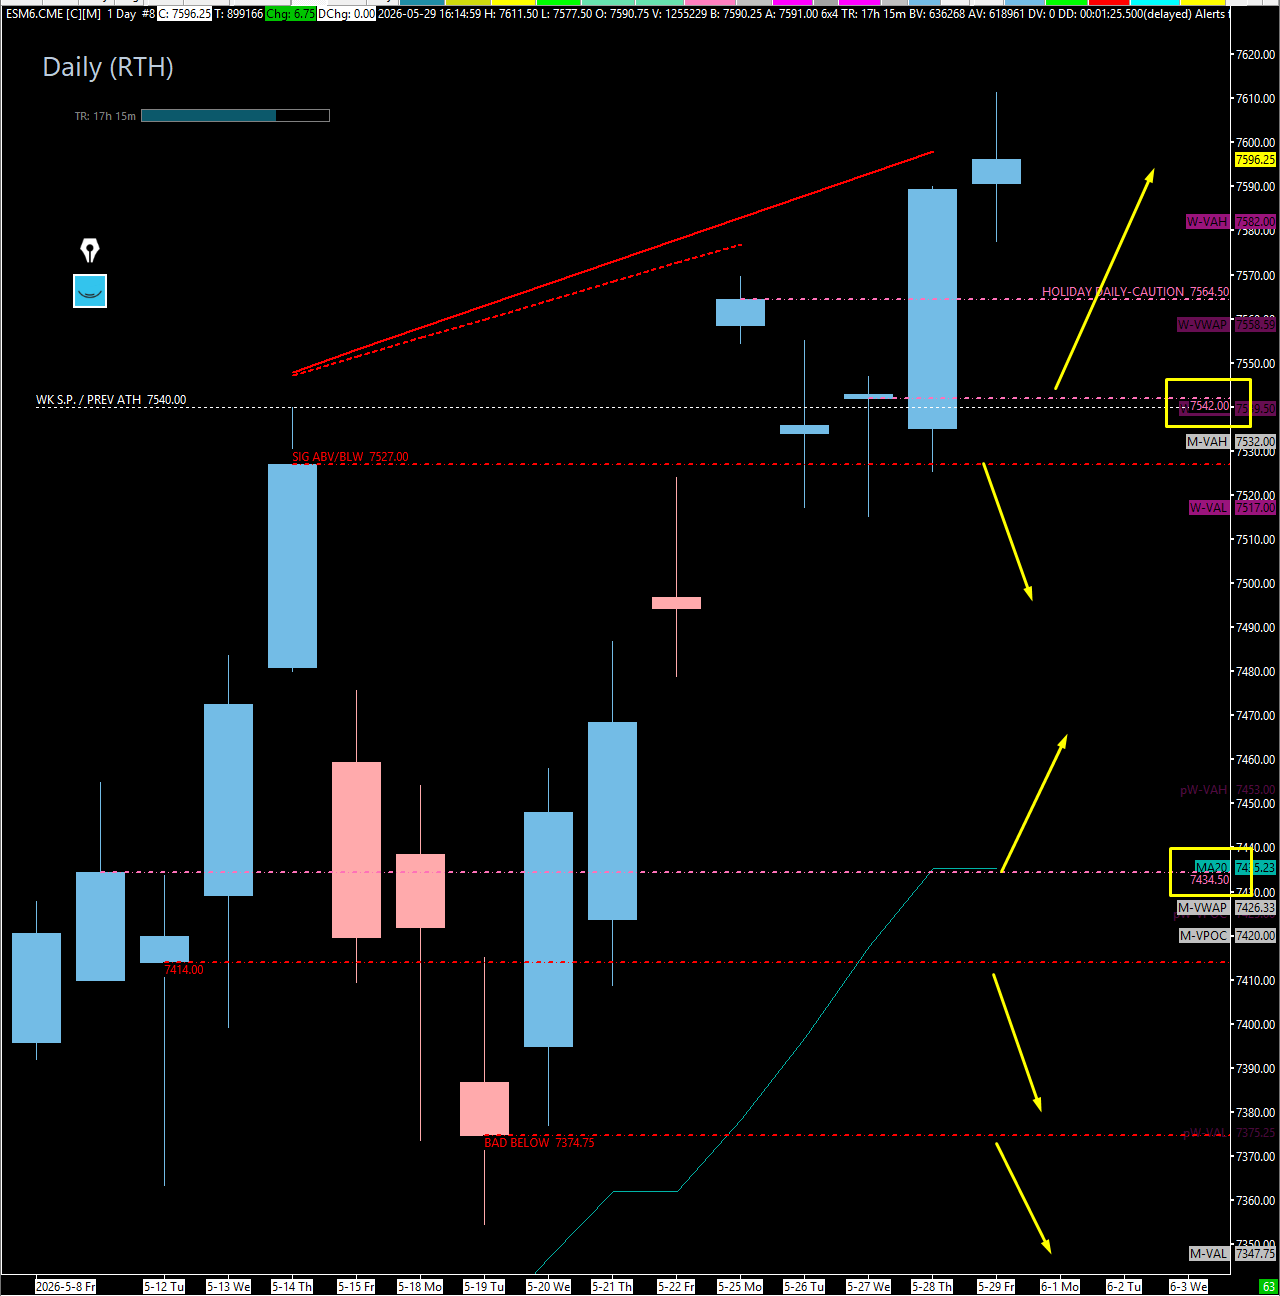
🔴 Key Resistance Zones & Setups
The All-Time High Gateway: 7580.00
7580.00 (Previous Weekly Value Area High).
Context: This is the previous week’s Value Area High and the reference for the upper end of recent acceptance. Above this, we are in fresh price discovery — there is no real untested high-timeframe resistance to speak of, and the path of least resistance remains higher in this Positive Gamma regime.
Actionable Setup: As long as price holds above 7580 and grinds higher, the buy-the-dip thesis is fully intact and we look for continuation. A loss of 7580 is the first sign rotation may be engaging — but it is not a short signal on its own.
🔵 Key Support Zones & Setups
The First Buy — 4HR & Weekly VWAP: 7557.50 - 7564.50
7564.50 (Daily — Holiday Created), 7557.50 (4-Hour + Weekly VWAP).
Context: The 7557.50 4-Hour is my first area to buy on a pullback, paired with the Weekly VWAP sitting right at the same spot. To be clear — it is not my favorite, just my first. The 7564.50 Daily right above is what I am using as the above/below trigger; I am willing to skip it as a long because it was created in the Memorial Day holiday gap and I have been burned too many times trusting holiday price action. I would rather miss this trade than play it blind.
Actionable Setup: Buy Setup: Look for 7557.50 to play, then watch for a reclaim back above 7564.50 to trigger long with continuation expected toward fresh highs. You can use the wick above for that quote-unquote acceptance confirmation if you want it. Below this zone, we work down to the bigger confluence below.
The TPO Confluence — Multi-Timeframe Buy: 7538.00 - 7543.75
7543.75 (4-Hour Leg to ATH / Last Daily in Segment to ATH), 7542.00 (Daily / TPO Shelf / Weekly Swing Pivot / Previous All-Time High), 7538.00 (Daily TPO Inefficiency & Singles Cleanup).
Context: I love this spot. This is one of the densest confluence zones on the entire board — the 7543.75 4-Hour was the last leg up to the current all-time high and also serves as the last daily in this segment, while 7542 layers in the TPO shelf, the previous all-time high, the weekly swing pivot high, and a daily level. On top of that, the daily TPO has inefficiencies and singles down to 7538 that need to get cleaned up — when price visits this zone, it will more than likely get a reaction.
Actionable Setup: Buy Setup: If price is going to resume traversing all-time highs, I want to see this area play and get back above 7557 for confirmation. That should take us right back into price discovery mode. This is the high-quality first major buy.
Warning: If price pushes lower than this confluence, she is in trouble. Losing 7542 opens the door to the lower buy zones, and the bias gets more cautious until we reclaim.
The Dividing Line — Previous Weekly POC: 7527.00 - 7529.00
7529.00 (Previous Weekly Point of Control — Untested), 7527.00 (Tested Daily — Same as SPX 7501).
Context: This is structurally critical. The 7529 Previous Weekly POC is currently untested and serves as a dividing line — above it, value is being accepted; below it, the structure rotates lower toward the bearish imbalance fill. The 7527 Tested Daily sits just below and is the same level as SPX 7501. They played 7527 on Thursday and it took us right back to the all-time high — proven structure, but now tested.
Actionable Setup: Hold 7527-7529 and we maintain the all-time high posture. Below 7527, we have a problem — the 7510 last 4-Hour leg becomes the next candidate, but I doubt a reclaim of either 7527 or 7542 holds at that point. We drift toward the bearish imbalance.
Warning: Below 7527, shit gets shady — and it gets shady real quick. Treat this as the structural pivot for the entire week.
The Last 4-Hour Leg to High: 7510.00 - 7519.25
7519.25 (1-Hour), 7510.00 (Last 4-Hour Leg to All-Time High).
Context: This is the last 4-Hour leg that took us to the all-time high. I do not love it being underneath 7543, but it is genuinely untested and structurally important. The 7519.25 1-Hour sits right above as a stepping stone.
Actionable Setup: Buy Setup: I may take this for a long — want to see it play, get back above the 7515 area to trigger, and take profits around 7543. Tight risk, clean target.
The Bearish Imbalance Fill: 7486.75
7486.75 (Three-Week Composite Bearish Imbalance Target).
Context: The current weekly profile has a value area high established but is missing a clean value area low — a bearish imbalance. This points price down toward 7486.75 as the natural cleanup target. It does not have to come here, but if the upper zones fail, this is the bearish imbalance fill.
Actionable Setup: Use this as a magnet/target reference if rotation engages. Not a primary buy zone, but a structural completion point.
The Sleeper — Sellers Stuffed Sweep: 7463.00 - 7478.00
7478.00 (Reclaim Trigger), 7474.00 (1-Hour), 7463.00 (Three-Week Composite VAH / Sellers Stuffed).
Context: This is the sleeper spot — a small-timeframe play that I am not overly excited about, but the structure is interesting. We have trapped sellers stuffed at 7463 at the three-week composite VAH, which I called out last week. If price comes down and plays this area for a reaction, those trapped sellers provide fuel for a reclaim squeeze back up. The 7474 1-Hour sits as a step in the ladder.
Actionable Setup: Sweep Setup: Watch for 7463 to play with a reaction, then a reclaim of 7478 could squeeze us back higher for the temporary time being. Not a high-confidence trade, but it is on the radar.
The Decent Spot — 4-Hour: 7450.00
7450.00 (4-Hour — Played From the Bottom Up).
Context: This is a decent spot — a good 4-Hour with lots of support played from the bottom up on the way to the current highs. From the topside, it should more than likely get a pretty solid reaction.
Actionable Setup: Buy Setup: Look for reaction on first touch. Not my favorite, but reliable enough to play with disciplined risk.
PRIME BUY — Major Confluence & The Dividing Line: 7414.00 - 7434.50
7434.50 (Last Untested Daily), 7432.50 (4-Hour), 7426.75 (1-Hour), 7425.00 (Previous Weekly POC — From Two Weeks Ago, Untested), 7418.00 (Three-Week Composite POC — Dividing Line), 7414.00 (Tested Daily — Formerly Insane Resistance).
Context: This is my favorite zone on the entire board. The 7434.50 Daily is the last untested daily leg-up in this entire move to all-time highs — same structural concept as SPX 7412. Stacked beneath it: the 7432.50 4-Hour, the 7426.75 1-Hour, the 7425 Previous Weekly POC from two weeks ago (still untested), and the 7418 Three-Week Composite POC — the dividing line between bulls in control and bulls losing control. The 7414 Tested Daily anchors the bottom of this confluence; it was insane resistance on the way up before they shot us through it. All of this is held up by daily/4-hour/1-hour/TPO confluence with the moving averages and Weekly VWAP in the area as well.
Actionable Setup: Buy Setup: Play the 7434.50 / 7432.50 area, reclaim 7450, and then reclaim the three-week composite VAH — this could send us all the way back to 7527 if not higher. This is the prime buy. If you take one trade this week, take this one when it sets up.
Warning: Underneath 7414, things get shady and they get shady fast. This is the big support — we lose the buyers below the composite POC dividing line, and the structure cracks meaningfully. Guard up below.
The Final Untested 4-Hour: 7364.00 - 7374.00
7374.00 (Reclaim Trigger), 7364.00 (Untested 4-Hour).
Context: I do not really love this spot, but it is technically untested so I am including it. Below 7414, this is the next genuine support reference on the four-hour, with 7374 as the reclaim trigger above.
Actionable Setup: Conditional Long: If price reaches 7364, watch for it to play and get back above 7374 for continuation before engaging. Take major profits around the 7414 area on the first push back up, with runners targeting the 7432 area.
Warning: Below this 4-Hour, things continue to get dicey all the way down to the 7301 weekly gap fill. We address that in real-time if it develops — but it is not on the immediate radar this week.
📌 Cheat Sheet – Key Levels Recap
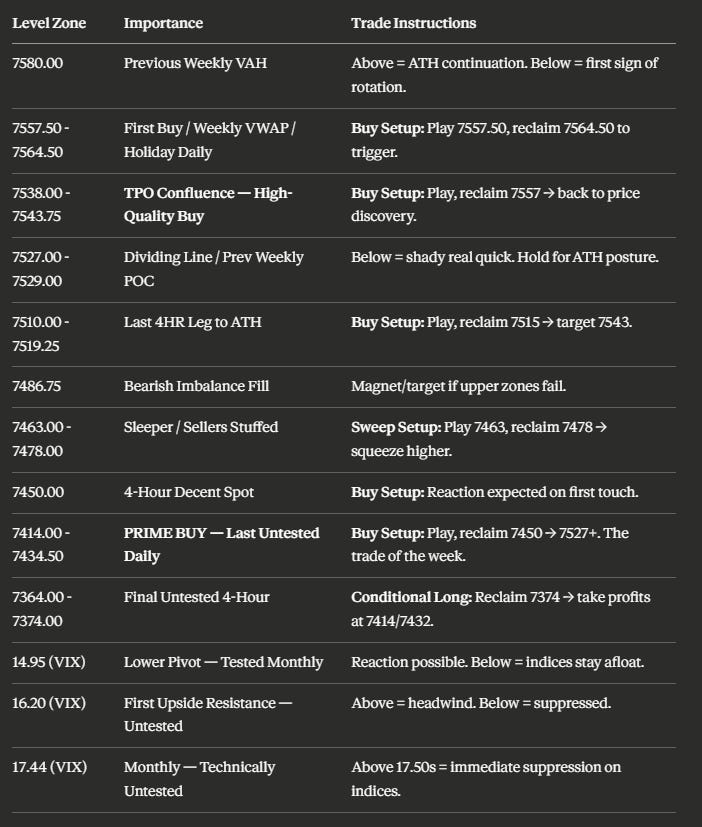
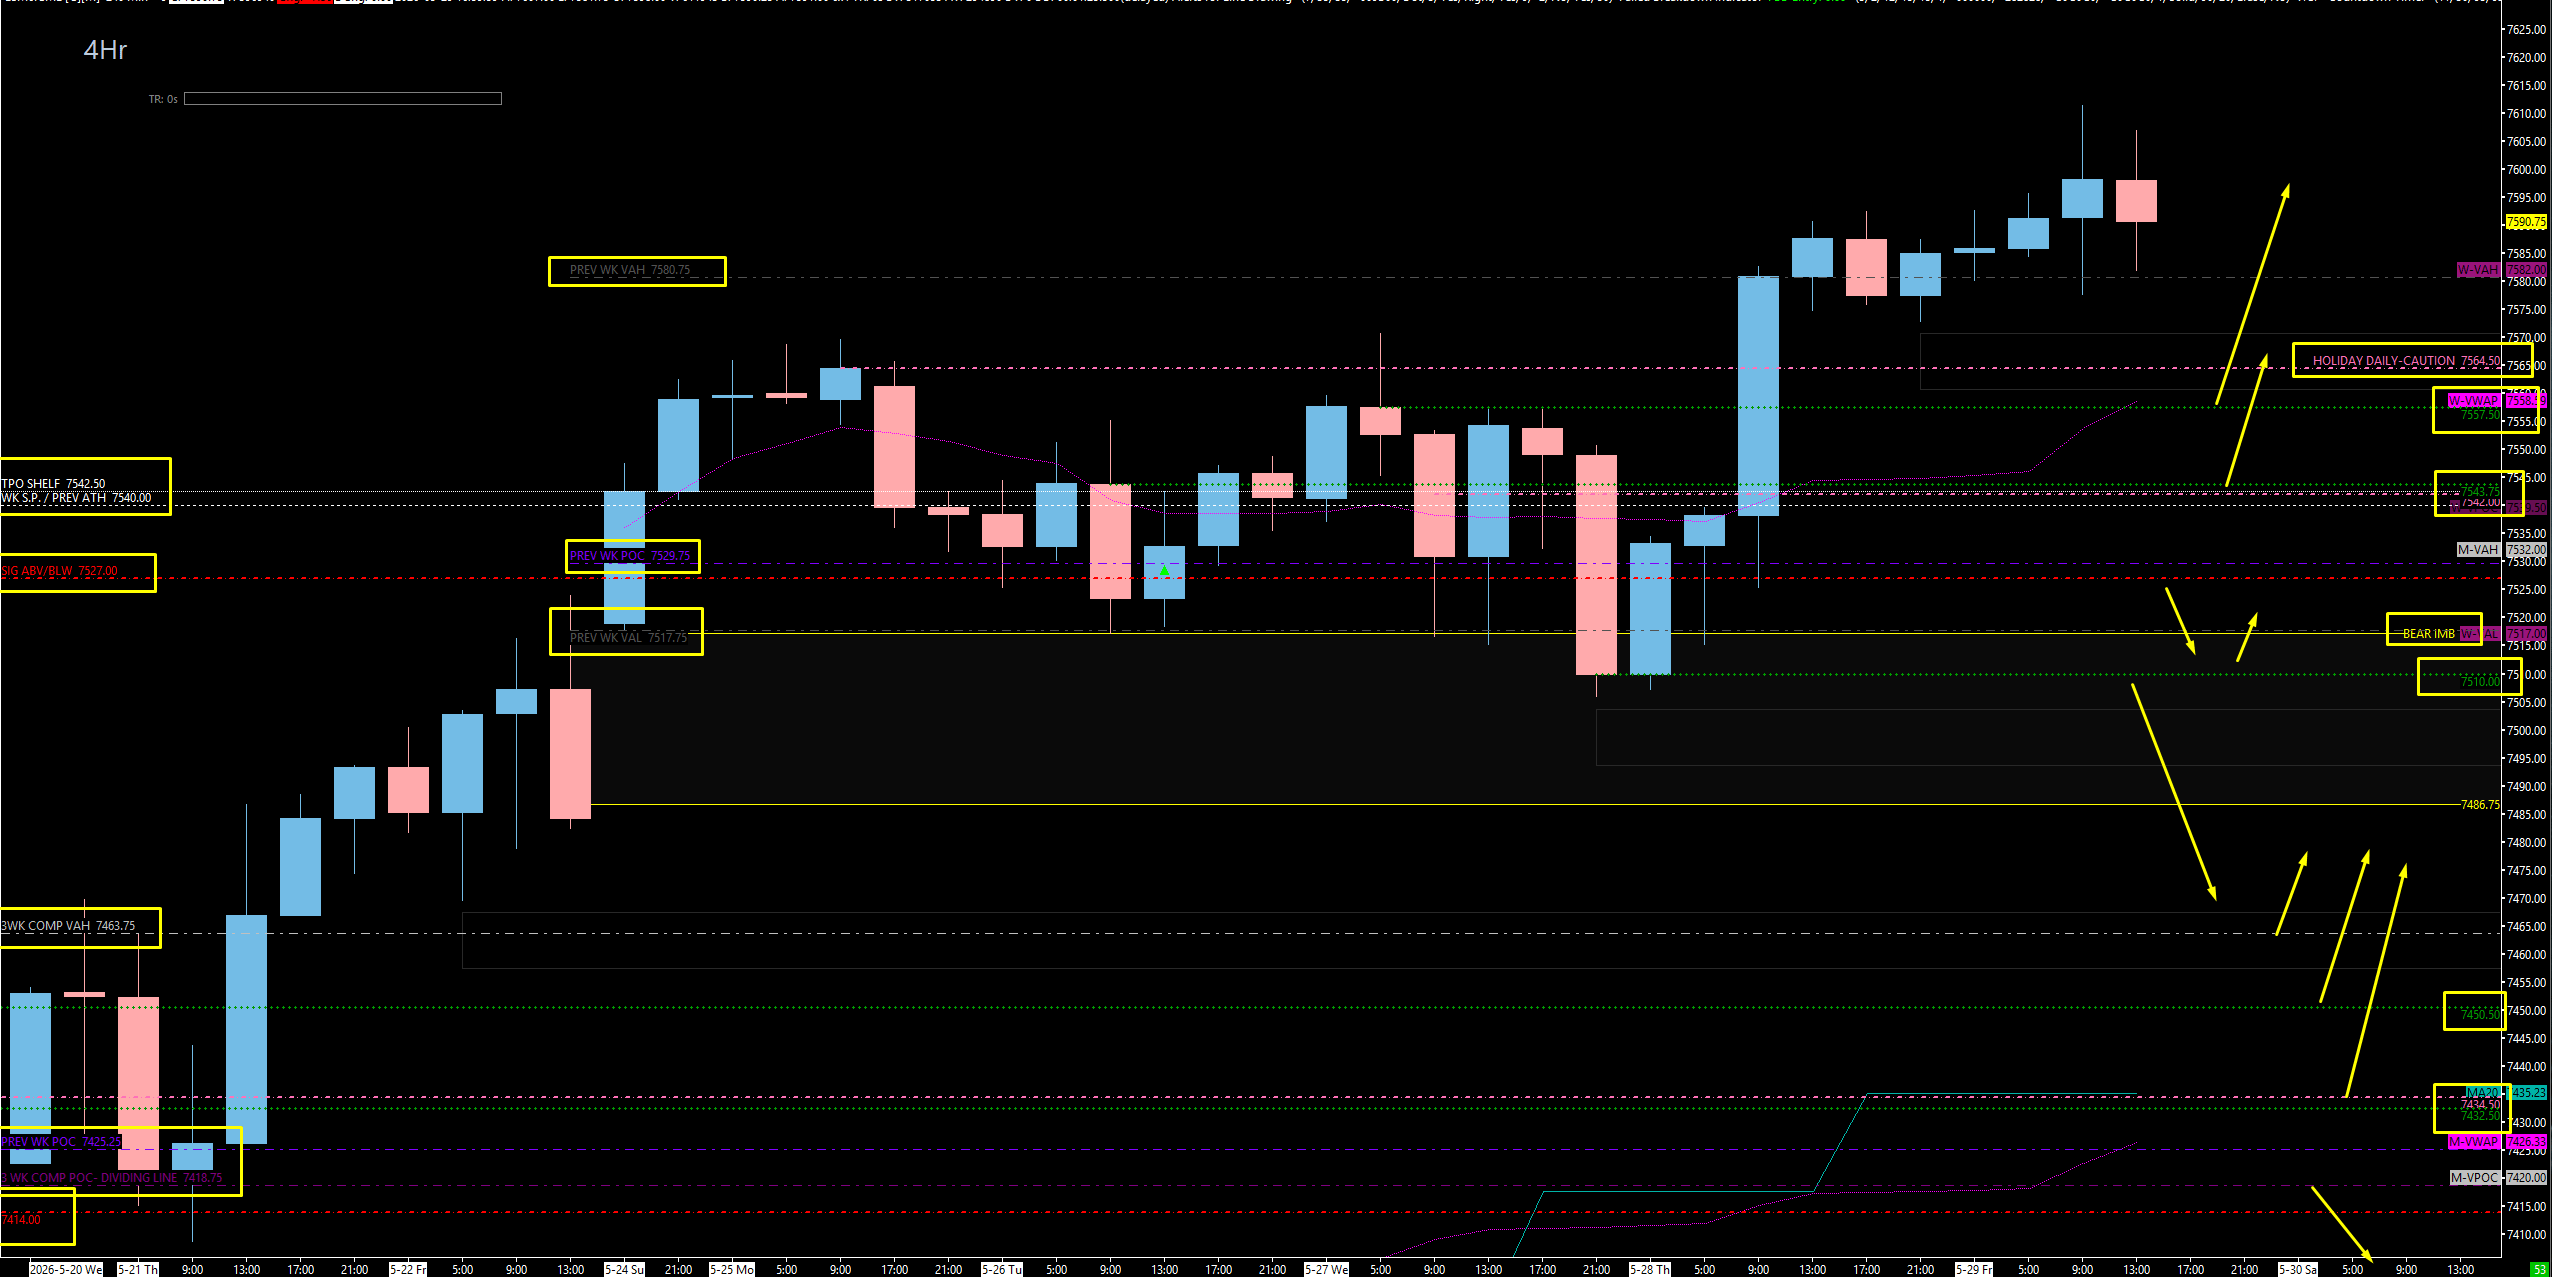
4hr Overlay ES:
🧠 Final Thoughts
The picture coming into the week of June 1st could not be cleaner: we are up on every timeframe, in a Positive Gamma regime, and we have a buy ladder full of high-quality confluence spots. If you do not take any other trades this week, focus on these. The 7542 TPO confluence is your first major buy — multi-timeframe, TPO shelf, previous ATH, weekly swing pivot all stacked at the same price. The 7434.50 last untested daily anchored by the 7418 three-week composite dividing line is the prime buy — that is the trade I will be sizing up if and when it sets up. These are high-probability, daily/four-hour confluence with TPO backing them up. They are worth waiting on.
Be patient. Be careful. We are cruising all-time highs with no chart-based reason to come down anytime soon — but VIX is low, and when VIX is this suppressed, knee-jerk reactions can be violent. If this thing starts to sell, do not be a hero and do not try to catch it. Use the 7527 dividing line and the 7414 tested daily as your structural gates. Above the gates, we buy the dips. Below them, we wait. Use VIX 14.95 as the lower barometer and 16.20 as the upside warning — that combination tells you when the relief regime is ending.
Don’t forget to join me tomorrow at 5 PM EST for the post-market breakdown — live on X, YouTube, and Substack doing our thing. We are going to have another fantastic week in the Discord room and on the streams. Enjoy the rest of your Sunday, stay patient, and let’s go.
Until next time—trade smart, stay prepared, and together we will conquer these markets!
Ryan Bailey, VICI Trading Solutions.
📊 TradingView Indicator String
Copy and paste the levels below into your S&P Edge Levels indicator to automatically plot today’s key levels on your chart:
7580.00|P.W. VAH|GD
7564.50|D|D
7557.50|4HR|4H
7543.75|4HR|4H
7542.00|D|D
7527.00|Tested D|TD
7519.25|1HR|1H
7517.00|P.W. VAL|GD
7510.00|4HR|4H
7474.00|1HR|1H
7450.00|4HR|4H
7434.50|D|D
7432.50|4HR|4H
7426.75|1HR|1H
7414.00|Tested D|TD
7364.00|4HR|4H
Daily Weekly TPO: