S&P 500 Weekend Review: The Bearish Balance & The 7412 Sweep Reclaim
A detailed ES, SPX & VIX plan for the week of July 27th, breaking down the 7507 first short spot, the 7412 monster weekly sweep, and the VIX 17.44 midpoint pivot.
Top of the morning, everyone, and happy Weekend Review. It is Sunday and it is that time again — and we had a ridiculous week last week. We literally called the high of the week at 7560, and that brought us all the way down to 7412, which we pinpointed as our low. We basically caught the top, the bottom, and all the progression in between. It was absolutely unbelievable. I personally put up insane points in the room, but honestly, the people in the room are annihilating it — they are making me look bad. It is that whole Daniel-san, Mr. Miyagi thing: they are getting their wax on, and it is really showing. If you watched the post-market breakdowns through the week and checked the scoreboard, it is unbelievable what the Inner Circle is doing. Congratulations to everyone putting up the hits — and we are going to do it again this week.
We find ourselves still in the middle of a massive balance. I know we had this big move down, which is certainly leading us lower, and you guys know I have been on this for a couple weeks now — I still believe we can go lower. However, that does not mean we cannot squeeze higher first. We have some significant above/below levels to pay attention to, so let’s take a look at VIX, SPX, and then ES, and wrap this thing up so we can go enjoy the day.
☕ FREE RESOURCE — The SPX Morning Brief | Delivered 6:45 AM EST Take advantage of this. Every morning at 6:45 AM EST, the SPX Morning Brief hits your inbox with everything you need to understand the significant value levels on SPX, over 150 indicator prediction assessments, and the top 5 news articles of the day. It is a fast read that gets you fully prepared before the bell. It is free — all I ask is that you let me into your inbox. Sign up now →
News: I do not believe there are any crazy geopolitical headlines on the rise, but I could be wrong — I have been a little out of touch this weekend. We will see where we open Sunday evening, so monitor the open before committing to anything.
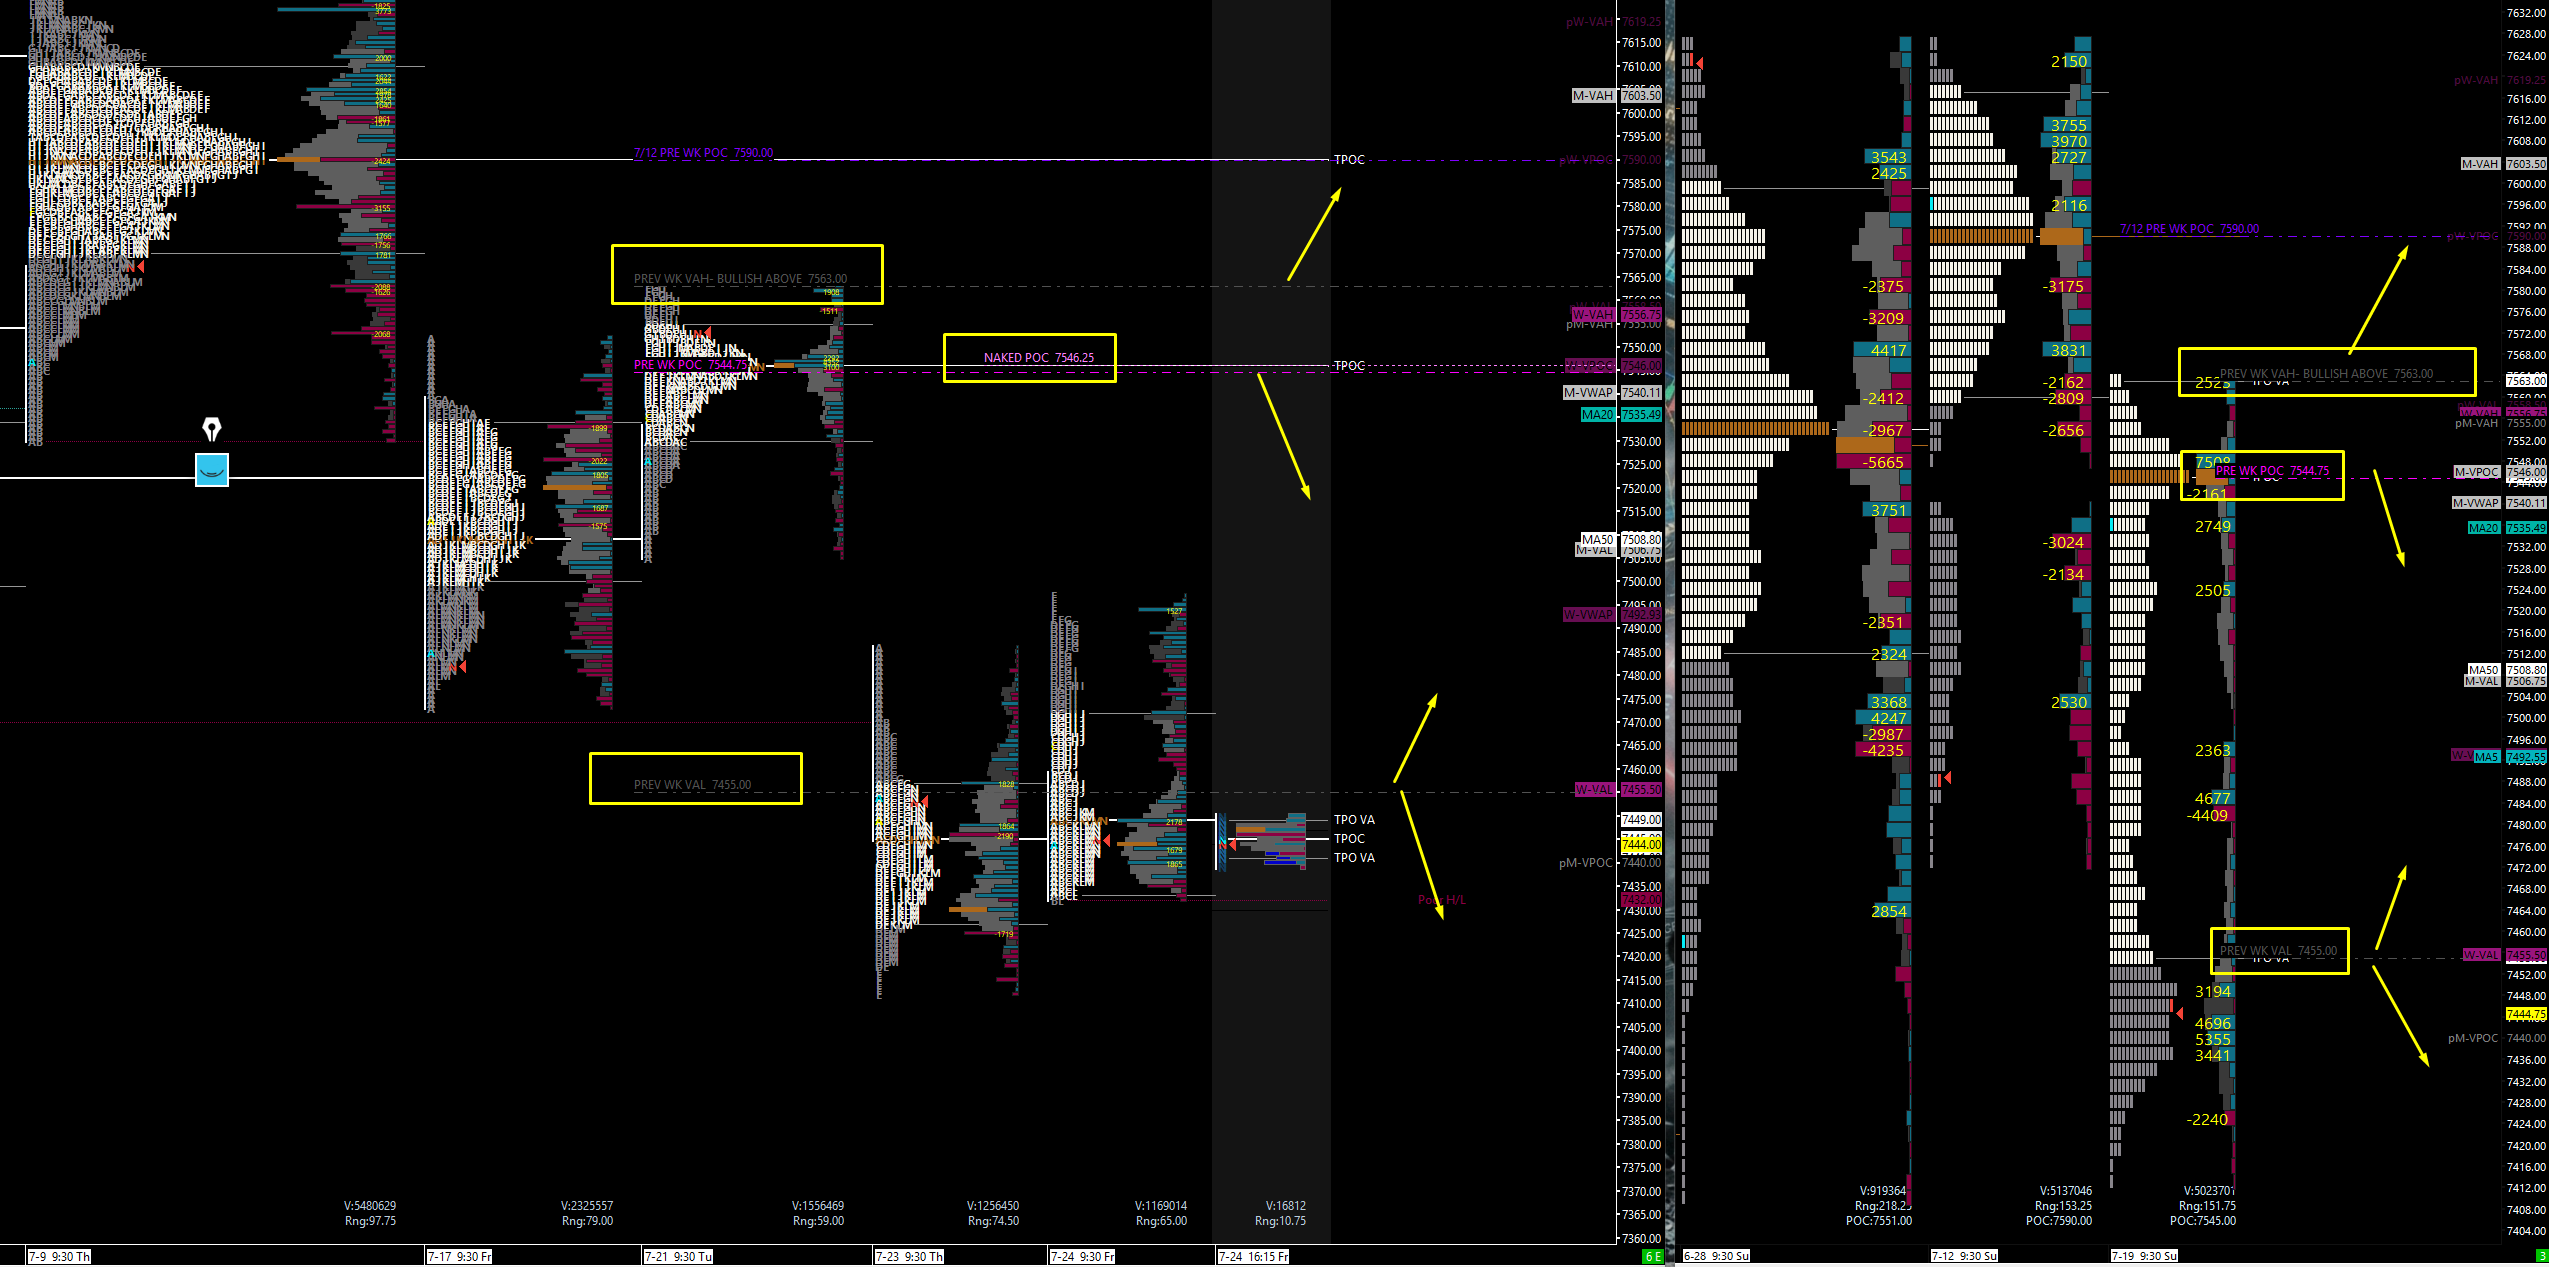
Positioning: Friday’s move down left some very useful trapped liquidity above us. They trapped roughly 2,400 buyers up at the 7489.75 one-hour and another 1,800 to 2,000 buyers just beneath it, and up at the highs they trapped a staggering 4,600 buyers. Those pockets are fuel — when price comes back up into them, we should get an inverse reaction, which is exactly what we want for our shorts.
Range: We are still in a multi-week balance. Friday’s close finally got us outside of last week’s range, but looking across the weekly TPO, we are not out of it yet. There is a TPO area down at 7313.75 that I think we can target — it is about 120 to 130 points from here, but I do foresee us coming down to clean it up.
Gamma: We are in Negative Gamma. We will more than likely get rotations in both directions, because that is what we do in this regime — we balance, find the inefficiencies, and fill them. That means expanded ranges and expanded volatility, so be aware of it.
Trend:Down on all timeframes except the weekly, which is in balance. We are down on the daily, the four-hour, and the one-hour — and this applies to both SPX and ES. Technically speaking, our process says do not buy. We are only looking for shorts. Take the longs where you can get them, but know they will be muted, take your profits, and do not expect crazy runners. Our process has not proven us wrong this far.
🧠 Current Market Context
The Multi-Week Balance & What Losing Levels Looks Like
Here is the honest structural read: we are still in the middle of a massive balance. I know it did not feel that way after the big move down, but the weekly TPO shows it plainly — other than finally closing outside last week’s range, we have been drifting sideways for weeks and we are not out of the woods yet. That is why we lean on the structure. My process is pointed down on the daily, four-hour, and one-hour, with only the weekly still in balance, and it has not proven us wrong so far. Of course we are going to get squeezes — I call them bear market squeezes even though we are not in a bear market — but as long as you pay attention to the lines we are above and below, every pop right now is smackable.
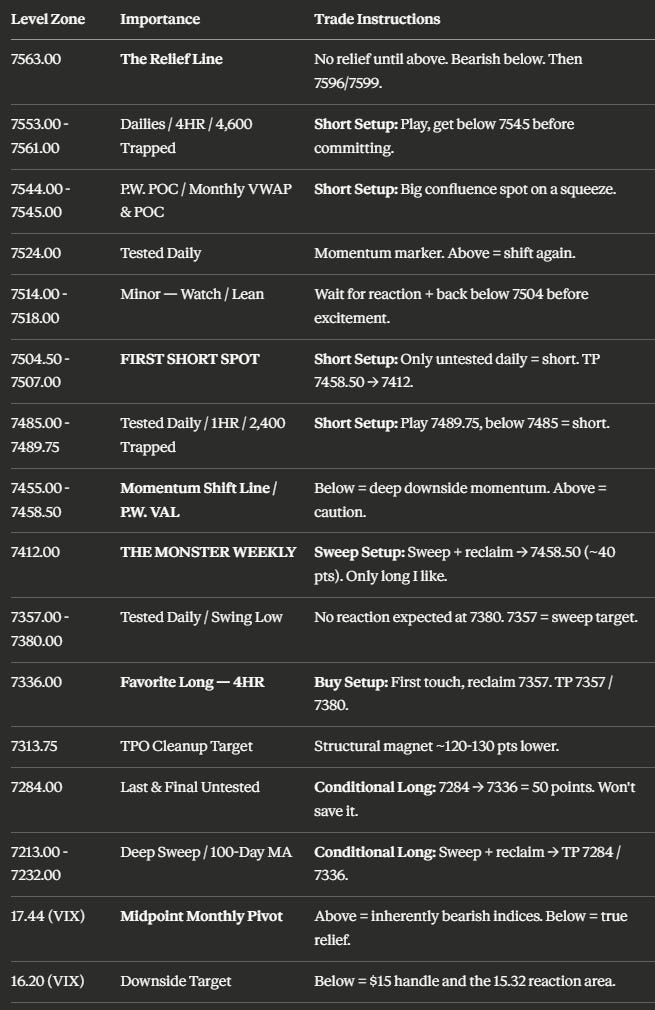
Let me describe the pattern we are living in, because it explains the entire week ahead. We stay up in a range, then we lose a level. We pop back up and smack the level we just lost. We cannot get back above it — so now we smack, and we come down to the next level. We lose another level, they pop us up again, and we are still below all of it. That is what it looks like to lose levels, and that is exactly the sequence we are trading. Each of these overhead zones is now a resistance zone rather than support: 7455-7458.50, then 7485-7489.75, then 7504.50-7507, then 7524, then 7544-7545, then 7553-7561. Walk down the ladder and you can see the whole story.
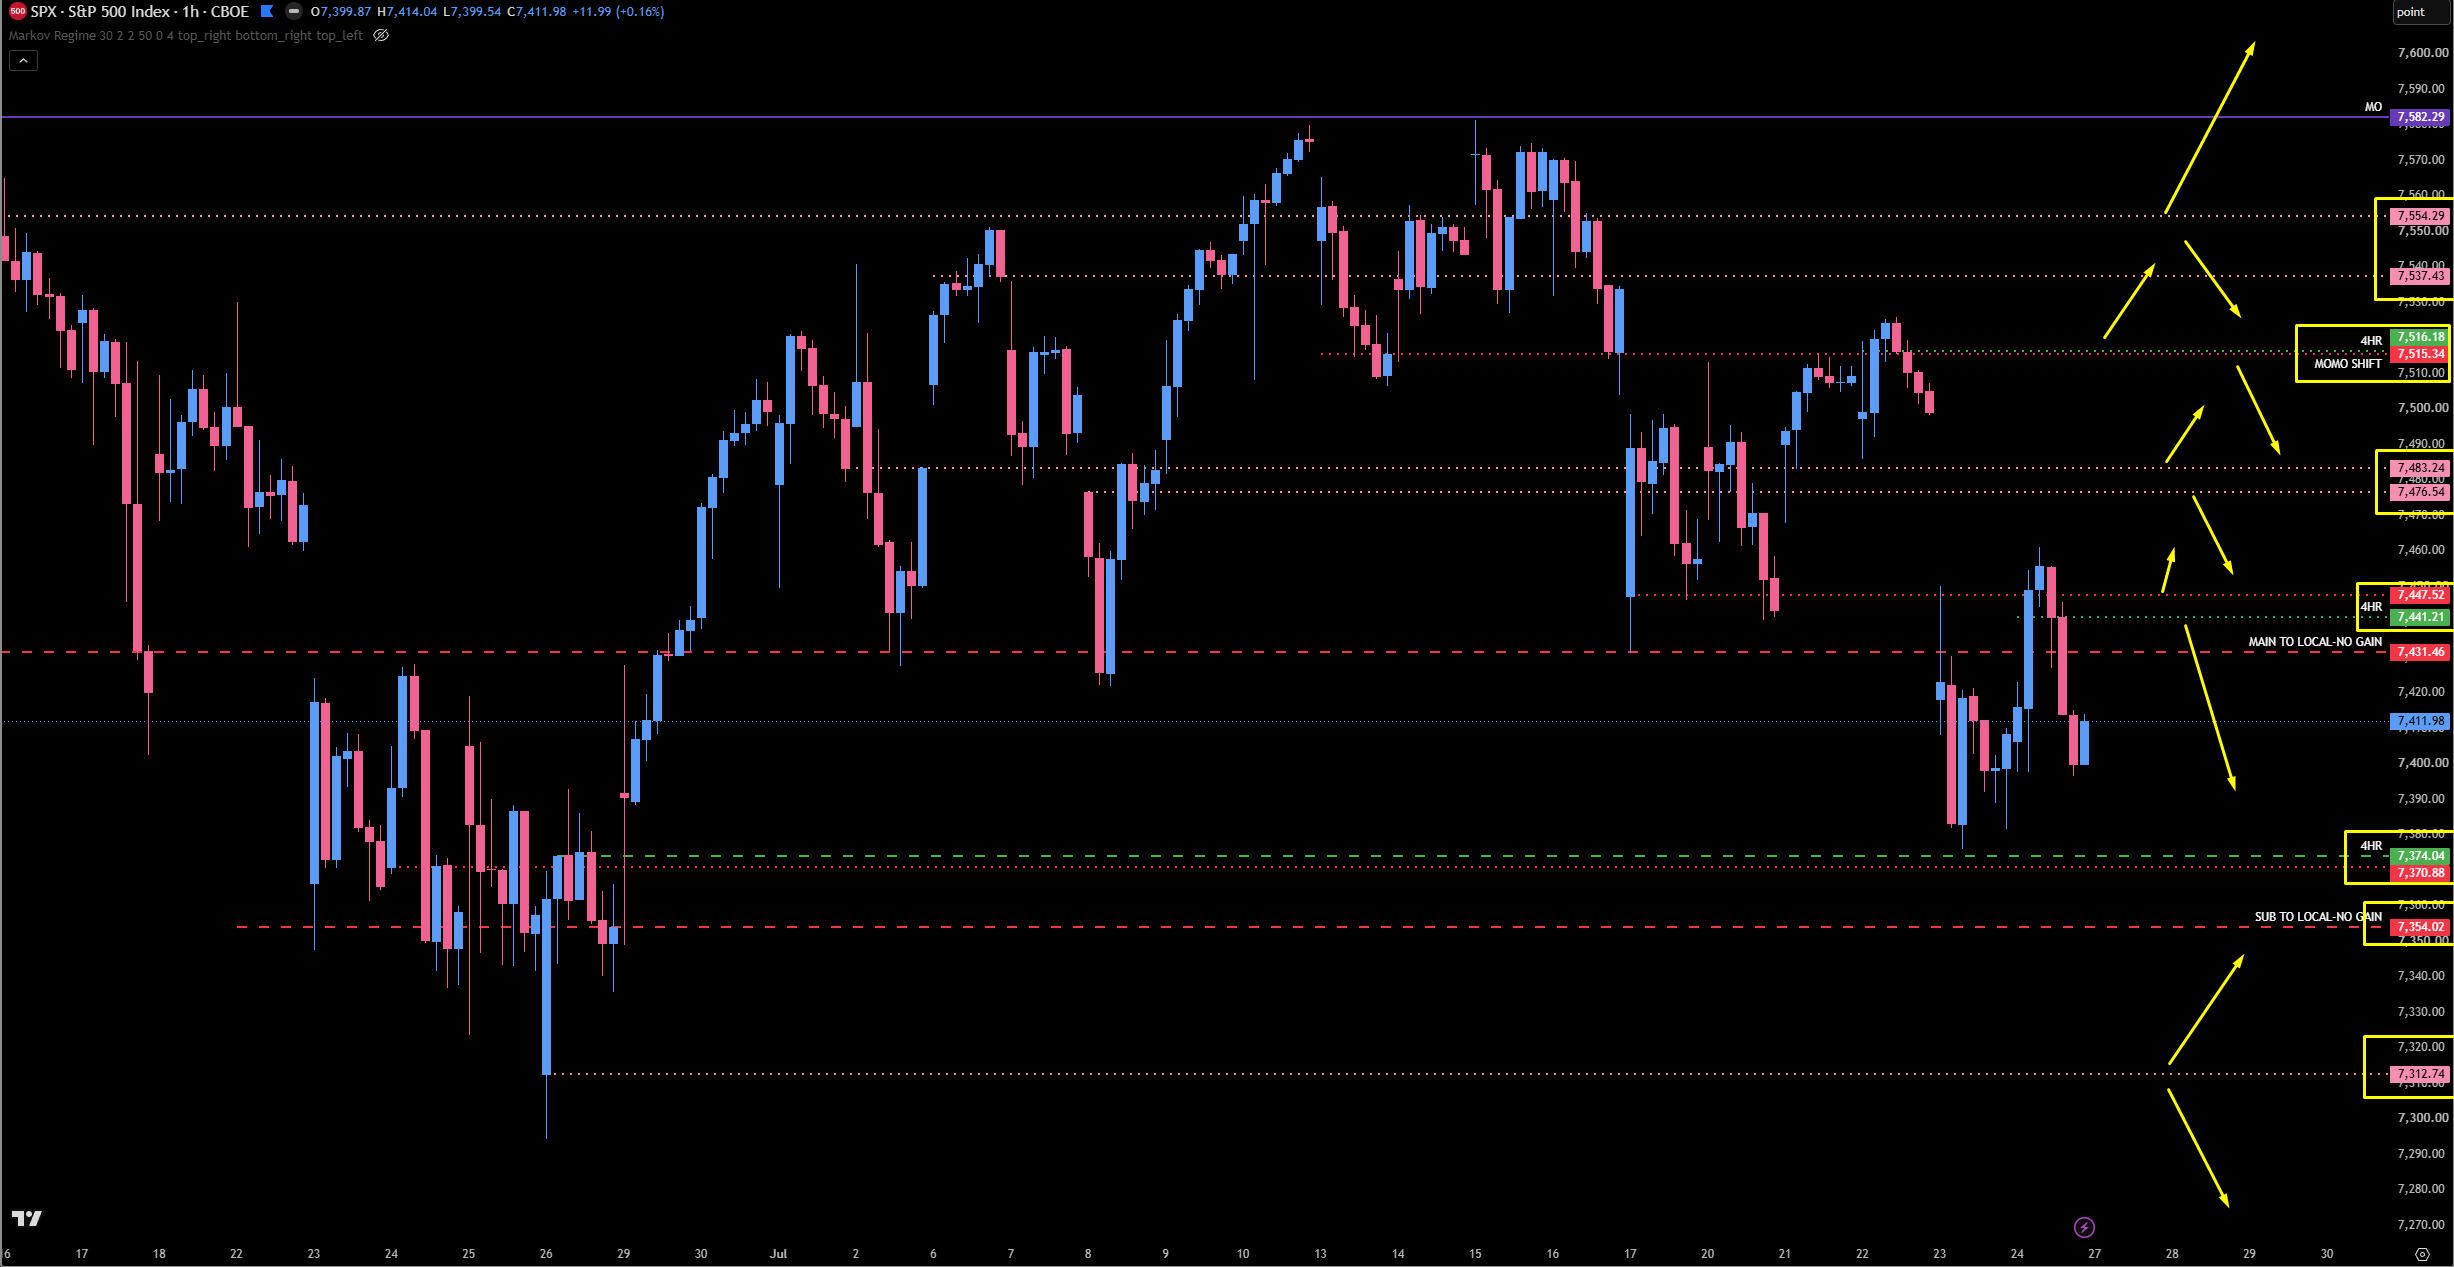
On SPX, we had an amazing short on Thursday. They played the 7447 and brought us all the way back down into the 7374 area to find support — a phenomenal display of trade plan perfection worth 75 points. On Friday we called a potential bottom in a squeeze, and that is exactly what we got as they ran us into our big resistance, but ultimately kept us suppressed underneath the 7447 daily and the 7431 weekly. That weekly is the same one that provided the squeeze two Fridays ago, and even though it is tested, it is very important — it has held this price up for some time, and we use it as our marker. Below 7431, she is in trouble and we come back down into the 7370 area. We do have an untested four-hour at 7441: if they pop up in here, stay below 7447, play 7441, and get back below the weekly at 7431, we could continue to peel off to the downside. Getting above 7441 and 7447 leads us into two big untested dailies at 7483 that we should absolutely watch for a smack — I would still short them, but I would take profits in that area and look for price to continue lower. Above the 7483 dailies is my last true short zone: 7515, which is very much untested. I remain bearish below 7515 — back above it really puts the wind back in the bulls’ sails. On the deeper timeframes, we had a beautiful touch on the monthly and played it perfectly after creating a leg down. This is a high-timeframe call and I am not certain of it, but it would not surprise me to get below 7237, the previous month’s low. Below that there is a daily and four-hour all the way down at 7312. If they come down and sweep the June low, we have a very nice untested daily at 7200 that I actually like — you could even wait to see if it reclaims 7234, which is a big wait and might mean getting long the next day. If they play that and get back above it, we should be able to come back to 7312 at a minimum for a 70-point pop.
🚨 VIX Analysis: The 17.44 Midpoint Monthly Pivot
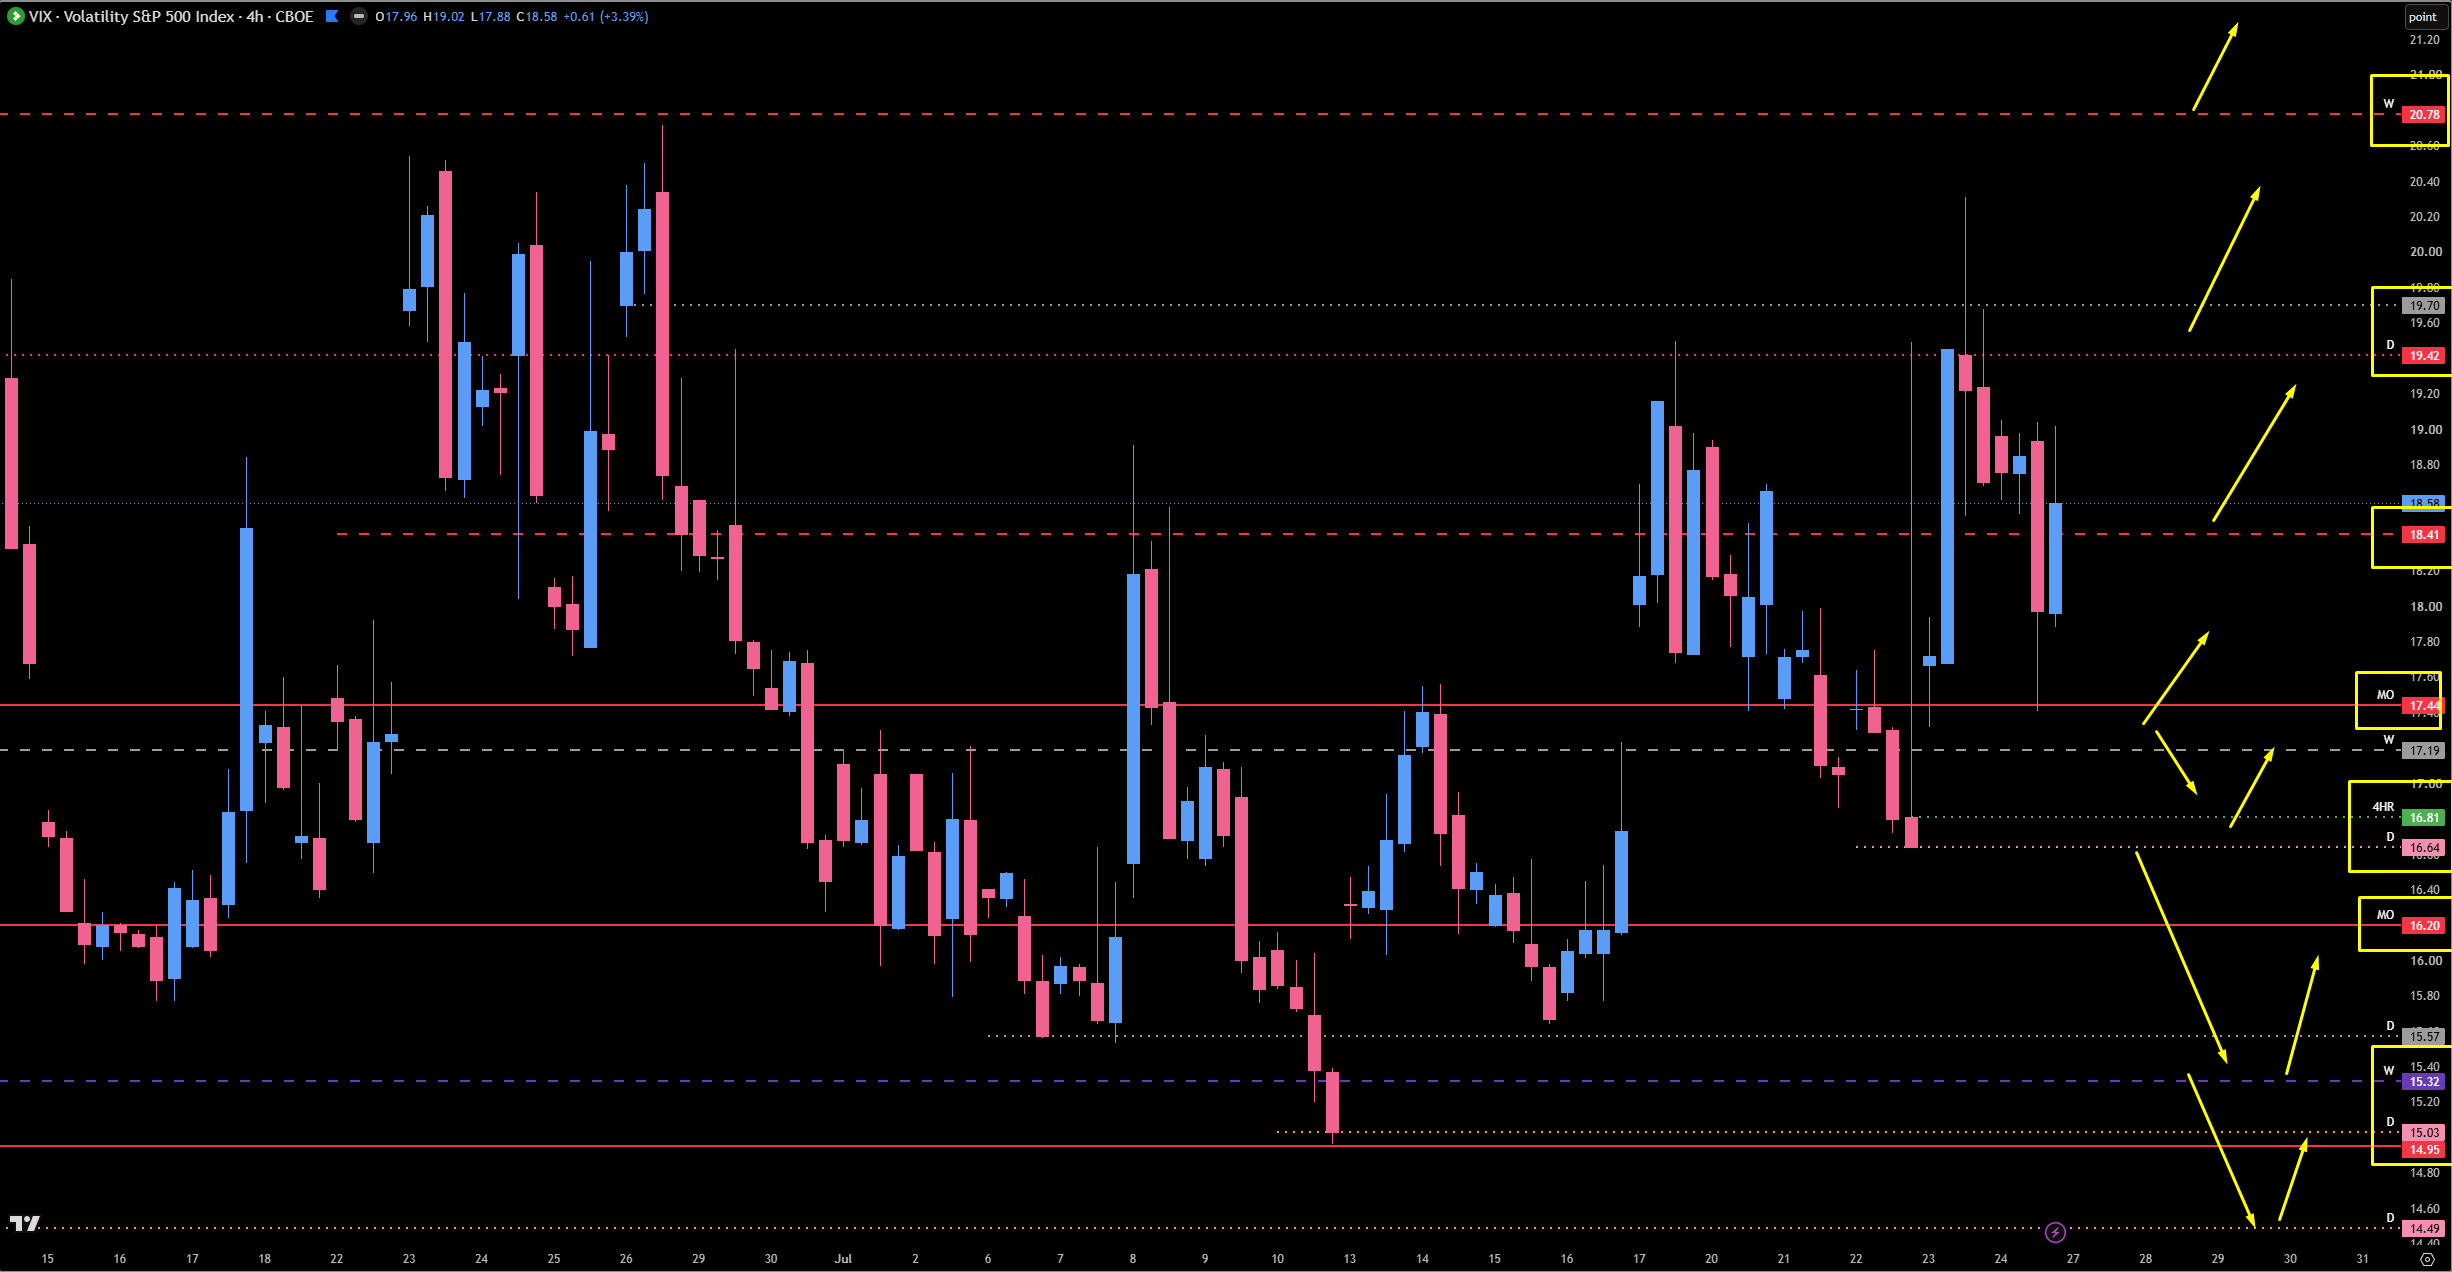
We are going to talk about levels we have discussed time and time again, and the big one is the 17.44 midpoint monthly pivot. Just remember: we are inherently bearish above this level, and the indices will see true relief below 17.44. We ended up pulling back from the 19.42, dipped into the valley, and shot right back above the 17.44, so it is not a perfect line — even though it has been played so many times, so perfectly, over and over again.
The Support Stack Below:17.19 (Weekly), 16.81 (Four-Hour), 16.64 (Daily). These are the lower levels underneath the 17.44 that could keep VIX propped up. If they bleed in here, look for these to play and send VIX back up. If they do not, and we stay below 17.44, we remain bullish on the indices, bringing us down to 16.20.
The Relief Path: Underneath 16.20, we could come way down into the $15 handle again and see the 15.32 area — look for a potential reaction there underneath the sweep of this move up. That would be meaningful relief for the indices.
The Bearish Ladder Above: As long as they stay above 17.44, we continue to remain bearish and push above the 18.41 weekly we have been watching, the 19.42 daily, and then the 20.78. Like I talked about last week, we have nothing left untested above us until we push all the way into the 24.70 through 25.70 big monthly/weekly resistance area.
The Accumulation Read: It certainly looks like a good amount of accumulation down here — we keep popping up and holding these lows, just like we have discussed many times regarding that $14-$15 handle. As long as we remain above 17.44 on VIX, there is a strong possibility of making that happen.
🎯 Detailed Actionable Trade Plan (ES Futures)
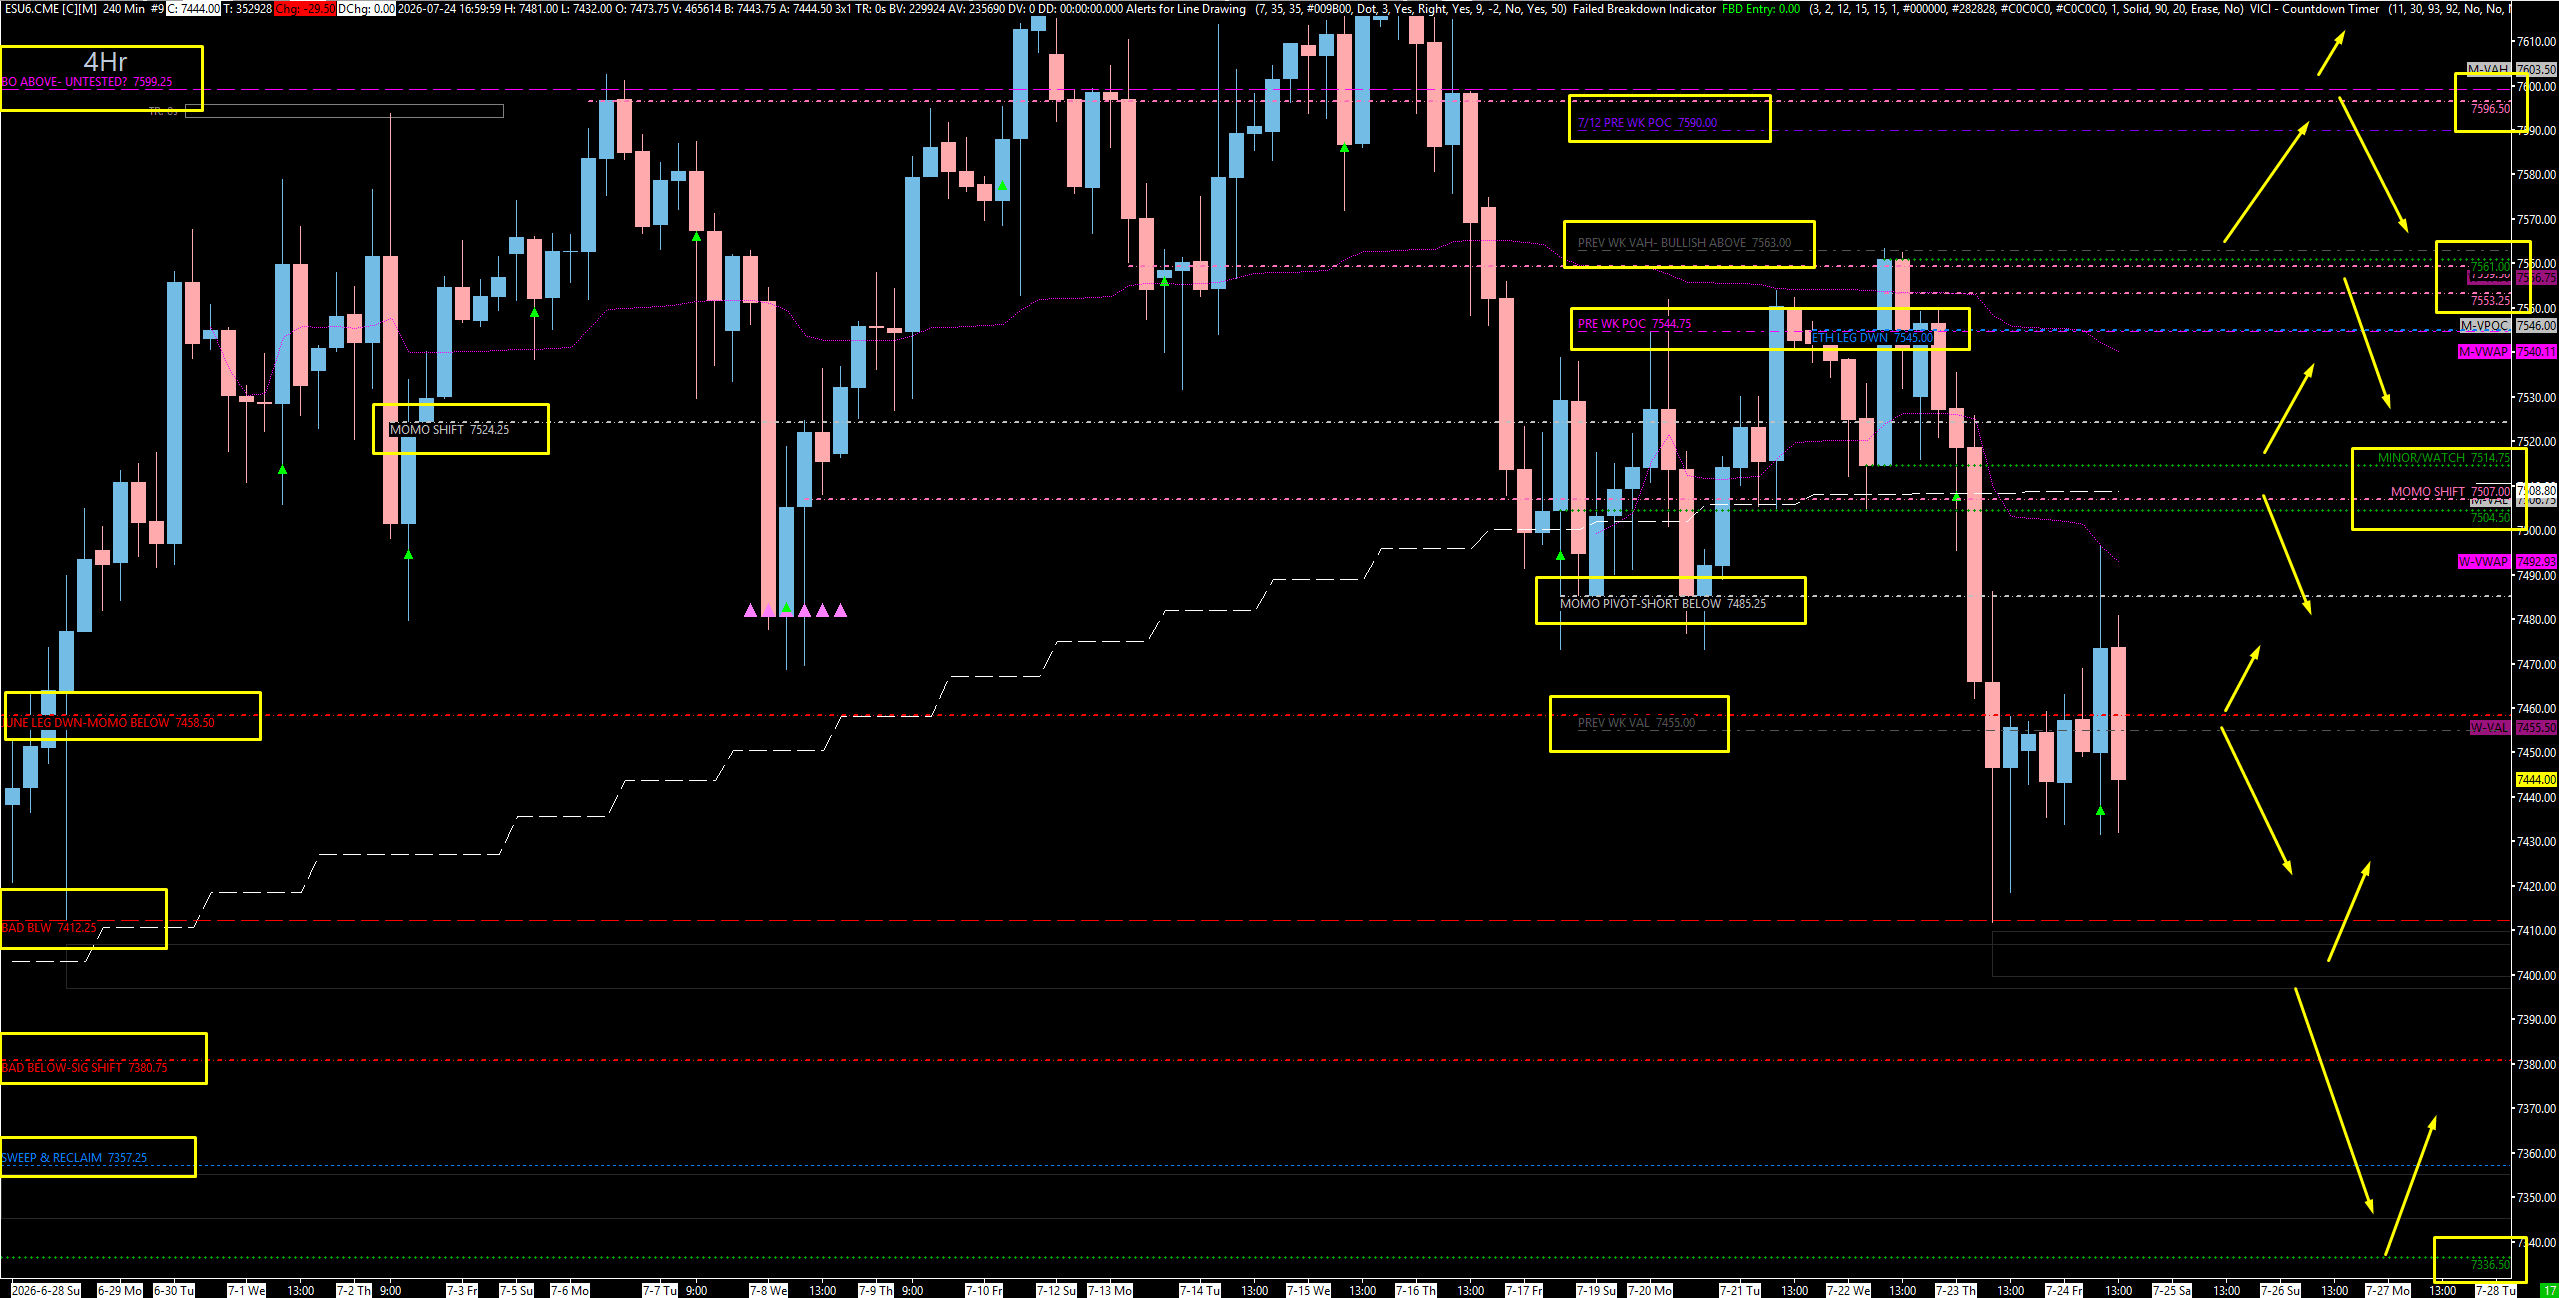
The process is pointed down, so this week is about smacking the pops. We have very little resistance above us until we get to 7504.50 - 7507 — that is really my first short spot, and the 7507 daily is the only untested daily I have on the entire board. 7455 - 7458.50 is the immediate momentum-shift line: below it we have deep downside momentum, above it things change significantly, though we remain bearish. We do not get relief until above 7563. On the downside, the 7412 weekly is the monster — a sweep and reclaim there is the only long I really like, and beneath it we work toward the 7336 four-hour, which I like a lot on first touch.
The Core Short Trigger: If we get a squeeze up into the 7504.50 - 7507 area, get a smack, and then get back below 7485, I am going to get so freaking short. Profit targets: 7458.50, and ultimately back down into 7412 to see if we can go even lower. That is the trade I am waiting for.
🔴 Key Resistance Zones & Setups
The Momentum Shift Line — P.W. VAL & Daily: 7455.00 - 7458.50
7458.50 (Tested Daily), 7455.00 (Previous Weekly Value Area Low).
Context: This is the level I want you to focus on most — it is going to be very important. The 7455 Previous Weekly Value Area Low sits right on the 7458.50 daily, and that daily is very much tested now. Underneath this zone, we have deep momentum down. Above it, we are still bearish and can pop up and short, but things do change significantly — technically momentum shifts above here. Look at the sequence: head bump, head bump, head bump, head bump, then breakout, and of course they got smacked. If they do it again, we could potentially squeeze.
Actionable Setup: Use 7455-7458.50 as your primary above/below gauge. Below it, the downside momentum is deep and shorts stay in control. Above it, remain bearish but be cautious, because momentum has technically shifted and a squeeze into the higher untested areas becomes possible.
Warning: Just because I am bearish does not mean we cannot squeeze above this zone to smack higher untested targets. Do not fight a squeeze — trade it, then look for the smack.
The Thursday Short & Trapped Buyers: 7485.00 - 7489.75
Context: Friday’s move down left some nice untested resistance on the one hour. You guys know I am not a fan of the one hour, but they trapped roughly 2,400 buyers at 7489.75 and another 1,800 to 2,000 just beneath — that is real fuel for an inverse reaction. The 7485 daily is the trade where we got literally every single point of the move, and it is now tested. We want to remain short below 7485.
Actionable Setup: Short Setup: If we pop up here and play 7489.75, then get back below Thursday’s high — which is basically the 7485 daily we shorted previously — get short. We will more than likely come down back to the 7458.50 area, or at least the congestion around 7470.
The First Real Short Spot — Big Confluence: 7504.50 - 7507.00
7507.00 (Daily — Only Untested Daily / The Short), 7504.50 (Untested Four-Hour / One-Hour), plus the 50-Day Moving Average and the Monthly Value Area Low.
Context: This is my real reactionary area and my first short spot. We have very little resistance above us until we get here. The 7507 daily is the big level — and importantly, it is the only untested daily I have on the whole board, which makes it a short, not a buy. It pairs with the untested 7504.50 four-hour and one-hour, and this whole spot played multiple times from the bottom side, so it was absolutely a fantastic area. Stack the 50-day moving average and the monthly value area low in here and it is loaded.
Actionable Setup: Short Setup: I would be looking to short the sh*t out of this spot if we get up in here. Especially if we get up here and then get back below 7485 on the continuation play — if they do that number, we get super short, because it is over with. Profit targets: 7458.50, then 7412.
Warning: Do not short prematurely below this zone. If we get above 7485, wait for price to actually get into this section before engaging.
Context: This is the upper range of the immediate structure. I have 7514 marked as minor but worth watching, and it is there to lean on just in case they want to get jiggy and push through the 7504-7507 zone. Obviously as soon as we get into 7514, I get a little sketched out.
Actionable Setup: If they push up into the 7514 - 7518 spot, wait for this area to react and get back below 7504 before you get all excited about the short. As long as they stay up in here and push back below 7504, we are good to go to come down.
The Momentum Shift Daily: 7524.00
7524.00 (Tested Daily).
Context: Above 7514, we come through the 7524 daily. At this point it is still important, but it has been tested so much that I have decided to not make it significant anymore. Above this daily, we start to shift momentum again.
Actionable Setup: Treat 7524 as a momentum marker rather than a primary trade location. Above it, expect the squeeze to extend into the bigger zones above.
The Previous Weekly POC & Monthly Confluence: 7544.00 - 7545.00
7545.00 (ETH Daily Leg Down), 7544.75 (Previous Weekly Point of Control), plus the Monthly VWAP and Monthly POC.
Context: If we push up through 7524, guess what we come into — the Previous Weekly Point of Control at 7544.75, an ETH daily leg down at 7545, the monthly VWAP, and the monthly POC all in the same spot. This is a big spot. It also lines up with some of the highest untested levels we have.
Actionable Setup: Short Setup: This is a legitimate short location on a squeeze. Just because we are above the lower zones and momentum has shifted, being below 7563 keeps the bearish structure intact — and this confluence is where the squeeze should meet real supply.
The Trapped-Buyer Reaction Zone: 7553.00 - 7561.00
7561.00 (Untested Four-Hour), 7559.00 (Daily), 7553.00 (Daily), plus a Naked Point of Control — 4,600 Trapped Buyers.
Context: This is where it gets interesting. We have a naked point of control up here, two dailies at 7553 and 7559, and an untested four-hour at 7561 — and we have a huge amount of trapped traders. Look at it: they trapped 4,600 buyers for the high that day, which was insane. Those guys are going to get a big reaction when price comes back up there, because there will be an inverse reaction.
Actionable Setup: Short Setup: If the 7561 / 7553 areas play, we want to get back below 7545 before we get real excited about a short. Even though I am bearish below 7563, if we get all the way up here I want to make sure they are actually going to come down before I commit. Once confirmed, this is a high-quality fade with the trapped longs providing the fuel.
The Relief Line: 7563.00
7563.00 (The Bear/Bull Line).
Context: This level continues to show its head again and again — last week it was 7560, and it keeps proving itself. I am basically bearish below 7563, and from this leg down I am inherently bearish. We do not get relief until above 7563.
Actionable Setup: Above 7563, the bearish thesis is off and we hand it back to the bulls. Below it, everything on this board stays a short-the-pop exercise. And if they push above 7563, do not forget we have 7596 and 7599 above — the levels we were bearish below previously.
🔵 Key Support Zones & Setups
The Monster Weekly Sweep: 7412.00
7412.00 (Very Tested Weekly — The Monster).
Context: How big is this 7412? It is big as hell. This weekly was a monster — we played it from the bottom side multiple times and it sent us way up, and we played it with precision on Thursday. I truly think that if we come down here, we could sweep this level and squeeze back up. It would also sweep a local daily low, which is exactly the kind of liquidity grab that ignites a pop.
Actionable Setup: Sweep Setup: Watch for a potential sweep of this low. If we sweep 7412 and reclaim, that is a great opportunity to grab points back up to 7458.50 — roughly 40 points, which is awesome. This is the only long I really like on the entire board. Can we buy the sweep of 7412 and get the reclaim? Yeah, maybe — it might work and it might squeeze nice. But understand my process still says we are pointed down, so take your profits.
Warning: If they do not get that sweep and instead pop below 7412 and accept, the downside opens up quickly toward the deeper zones.
The Tested Daily & Swing Low Sweep: 7357.00 - 7380.00
7380.00 (Very Tested Daily), 7357.00 (Big Swing Low — Generated End of June).
Context: Below 7412 I have a daily down here at 7380 that is very much tested — do not expect a reaction from it. Below that, we would come down and sweep the big swing low at 7357, which was generated at the end of June.
Actionable Setup: Treat 7380 as a progression marker only, not a buy. The 7357 swing low is the liquidity target that sets up the four-hour long just beneath it.
The Favorite Long — Four-Hour First Touch: 7336.00
7336.00 (Untested Four-Hour).
Context: I like this four-hour a lot. We talked about this weeks ago when I thought it was going to come into play as we came down here. I do see this level playing on first touch — absolutely — and I will more than likely be buying here.
Actionable Setup: Buy Setup: Look for 7336 to play and get back above 7357. I know what you are thinking — that is a 20-point reclaim, and yes, that is the issue with this trade. But I like the level, and I will be taking profits into 7357 and 7380.
The TPO Cleanup Target: 7313.75
7313.75 (Weekly TPO Cleanup Area).
Context: I like this level down here on the weekly TPO and I think we can target this area — I truly do. I know it is pretty far from where we are, about 120 to 130 points, but I do foresee us coming down here to clean this up. I really do.
Actionable Setup: This is the structural magnet for the week if the downside continues. Use it as a target for shorts riding down from the resistance ladder above.
The Last & Final Untested: 7284.00
7284.00 (Last & Final Untested Level).
Context: Below the cleanup area, this is our last and final untested level. It is a decent spot for a reaction, but understand this: it is not going to save the market, guys.
Actionable Setup: Conditional Long: This is one of those trades where you take 7284 to 7336, you make 50 points, and you call it a day. 7284 to 7336 for sure — but do not build a thesis around it holding.
The Deep Sweep & 100-Day: 7213.00 - 7232.00
7232.00 (Massive Low — Sweep & Reclaim), 7213.00 (Four-Hour), plus the 100-Day Moving Average.
Context: If we come down even farther, guess what is down here — the 100-day moving average. What a great spot. This would be a sweep of that massive low, and if I had to guess, this is the sweep and reclaim of 7232. We have nothing high-timeframe down here, but we do have another four-hour at 7213.
Actionable Setup: Conditional Long: We want to see it sweep this area, and then obviously start to take profits back up around 7284 and 7336. This is the deep-flush scenario — a real opportunity if it develops, but it means the downside has fully played out first.
Let me make this very clear so nobody misreads the week. We are pointed down on all timeframes — the daily, the four-hour, and the one-hour — with only the weekly holding in balance. Technically speaking, our process says this is not a long anywhere, and so we are only looking for shorts. Take the longs where you can get them, but know they will be muted, take your profits, and do not go hunting crazy runners. We are in Negative Gamma, which means rotations in both directions, expanded ranges, and inefficiencies getting filled — so every pop right now is smackable as long as you respect the lines we are above and below.
The playbook is defined. 7455 - 7458.50 is the immediate momentum-shift line — deep downside momentum beneath it. Above that, the pops become short opportunities: 7485-7489.75 with 2,400 trapped buyers, then my first real short spot at 7504.50 - 7507 where the only untested daily on the board sits, then the lean zone at 7514-7518, the 7524 momentum marker, the 7544-7545 POC and monthly confluence, and the 7553-7561 zone with 4,600 trapped buyers waiting to fuel an inverse reaction. We do not get relief until above 7563. The core trigger I am waiting on: squeeze into 7504-7507, get the smack, then get back below 7485 — that is when I get so freaking short, with targets at 7458.50 and 7412.
On the downside, the 7412 weekly is a monster and the sweep-and-reclaim there is the only long I truly like — roughly 40 points back to 7458.50. Below it, 7380 is tested with no reaction expected, 7357 is the swing-low sweep, and the 7336 four-hour is my favorite buy on first touch with a reclaim of 7357 to confirm. Deeper still, 7313.75 is the TPO cleanup target I do foresee us reaching, 7284 is the last and final untested for a 50-point trade, and the 7213-7232 area with the 100-day moving average is the deep-flush opportunity. On SPX, mirror it: bearish below 7515, real upside push above 7447, and watch the 7200 / 7234 sweep-reclaim for the 70-point pop into 7312. Keep VIX front and center — above the 17.44 midpoint monthly we stay inherently bearish on the indices, and below it we finally get true relief.
We absolutely murdered it last week. If you are a Substack subscriber and you are not in the Inner Circle, hit me up — I have a new way for you to get in. Come try it out for a month, see the magic we are doing in there, because we are changing people’s lives and there are people in that room putting up ridiculous numbers. And do not forget to grab the free SPX Morning Brief so you are prepared before the bell every single morning. I will see you in the room at 8:30. You guys have a good one and take care of yourself.
Until next time—trade smart, stay prepared, and together we will conquer these markets!