

Welcome back, everybody. It is time once again for the Weekend Review, and I hope everyone is having a fantastic Labor Day. It is a beautiful day out by me, so I hope you all got a chance to go touch some grass.
We called the bottom, as everybody knows, at 7622.50, and it was my call when that happened that we could easily traverse to 7800 or even all-time highs. I am still confident in that call. We have got serious support underneath us and some great confluence, and I cannot wait to show you what is up. It has just been another display of trade plan amazingness — we literally nailed the bottom, the top, and the sideways. Unbelievable. And here once again, our process is setting us up beautifully.
Today we are going to do something a little special because I am feeling frisky. I did NQ earlier, and now we are going to run SPY and SPX together, then VIX, and of course ES. And here is the headline: we are really setting up for another monster long as long as one particular area holds up. It comes down to one large major spot. Let’s get right into it.
☕ FREE RESOURCE — The SPX Morning Brief | Delivered 5:45 AM EST
SPX value levels, 150+ indicator prediction assessments, and the day's top 5 news stories — in your inbox before the bell. Newly rebuilt and completely free.
First come, first serve, capped at 500.
Sign up now → https://go.vicitradingsolutions.com/spx-brief

A Note on This Week’s Market:
News: Today is Labor Day and nothing specific is flagged on the radar for the week ahead. Just be aware of where we are structurally coming into the open, because we are sitting right on a trigger level.
Cross-Market: Here is something wild and very contradictory. I ran NQ earlier and NQ is actually down on all timeframes. Meanwhile, when I look at ES it looks so bullish it is insane — and SPX and SPY are up on the weekly, the daily, the four-hour, and the one-hour. Obviously I love ES for a reason, and these markets are inherently bullish anyway, which is why we usually look to that side of things as our process points us.
Range: We had a pretty massive move up over the course of the past few months, and we have been digesting this area sideways as we potentially get ready to make another move. This is exactly the pattern I have been trying to explain in the post-market breakdowns: huge push up, go sideways and build a profile, push up, go sideways, push up, go sideways. Now we can finally see it playing out.
VIX: We are way suppressed and it clearly looks like it wants to continue. But we are getting really close to one of our last untested supports down there, and when we are in the $13, $14, $15 handle, things can get very reactionary. Keep an eye on it.
Trend: Up on all timeframes on ES, SPX, and SPY. Everything on these charts is telling me to buy. I do not recommend shorting if we start to take off — just try to find a place to get in. Obviously if we break that one particular area, feel free to start shorting, because at that point we will have lost support.
🧠 Current Market Context
One Spot, One Trigger, And A Very Clean Chart
I am going to say this up front because it is the whole plan: this is a killer trade plan and I have laid it all out. We basically have one spot — it is about a 12-point zone. It holds, we go to 7800. It does not, we come down. It really does not get much easier than that.
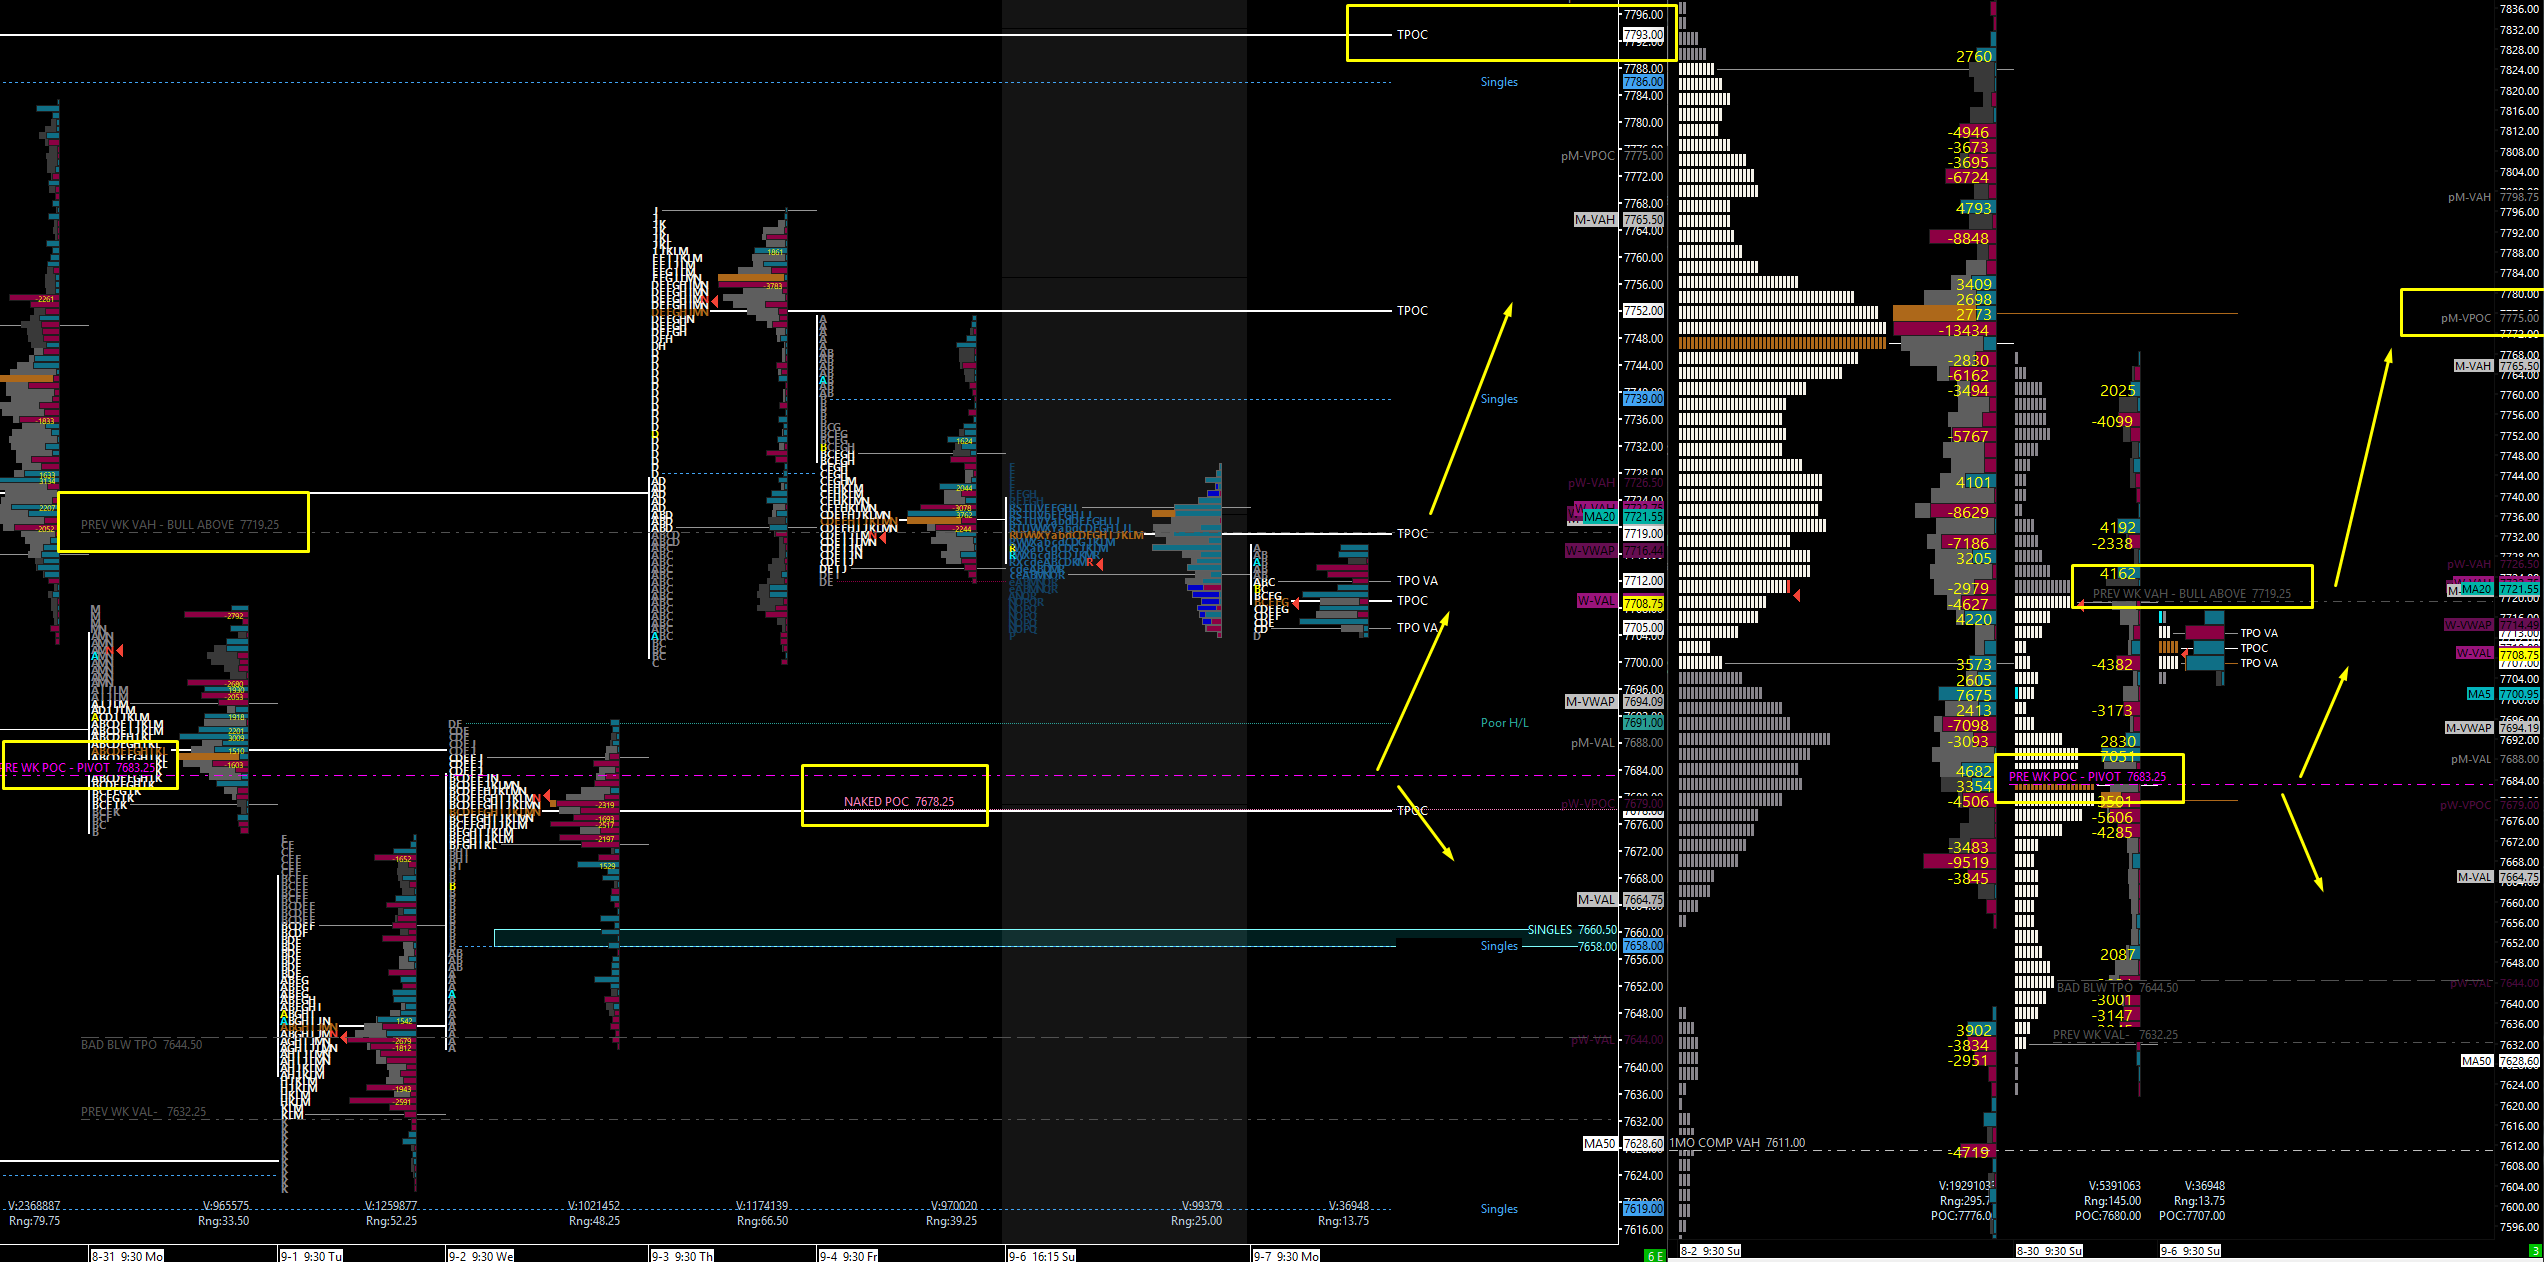
The ES weekly TPO frames it perfectly. Over here I have the weekly composite, which is actually an entire month — a big boy — and then last week’s profile. We have a really clearly defined spot at 7719.25, the Previous Weekly Value Area High: we are bullish above this on the weekly TPO, and it lines up perfectly with a four-hour and with yesterday’s point of control. This is our big trigger spot to push above. Down below, the massive area is our Previous Weekly Point of Control at 7683 — there is a lot of volume in there and it is very clearly massive support. On that huge monthly composite, we basically have a whole profile sitting right there, a huge area of volume — and if they hold it, we could easily come back up and start to fill it in, because why not? It lines up too nicely. Once we push back above 7719.25, we are cleared for takeoff all the way through 7775 and ultimately 7800. Once we get outside of that profile, we should just continue to drift up into the first spot at the big point of control and then push higher. On the daily profiles it is the same story — a beautiful daily naked point of control right in that support area, and those are usually reactionary as well. We have a weekly POC, a daily POC, and a lot of overlapping value. We just want to see it hold. And if it does not, it is obvious that this is the spot that has to do it — otherwise we come down and clean up the inefficiency below.
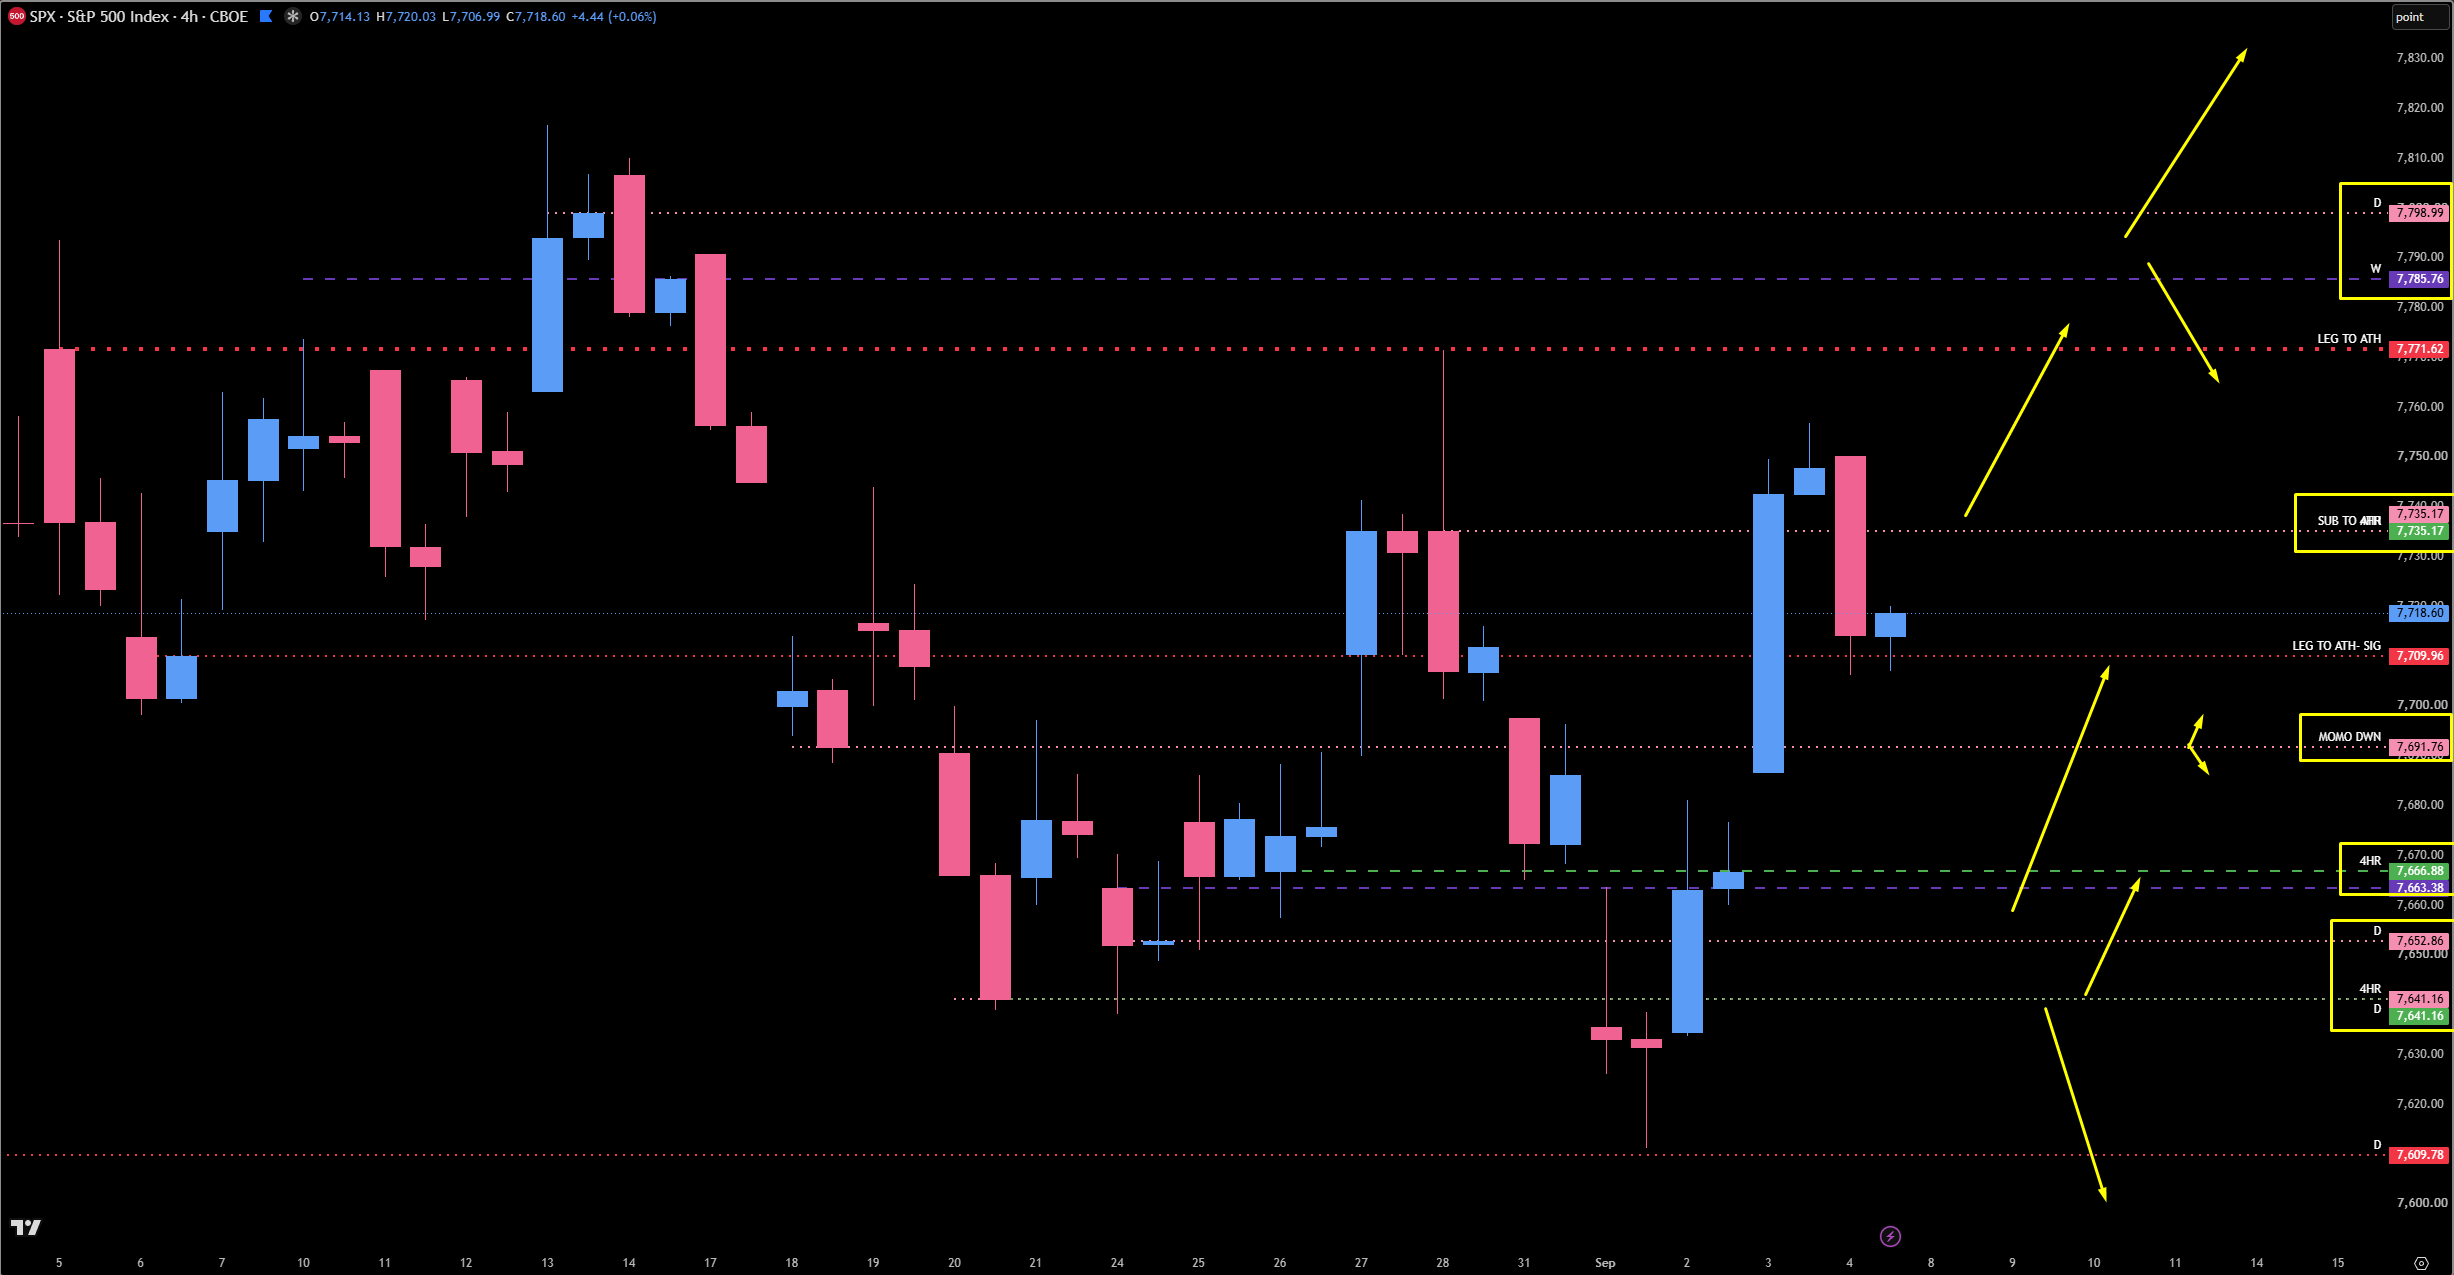
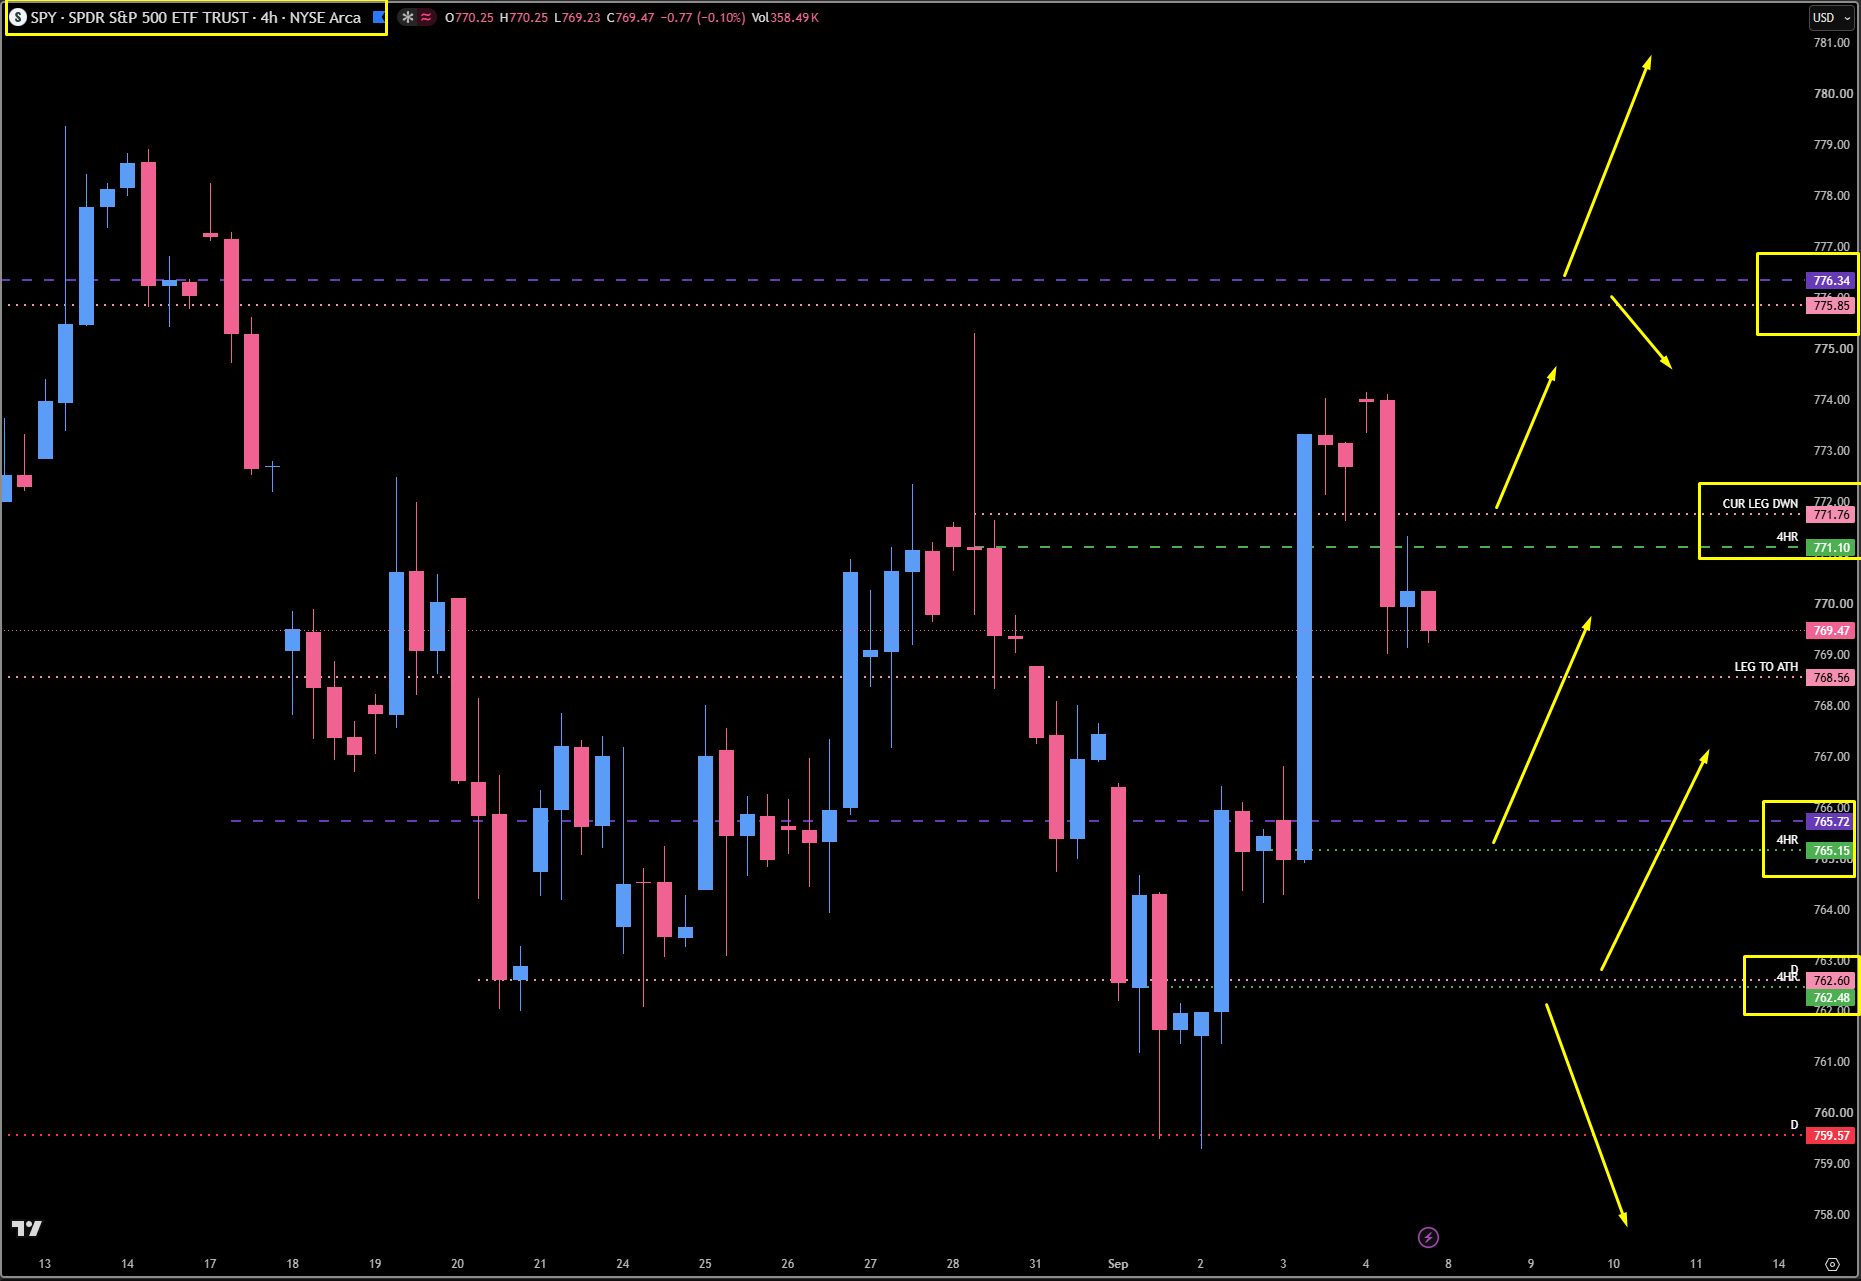
On SPX and SPY, look at this beautiful pattern on both. We essentially have a massive buy spot that looks really, really nice. On SPY, the main spot is the 765.75 area — a big leg down and a huge shoulder. I like it quite a bit. If you wanted to go lower, we have one more untested spot at 762, the lowest shoulder, and I actually like that area too — there is confluence down there as well — but I like the middle spot quite a bit more. The same thing applies on SPX: we have a four-hour, but ultimately I have this big weekly at 7666.63 that aligns with the big four-hour, and it is the same pattern with that big shoulder. I like this spot. We do have more support below with the 7641 daily and the 7652 daily, and I am not opposed to buying those, but I really want to see this big weekly area play — same as the SPY 765 area. I truly believe that if this area holds and we start to get back above 7691 and then reclaim 7709, we should have no problem getting up into the 7785 area. And it is pretty clear where it all goes south, and it is the same on SPY. I liked the way they lined up technically — I thought it was extremely sound.
SPX / SPY:
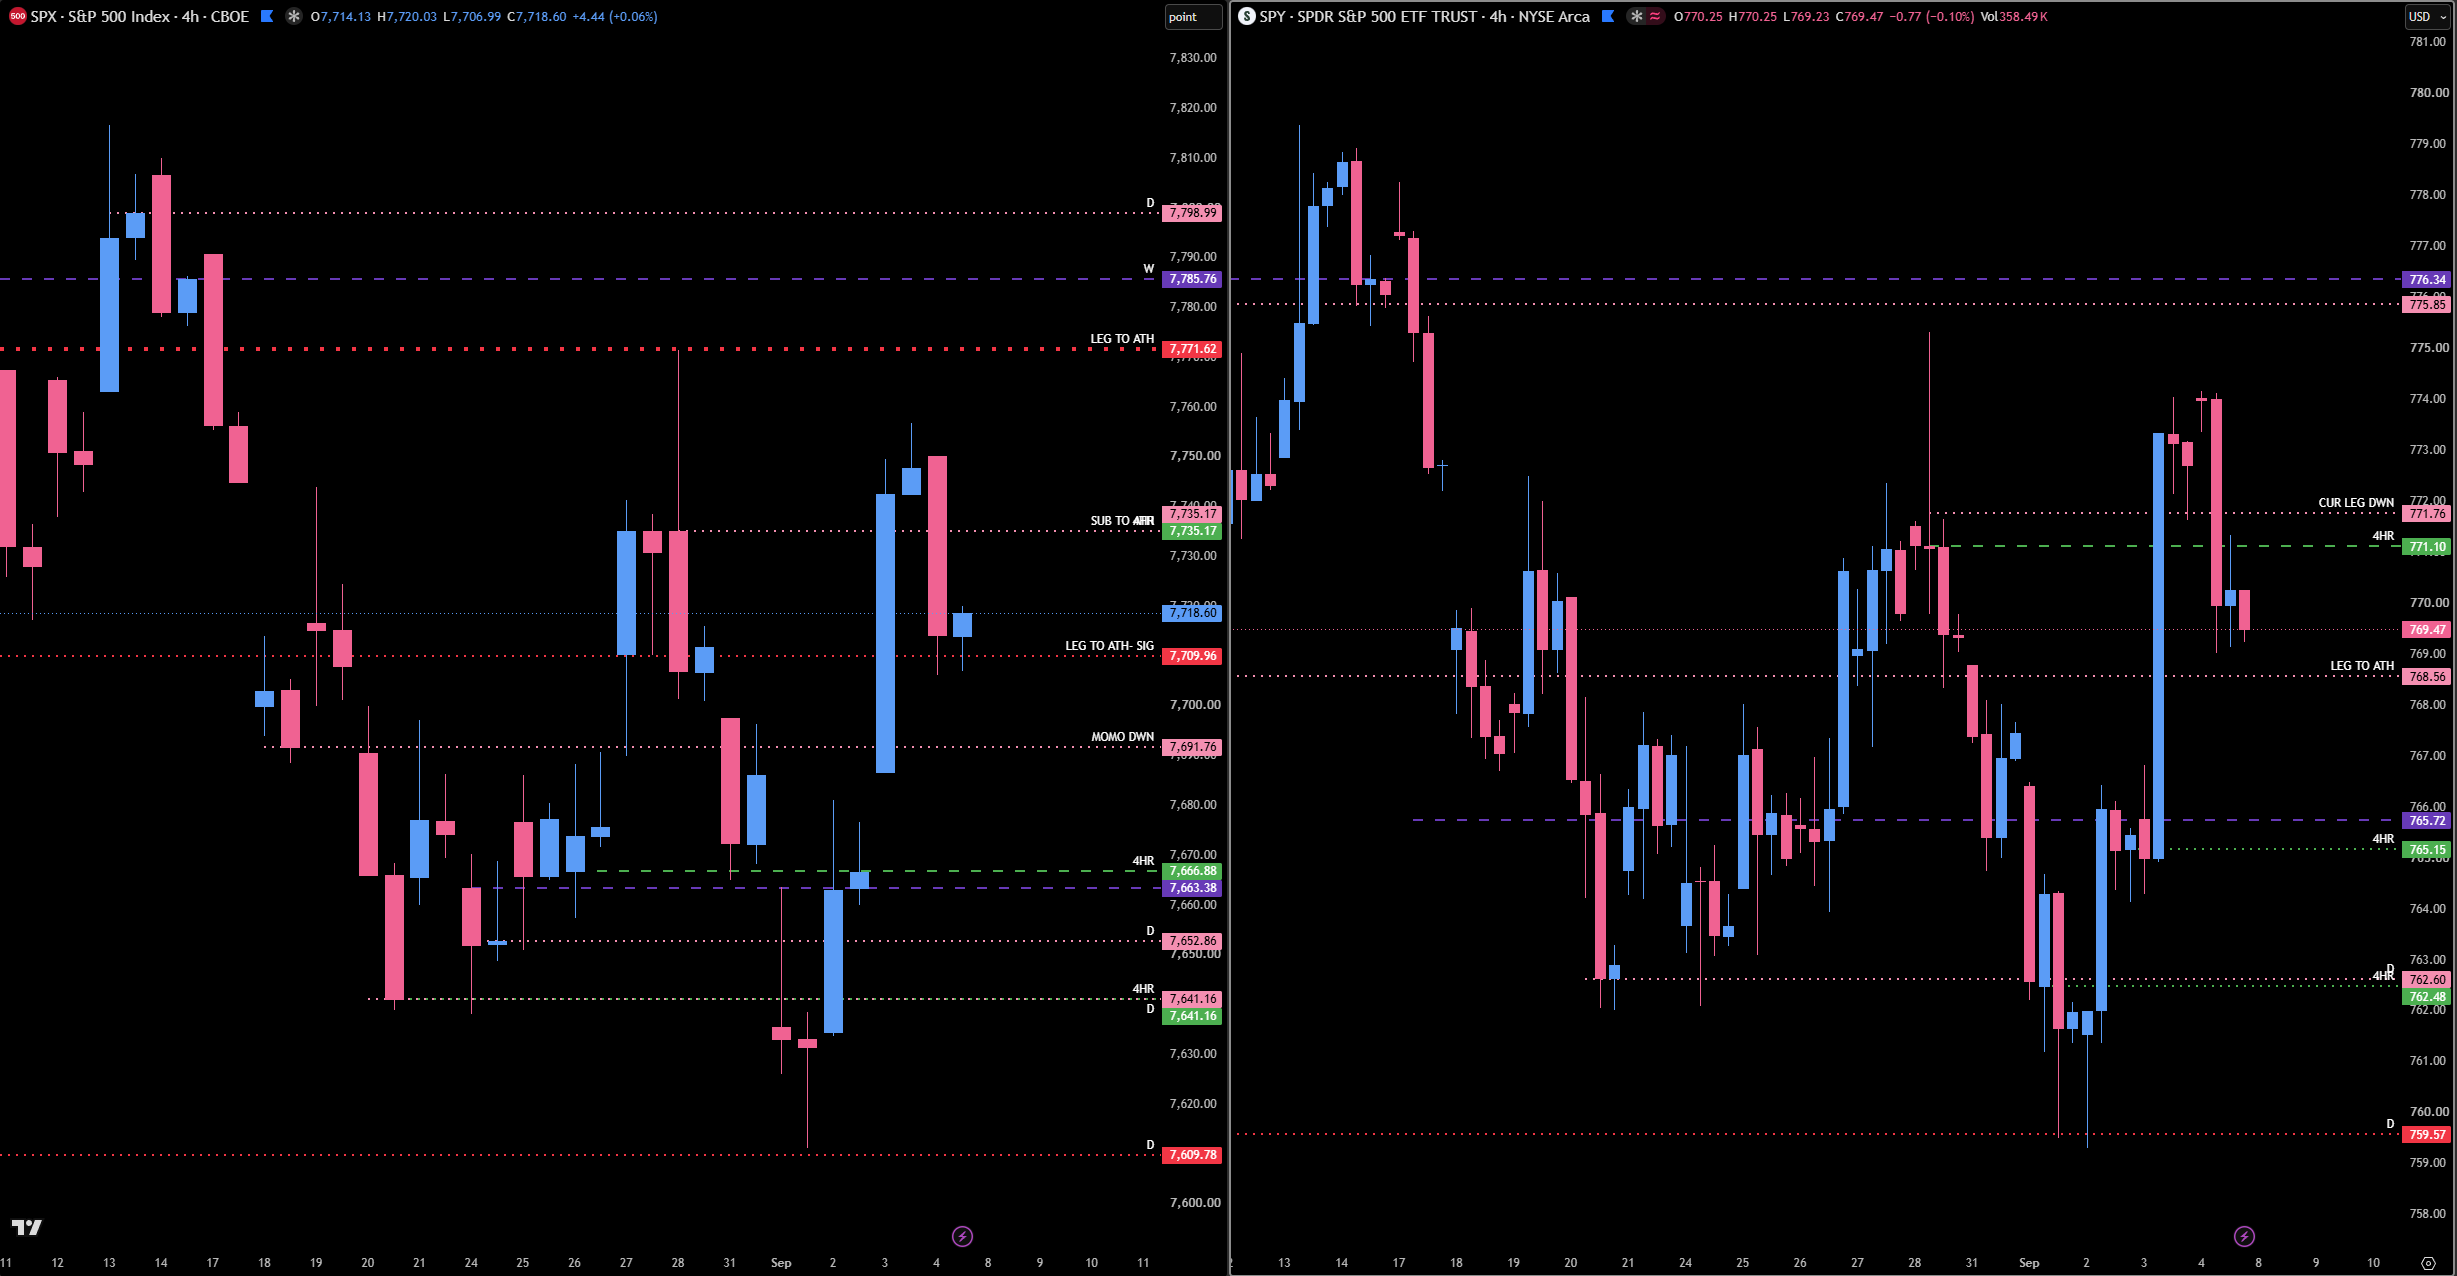
SPX 4HR:
SPY 4HR:
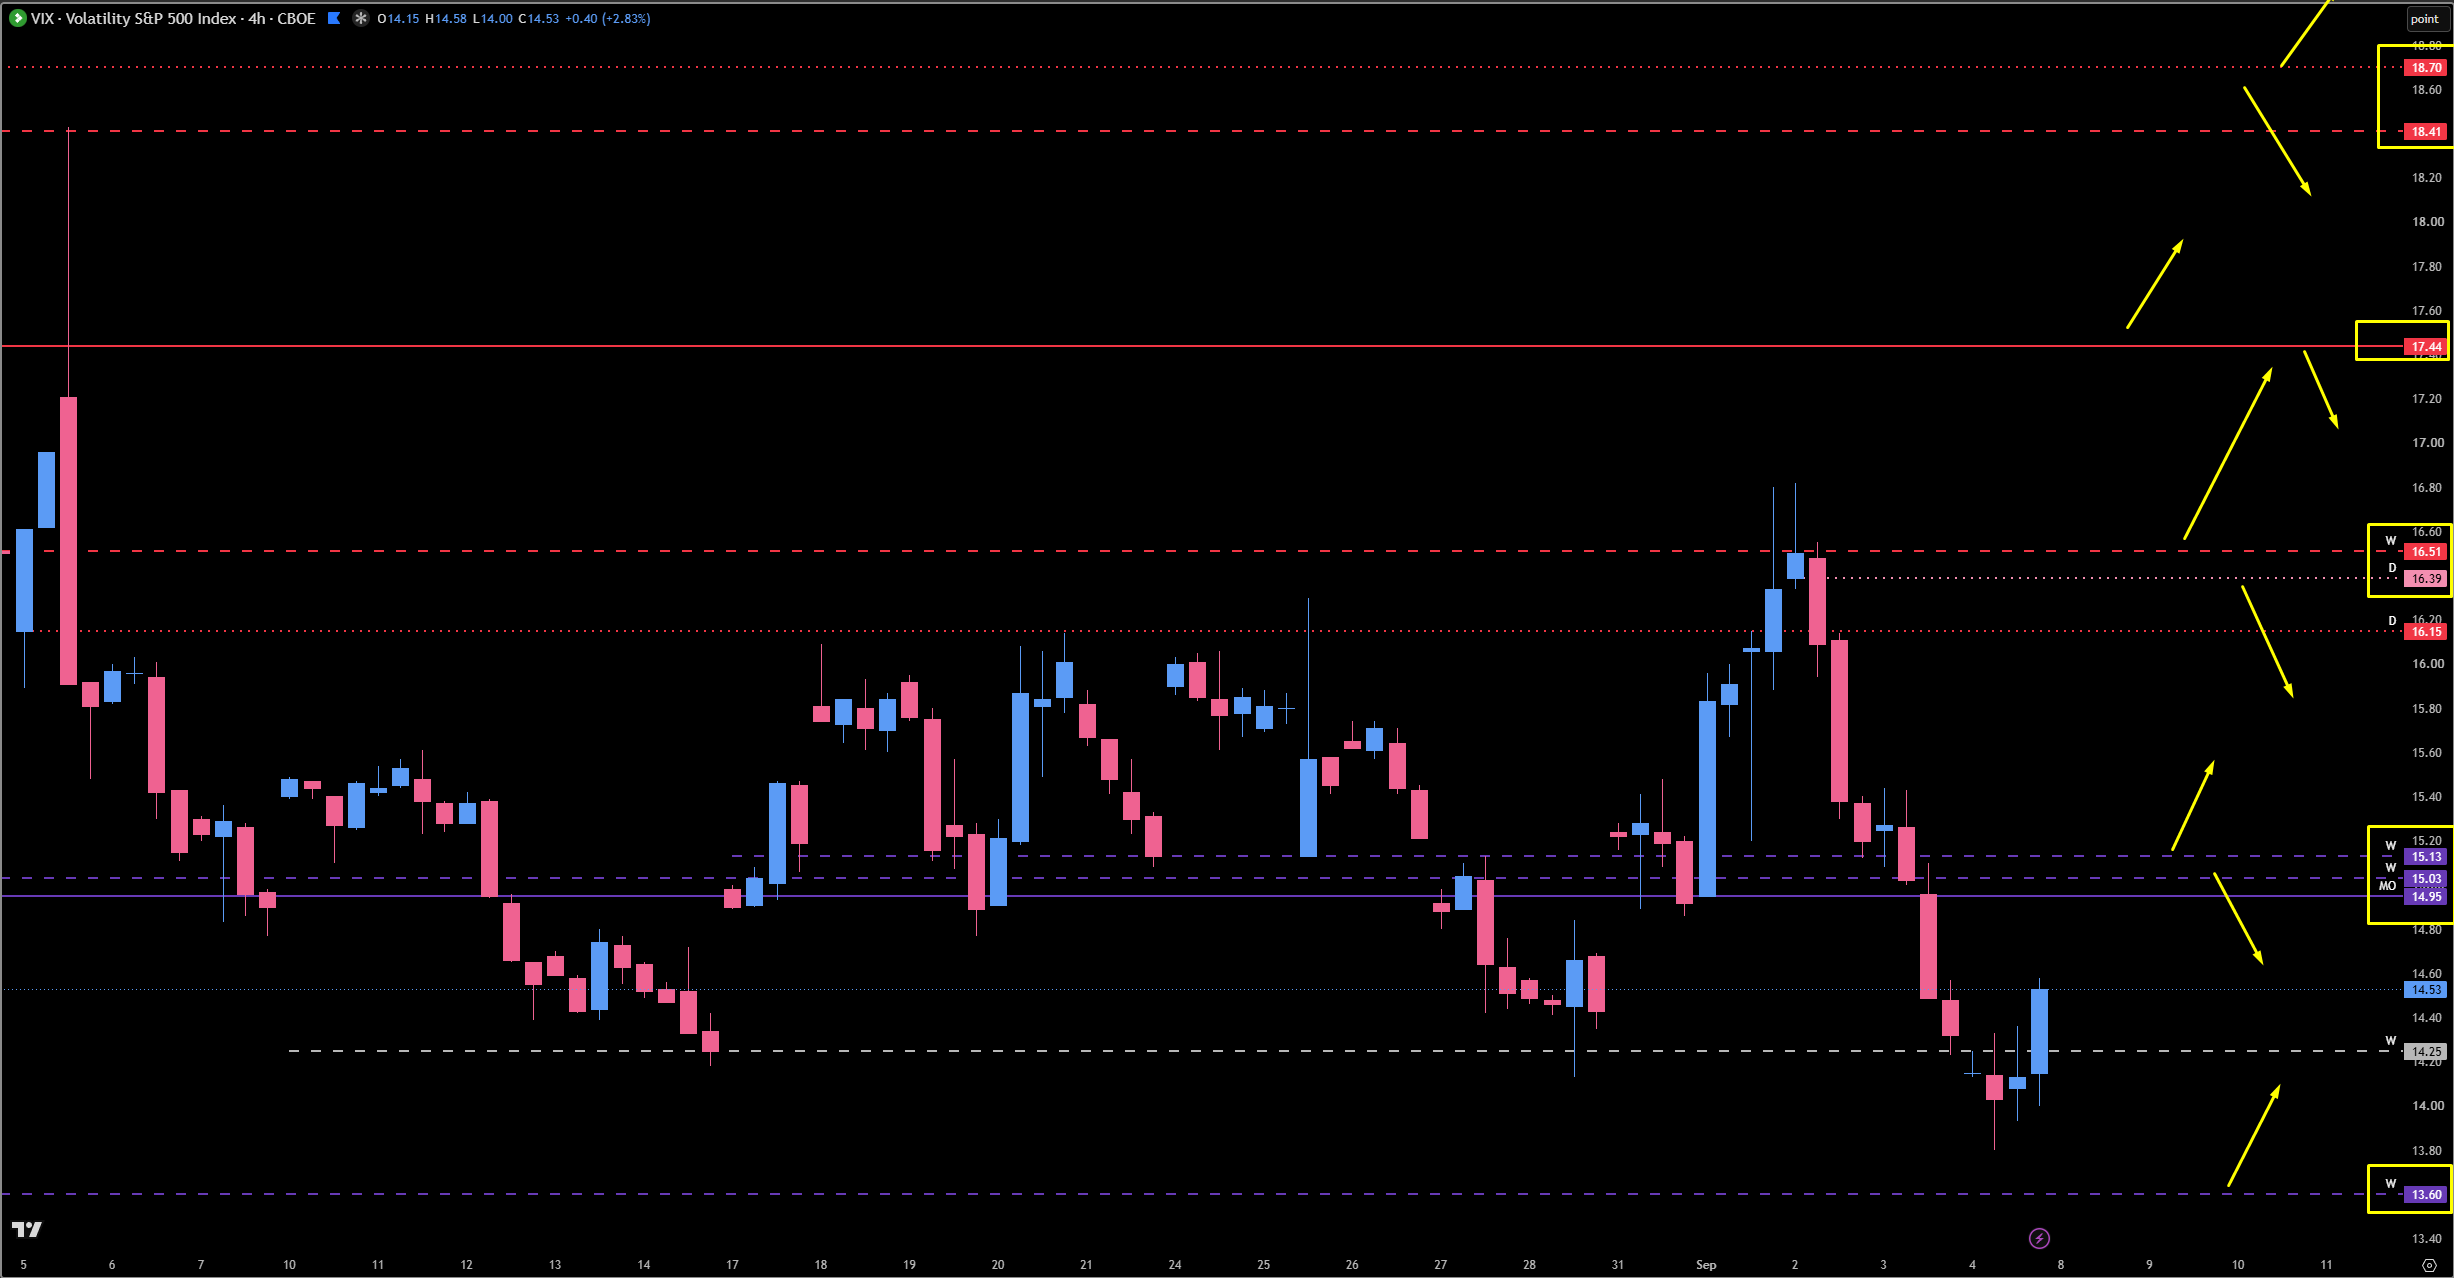
🚨 VIX Analysis: The 14.95-15.13 Resistance Stack
VIX is way suppressed and it clearly looks like it is going to continue doing this. But we just need to be careful, because I have talked many times about how the $13, $14, and $15 handle gets very reactionary, and we are getting really close to one of our last untested supports down there.
The Massive Resistance Stack: 14.95 through 15.13. This is a huge spot — two weeklies and a monthly stacked together. And we are already starting to sweep this low, so I can clearly see them coming up in here, finding resistance, and then coming down into the 13.60. I am not saying that is what is going to happen, but if I had to guess, I think it is highly plausible.
The Setup Logic: If VIX pushes up into that 14.95 - 15.13 area, that is going to send ES down a little bit — and then the pullback there is obviously going to be our catapult to the highs. I hate making calls because I do not trade my opinion, but the process tells me I should be confident this is a possibility. When we hit that $15 area, watch what price does — we know that is a good spot.
The Last Untested Weekly: 13.60. This is my last untested weekly, much lower on VIX. It is literally the leg to this high — it is the last buy. I would have a hard time believing it does not get anything, so pay attention when we come into it. It might be a good place to take profits on your longs.
🎯 Detailed Actionable Trade Plan (ES Futures)
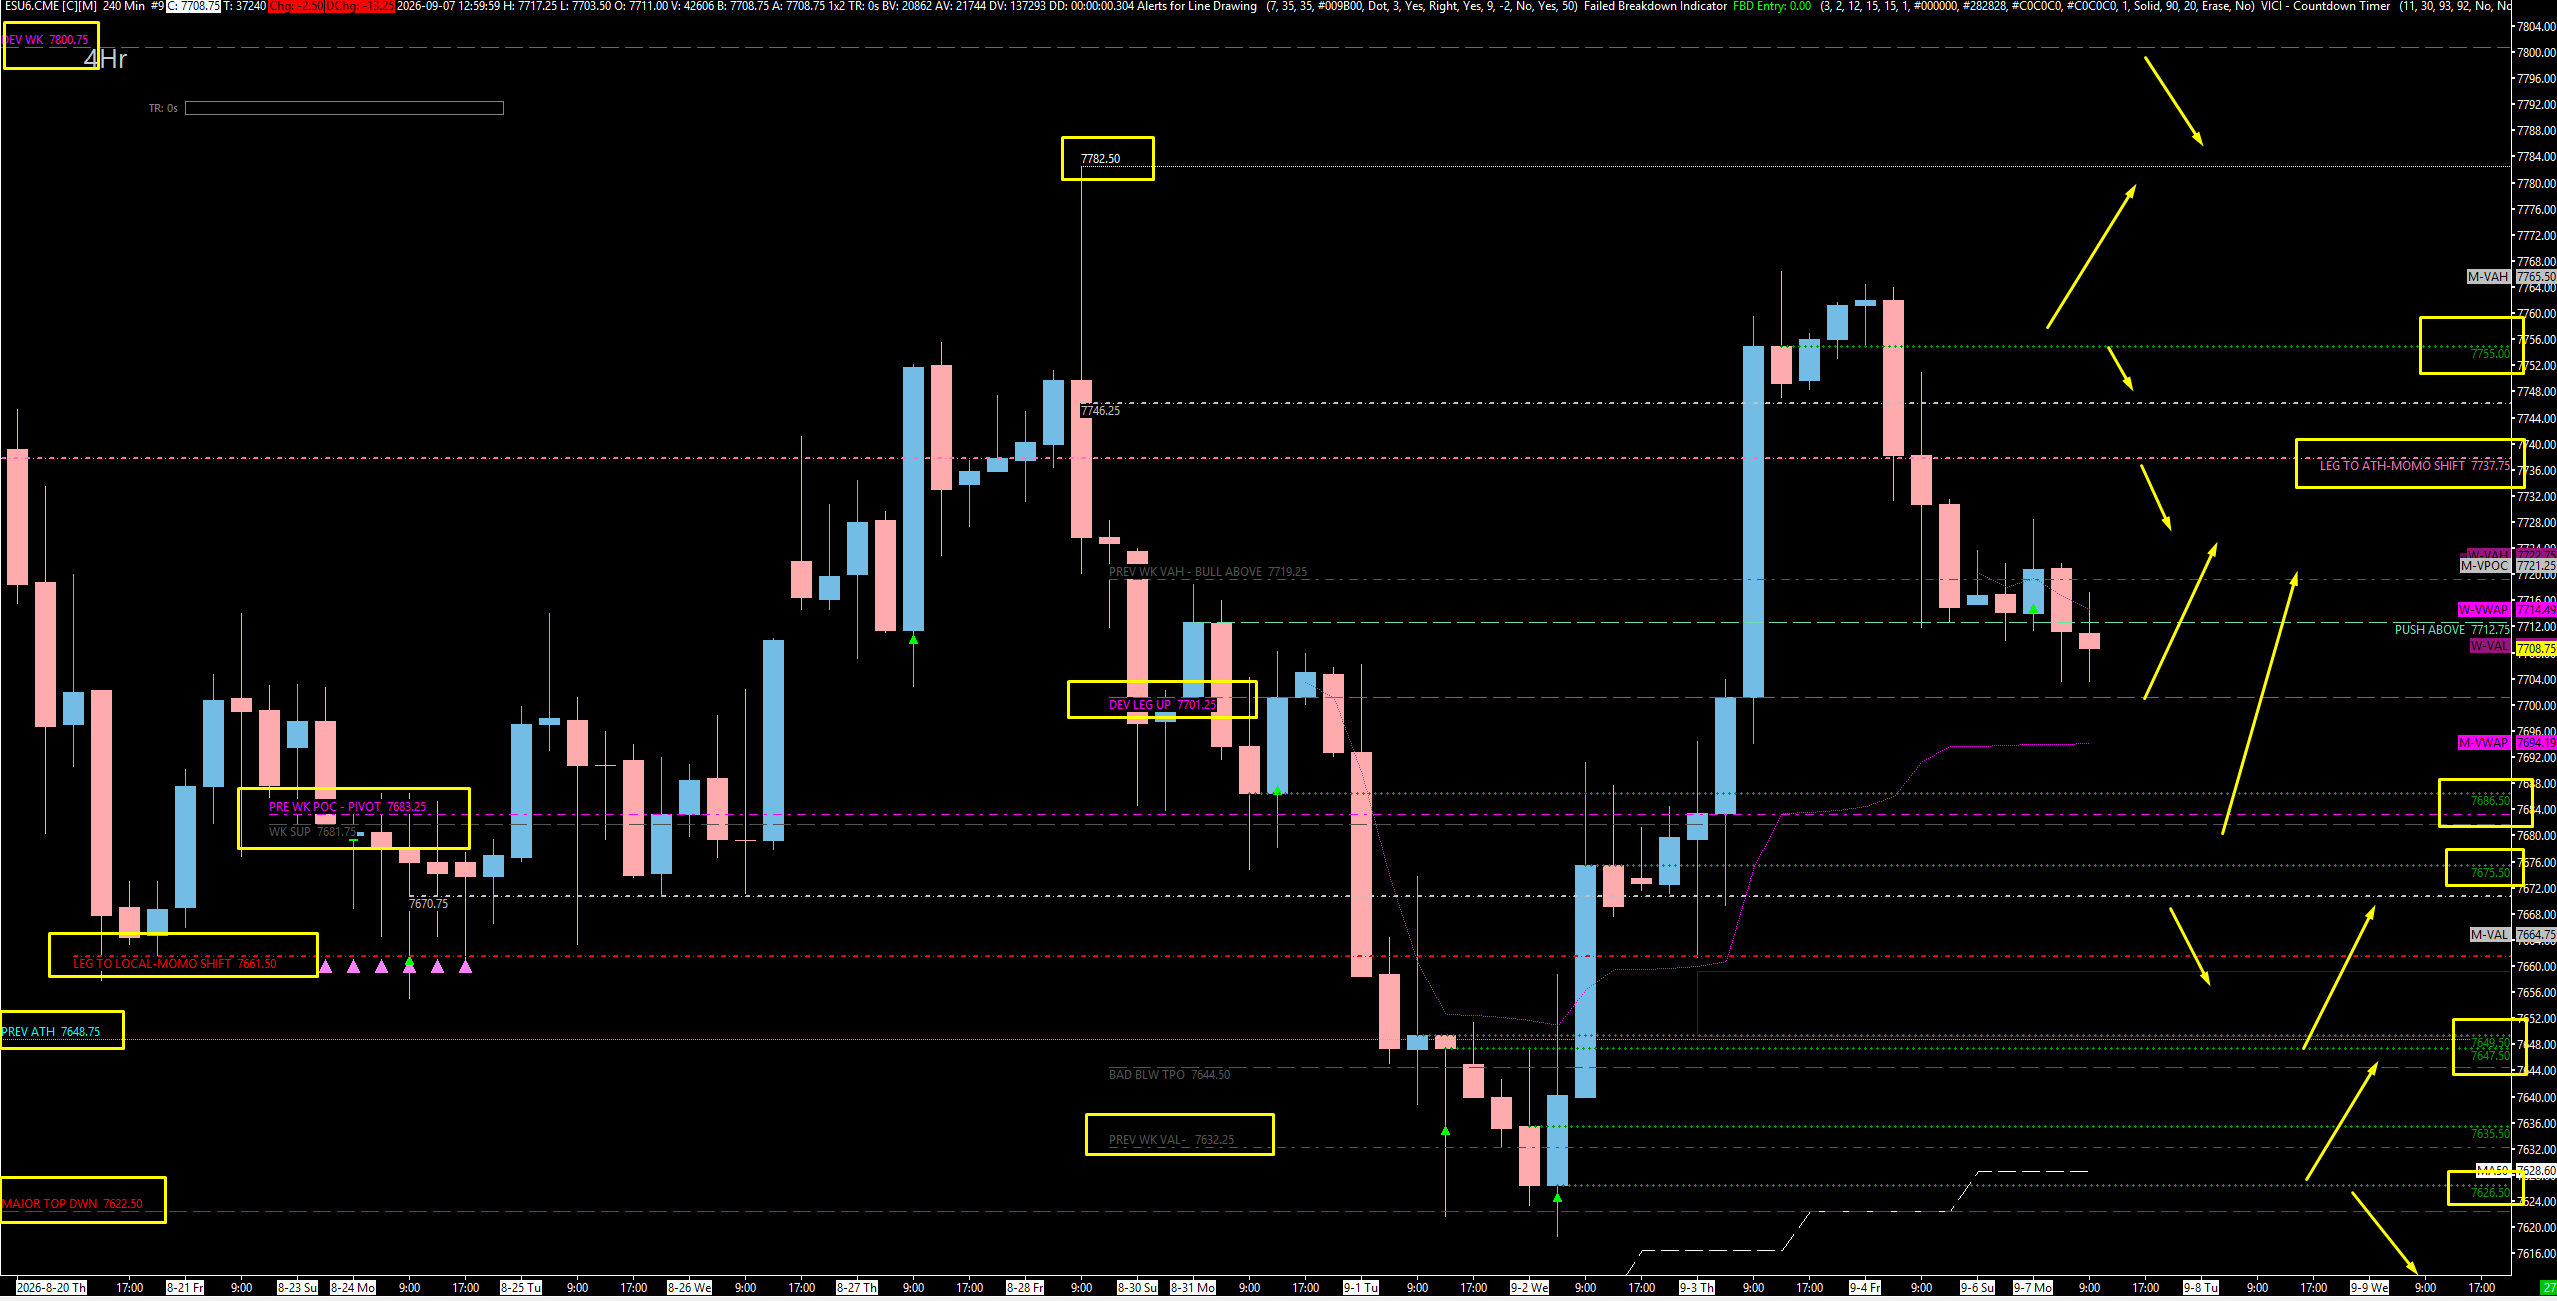
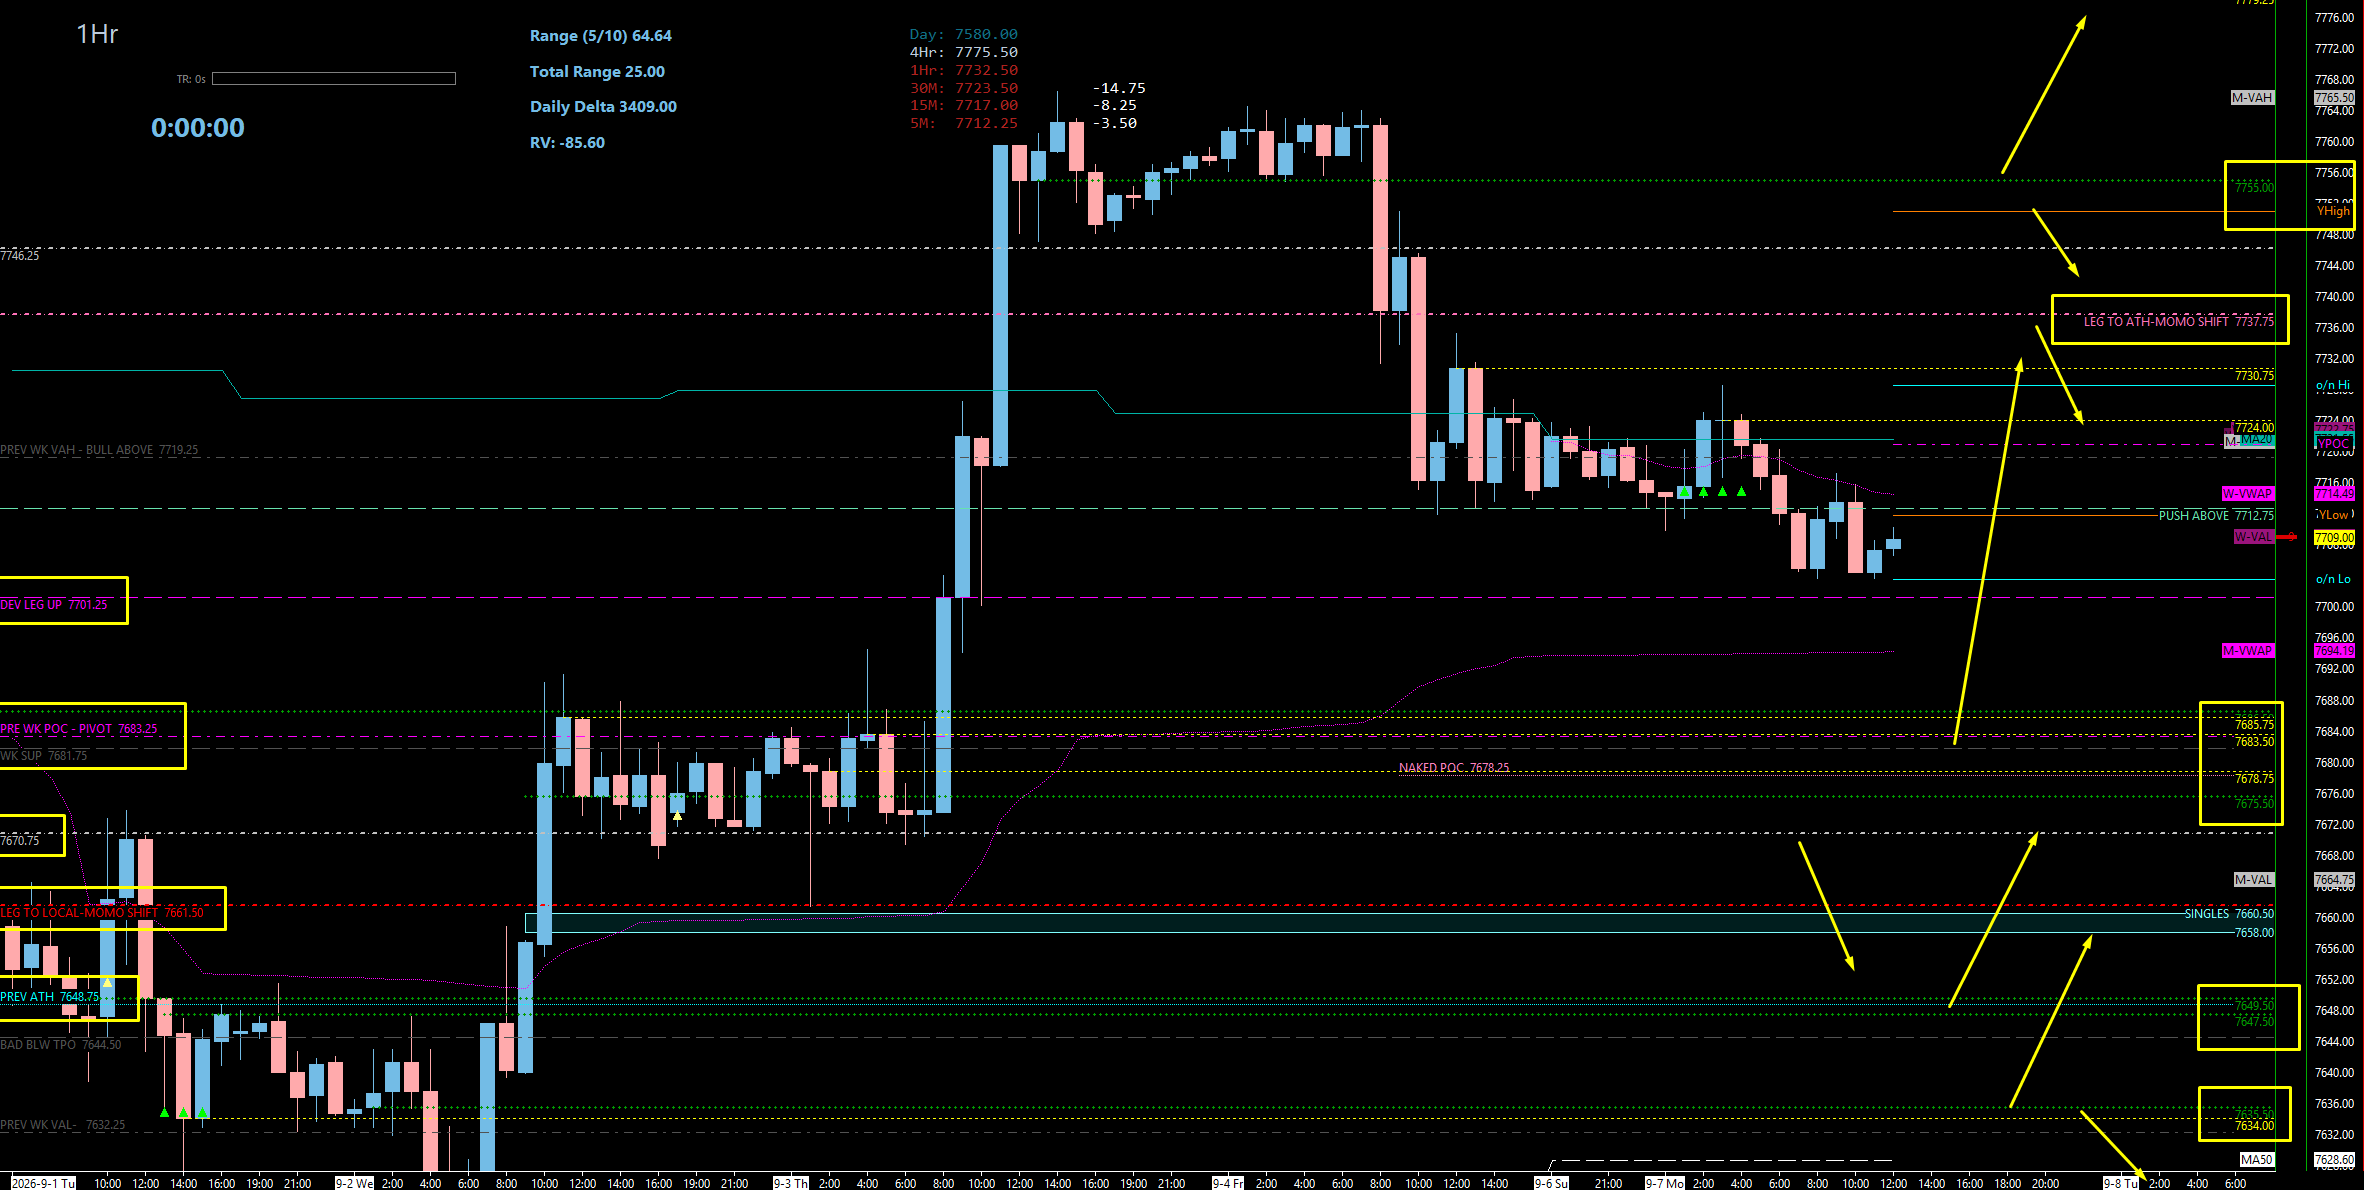
We are up on all timeframes and looking for the monster long. The whole plan comes down to the 7675 - 7686.50 zone — a roughly 12-point band with a four-hour on each end, the previous weekly point of control at 7683, a naked point of control, weekly support, and a massive accumulation area all stacked together. Play it and hold, then get back above 7701 for confirmation. Above that, 7719.25 / 7720 is our bullish trigger, and beyond it we deal with 7737 and 7755 on the way to the 7782.50 first major profit-taking area and ultimately 7800. Below the zone we start to get iffy, with the 7670 / 7661 dailies becoming the reclaim problem.
🔴 Key Resistance Zones & Setups
THE BULLISH TRIGGER — P.W. VAH & 4-Hour Leg Down: 7719.25 - 7720.00
7720.00 (Four-Hour Leg Down), 7719.25 (Previous Weekly Value Area High).
Context: When we started this I told you: if we get above 7719, we are probably going to continue to move higher. This is our bullish trigger, essentially. And check this out — right there at 7719.25 we also have a four-hour leg down at 7720, and it lines up with yesterday’s point of control on the weekly TPO. It is pretty obvious that if we get above this, we start to push.
Actionable Setup: Above 7719.25 / 7720, we are cleared for takeoff through 7775 and ultimately 7800. This is the single trigger that confirms the upside continuation from the buy zone below.
The Untested Targets: 7737.00 - 7755.00
7755.00 (Untested Daily), 7737.00 (Untested Daily).
Context: I want to correct something here, because I made a mistake on the first pass — 7737 and 7755 are not tested. So these are now targets for us rather than obstacles we have already worked through. As we start to push above 7720, these are what we have to deal with.
Actionable Setup: Take Profits: These are profit-taking markers on the way up from the buy zone. Deal with 7737 first, then 7755, and keep the runners going toward the bigger targets above.
The First Major Profit Zone: 7775.00 - 7782.50
7782.50 (Massive Target — First Major Profit-Taking Area), 7775.00 (Takeoff Path).
Context: We are coming off the weekly at 7622.50 — an absolutely perfect touch, plus it was off that 50-day moving average — and then we had a solid gain above 7646. I truly believe 7782.50 is going to be our first target and a massive one at that. Once above 7719.25, we are cleared through 7775 on the way here.
Actionable Setup: Take Profits: This is the first major profit-taking area if we do continue higher. Book size here and let the rest ride toward the objective above.
The Objective: 7800.00
7800.00 (Upside Objective).
Context: This is the call I made when we bounced off 7622.50, and I am still confident in it. This weekly just looks insanely bullish to me — it looks like we go to 7800, hit our head, do a little pullback, and end up going much, much higher.
Actionable Setup: Treat 7800 as the primary objective for this leg. We have not lost on the weekly timeframe and we are still pointed up, which is exactly why we were able to buy that low and why it worked so well.
🔵 Key Support Zones & Setups
The Confirmation Reclaim — Weekly Leg Up: 7701.00
7701.00 (Weekly Leg Up — Huge Trigger).
Context: We had a beautiful positive green candle last week, and ultimately we have a new weekly leg up at 7701. This is going to be a huge trigger for us and I want you to really put this on your chart. They could technically play it right at the open and go up, but ultimately I think this is going to be a huge pivot line for understanding context when we start to really shift momentum to the upside.
Actionable Setup: Buy Setup: If we dip lower and get back above 7701, it is very bullish. That is our confirmation that we are going to push higher, and it is the first thing I want to see after the buy zone below plays and holds.
THE 12-POINT ZONE — The Spot That Decides Everything: 7675.00 - 7686.50
7686.50 (Four-Hour), 7683.00 (Previous Weekly Point of Control), 7681.00 (The Valley), 7675.50 (Four-Hour + Naked Point of Control).
Context: This is huge support — huge. Just like I showed you on SPY and SPX, this is our massive leg down with a big shoulder right here, and we have that weekly point of control sitting inside it. On the one-hour it is even more obvious: this is the spot where we balanced all night and then took off last Thursday, and we never came back to test this area. There is a small gap fill in here, we have four-hours running across from the left, a beautiful shoulder, weekly support, and the naked point of control at 7675.50 — this is a massive accumulation area with all kinds of stuff stacked in it. I like the 7681 valley quite a bit too. It is the same look I showed you on the higher timeframes.
Actionable Setup: Buy Setup: I am looking for the 7686 area to play and hold, and then we want to get back above 7701 — that is our confirmation we are going to push higher. From there, 7720, then 7737 and 7755, and on toward 7782.50. We really want to see 7686 through 7675 play to continue our push higher. If this holds down here, we are going to come all the way back up. It looks super bullish to me, and we have a lot of reasons to like that spot, plus the process backing it.
Warning: Below 7675, we start to get a little iffy — just so you know right now. If we break this particular area, feel free to start shorting, because at that point we will have lost support.
Thursday’s Held Level & The Daily Reclaim Problem: 7661.00 - 7670.00
7670.00 (Tested Daily — Thursday’s Level We Held), 7661.00 (Daily).
Context: 7670 is Thursday’s level that we held, and 7661 sits right below it. Here is the issue: if we get below this area, we have to get back above these dailies — we have to get back above 7661 and 7670 — and you all saw how big of a support this was. So if they make it all the way down here, they may get stuck and continue to move lower. It is going to be very difficult to get back above this zone once they are below it.
Actionable Setup: This is the structural gate below the buy zone. Losing it does not just mean a deeper pullback — it means the reclaim work becomes genuinely hard, so treat a break here with real respect.
The Lower Spot: 7649.50
7649.50 (Support).
Context: If we push below 7670, we could come all the way down in here to the 7649.50 spot. This is a good spot. I like it.
Actionable Setup: Conditional Long: Watch for a reaction here on a deeper flush, but remember the reclaim problem above — getting back through the 7661 / 7670 dailies is the challenge from down here.
The Deep Levels & The Called Low: 7622.50 - 7635.50
7635.50 (Lower Support — Not My Favorite), 7626.50 (Lowest Of The Leg + 50-Day Moving Average), 7622.50 (Tested Weekly — The Called Low).
Context: We have a few other spots lower. 7635.50 is not my favorite. But 7626.50 I think absolutely gets a reaction, as it is the lowest of the leg and it also has the 50-day moving average with it. And of course 7622.50 is the low we called perfect — it had the 50-day moving average with it and the whole nine yards. That was a killer call.
Actionable Setup: Conditional Long: These are the deep-flush references. 7626.50 is the one I would expect to react down here, but understand that if we are this low, the structure above has already failed and the reclaim work is significant.
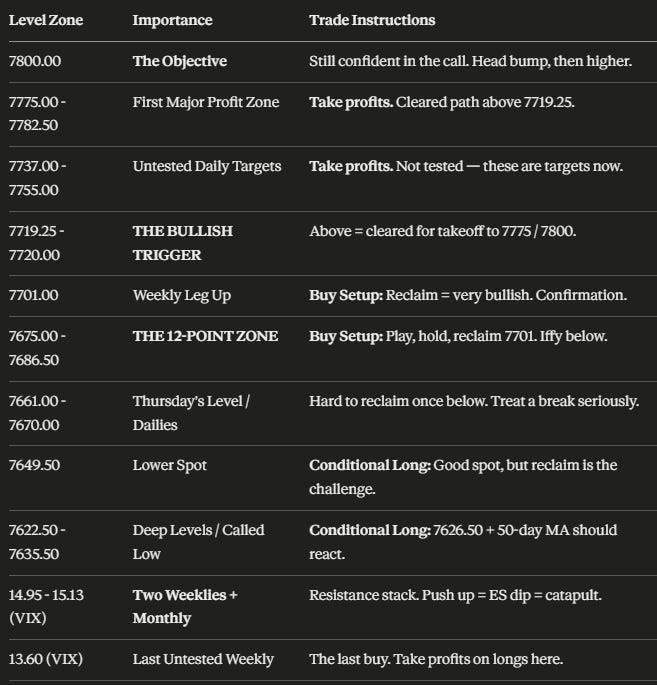
📌 Cheat Sheet – Key Levels Recap
🧠 Final Thoughts
That is it, guys — this is a killer trade plan and I have laid it all out for you. We basically have one spot, and it is about a 12-point zone: 7686.50 through 7675. It holds, we go to 7800. It does not hold, we come down. It really does not get much easier than that. That zone has a four-hour on each end, the previous weekly point of control at 7683, a naked point of control, weekly support, that beautiful shoulder, and a massive accumulation area where we balanced all night and took off last Thursday without ever coming back to test it. Play it, hold it, and get back above 7701 for confirmation. Then 7719.25 / 7720 is the bullish trigger, and above it we are cleared for takeoff through 7775 and ultimately 7800, dealing with 7737 and 7755 and taking that first major profit at 7782.50 on the way.
Now, I will say this clearly: we are up on all timeframes, so I do not recommend shorting if we start to take off. Just try to find a place to get in. Obviously if we break that particular area, feel free to start shorting, because at that point we will have lost support — and I do think we could rotate down to about 7685, which is roughly 30 to 40 points from where we are, so a little rotation into the zone is entirely possible. But if we take off from that spot, do not short.
We are going to keep a very close eye on VIX because it is going to be very important. The 14.95 - 15.13 stack of two weeklies and a monthly is the spot to watch — if VIX pops up into it, finds resistance, and rolls back toward 13.60, that pullback is our catapult to the highs. And when VIX reaches that 13.60 last untested weekly, that might be a great place to take profits on your longs.
It was a crazy week last week and I cannot wait to do it all again. It is going to be a beautiful week in the Inner Circle — I have a lot of great stuff planned, and Rob and I have some amazing products rolling out over the next month that we have been working hard on for you guys. Do not forget to sign up for the SPX Brief while spots are still open. Tomorrow is another day, I will see you in the Inner Circle, and tomorrow we will conquer the markets once again. Cheers, and have a great rest of your Labor Day.
Until next time—trade smart, stay prepared, and together we will conquer these markets!
Ryan Bailey, VICI Trading Solutions.
📊 Indicator String
Copy and paste the levels below into your S&P Edge Levels indicator to automatically plot today’s key levels on your chart:
7755.00|D|D
7737.00|D|D
7720.00|4HR|4H
7719.25|P.W. VAH|GD
7701.00|WK|W
7686.50|4HR|4H
7675.50|4HR|4H
7670.00|Tested D|TD
7661.00|D|D
7622.50|Tested WK|TW


