

📬 IMPORTANT — Check Your Spam Folder! To make sure you never miss a morning trade plan, please whitelist rbailey@vicitradingsolutions.com and info@vicitradingsolutions.com in your email client. Drag any VICI email out of Spam and into your Primary inbox so these land where they belong every single morning.
📈 Get the SPX Morning Brief — Free. Delivered to your inbox at 5:40 a.m. EST every trading day. Sign up here: https://go.vicitradingsolutions.com/spx-edge

Happy Labor Day, everyone. Today is Monday, September 7th, and I am doing something special this weekend. I have a bunch of serious NQ traders in the room who keep asking me to do the levels on the Nasdaq, and I know I’m a few weeks behind on that — I sincerely apologize, and I hope this helps make up for it. This is a very rare, very special edition: a full weekend review of NQ. We are going to walk through the weekly profiles, talk about the inefficiencies sitting in the dailies, and lay out my thought process on what could potentially happen for NQ this week. Don’t get used to it — I am so focused on ES and everything else that NQ unfortunately gets the back burner sometimes — but this one is for you guys, and to be quite frank, it is a significantly different picture than ES.
Friday’s close left us literally right smack in the middle of value on a multi-week, monthly composite — NQ is truly in balance once again. We are holding on top of our big momentum shift pivot at the previous weekly point of control at 29509.00 and the 29526.00 Weekly, with the 29648.00 Daily directly overhead keeping the lid on things. The catch: after checking every timeframe, we are pointed down across the board — Weekly, Daily, and 4-Hour — and the market has not gained on a single one of them yet.
A Note on This Week’s Market:
News: Markets are closed today for Labor Day. This plan is built for Tuesday’s open — I’ll see you in the room tomorrow as we get back to conquering the markets.
Value: Friday’s close sits directly in the middle of a multi-week, monthly composite value area. NQ is truly in balance. Above the previous weekly point of control at 29509.00 we lean bullish; below it, there is a lot of room to rotate down and fill inefficiencies.
Inefficiencies: There are some really big holes in the profile and a very thin low-volume area underneath the previous weekly POC, with singles on the daily TPO running down to 29380.00. All of this will more than likely need to get filled in.
Trend: Down on the Weekly, Daily, and 4-Hour timeframes. By higher-timeframe standards we are pointed down, and the market has not gained on any timeframe. We really should still be looking for shorts on NQ until that changes — remain cautious with longs.
Momentum Pivot: The 29526.00 Weekly leg to the all-time high and the previous weekly POC at 29509.00. Bullish above, bearish below. This is the big above/below for the week.
🧠 Current Market Context
The Monthly Composite Balance & The Lost Timeframes
Pulling up the weekly TPO, I stacked together almost an entire month of overlapping value areas so we can see where we are in the bigger picture. We closed Friday directly in the middle of that multi-week, monthly composite — truly in balance once again, even for NQ. Underneath the previous weekly point of control, I have reason to believe we can rotate lower and start to clean up the inefficiencies in this profile. There are some really big holes here and a very thin low-volume area that will more than likely need to get filled in, and it makes sense from a support perspective as well. So the previous weekly POC at 29509.00 is our big above/below: it is massive support for us, it is paired with a Weekly level at 29526.00, and together they truly represent a big momentum shift pivot for me. Above the previous weekly Value Area High, I do see price continuing to move up — however, we have daily structure directly above that at 29648.00. The previous weekly Value Area Low is really bearish below; as long as they stay above it, we continue to stay on the bullish side of things. And on the composite, the Value Area Low at 29261.00 is a spot I like, with serious daily support right there as well. Bottom line: above the previous weekly POC, we are bullish. It is not necessarily bearish underneath it, but they certainly have a lot of room to rotate down to fill this stuff in — and then, of course, those lower areas have to hold.
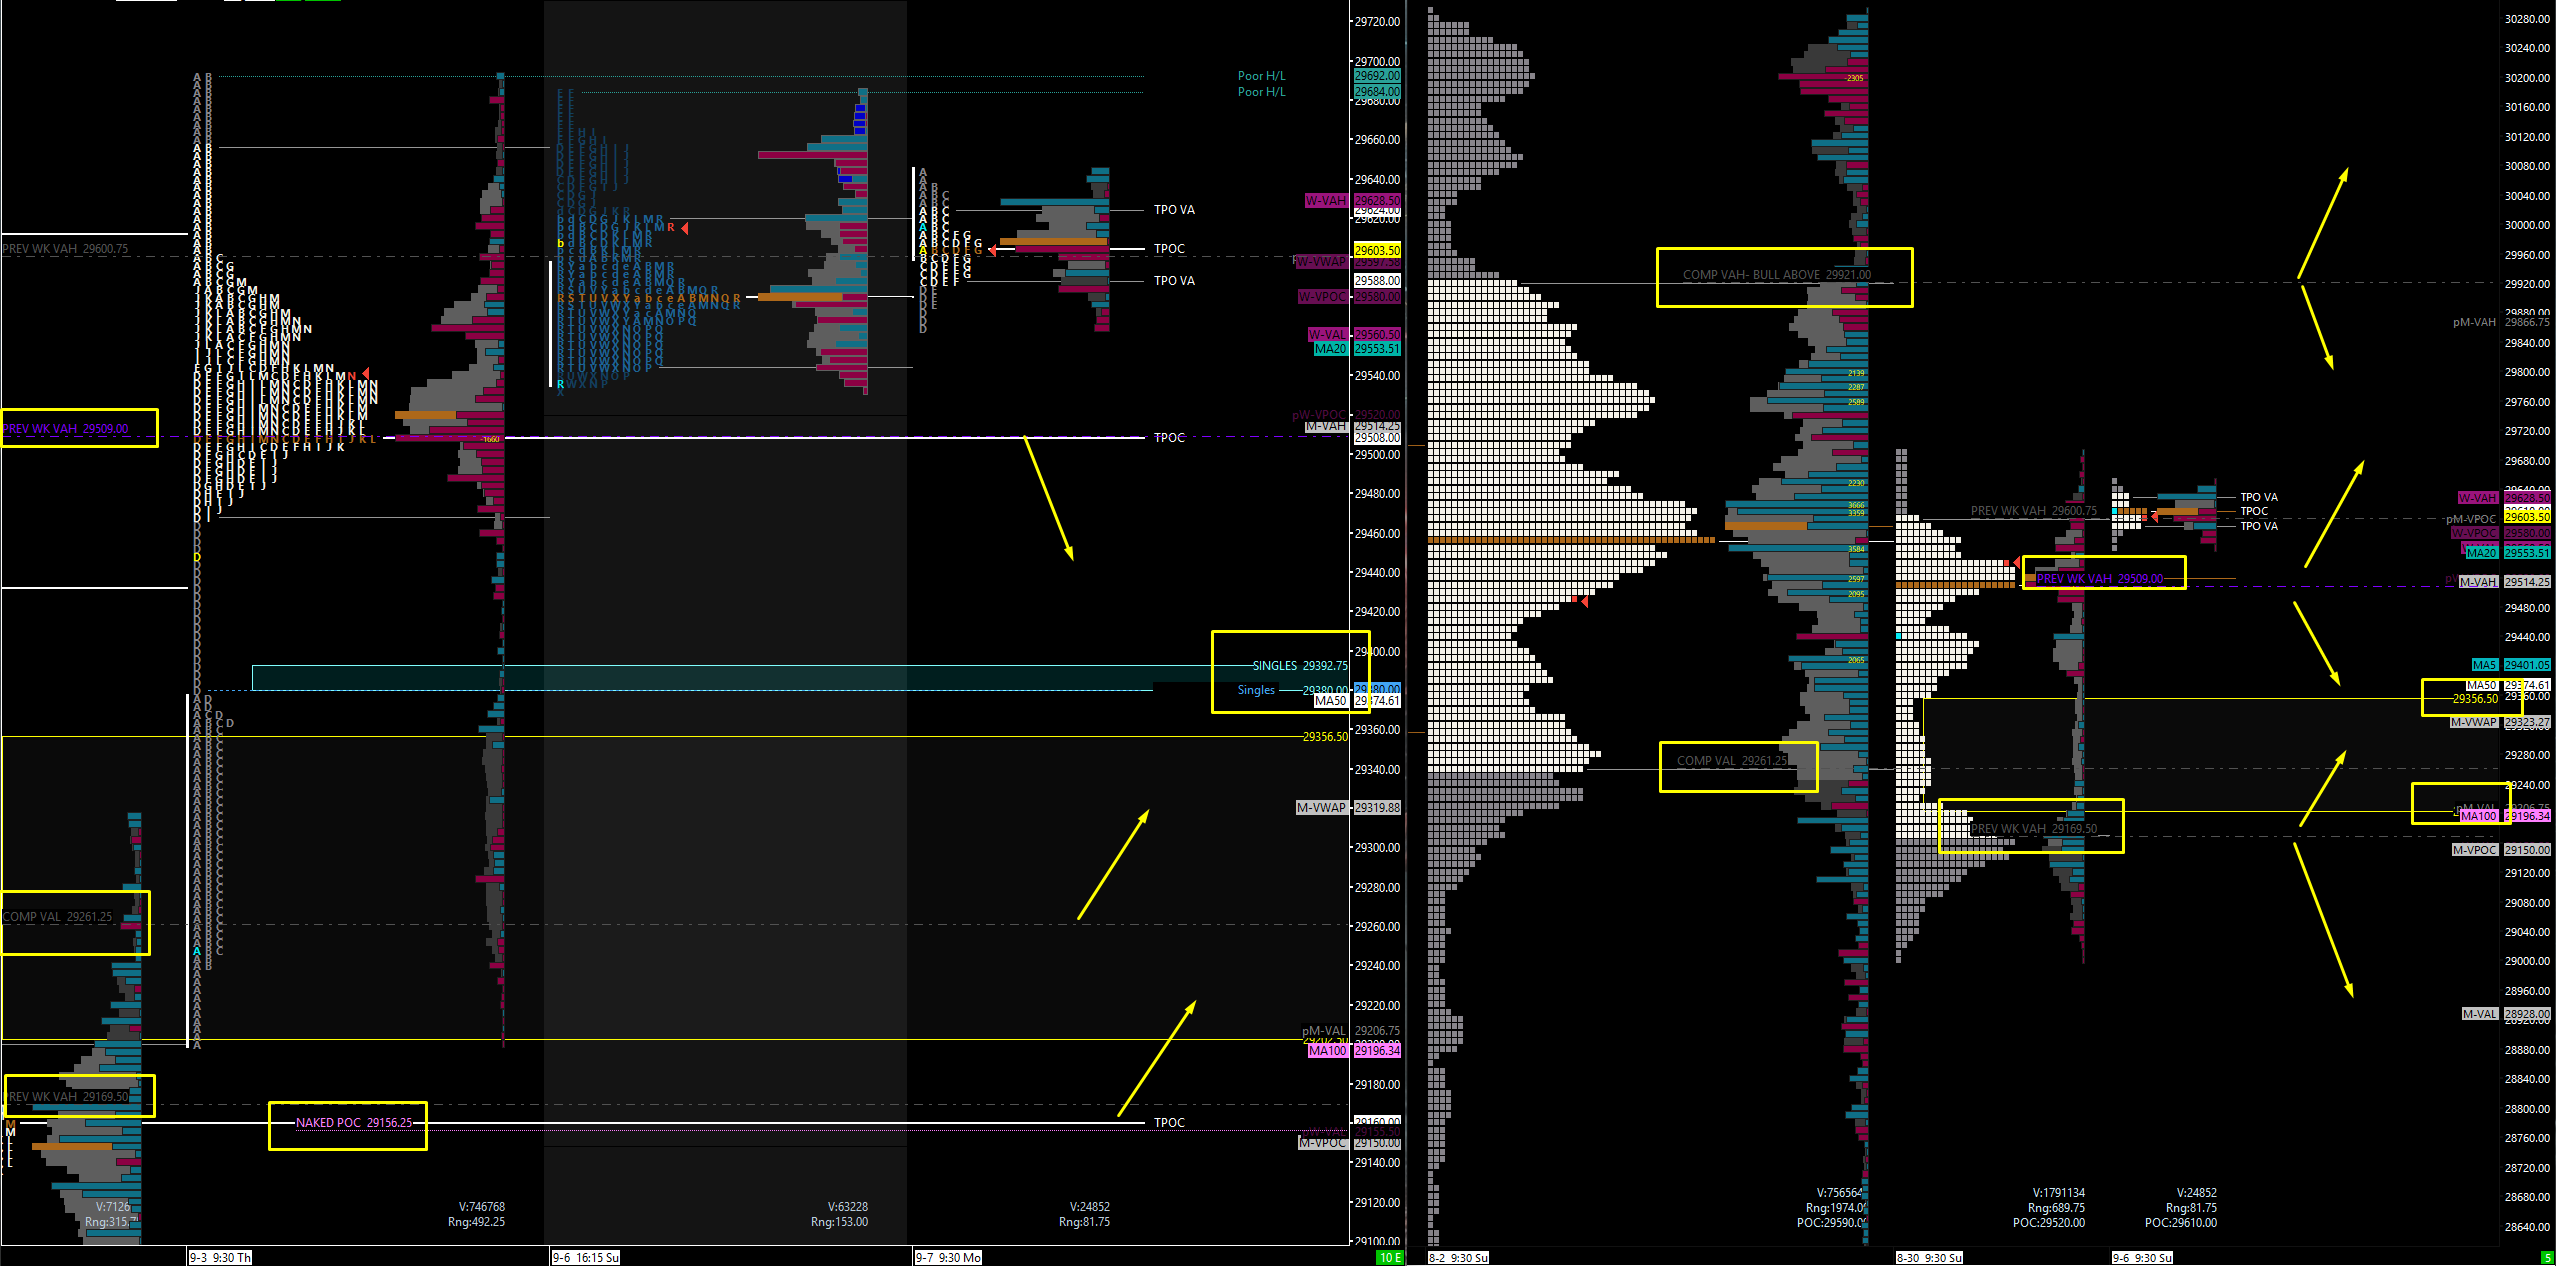
The daily TPO was really interesting. Last Thursday we had a massive push up, and I merged two overlapping profiles together — there is a huge area up top and then singles basically all the way down to 29380.00, an inefficiency for us to fill in. I like this a lot, because we have more daily support directly below that area, and I just think it’s quality. Once they clean these inefficiencies up, we should see some support in there, and then they could get a pop. Obviously, they could always come down and fill this area — it is possible for sure.
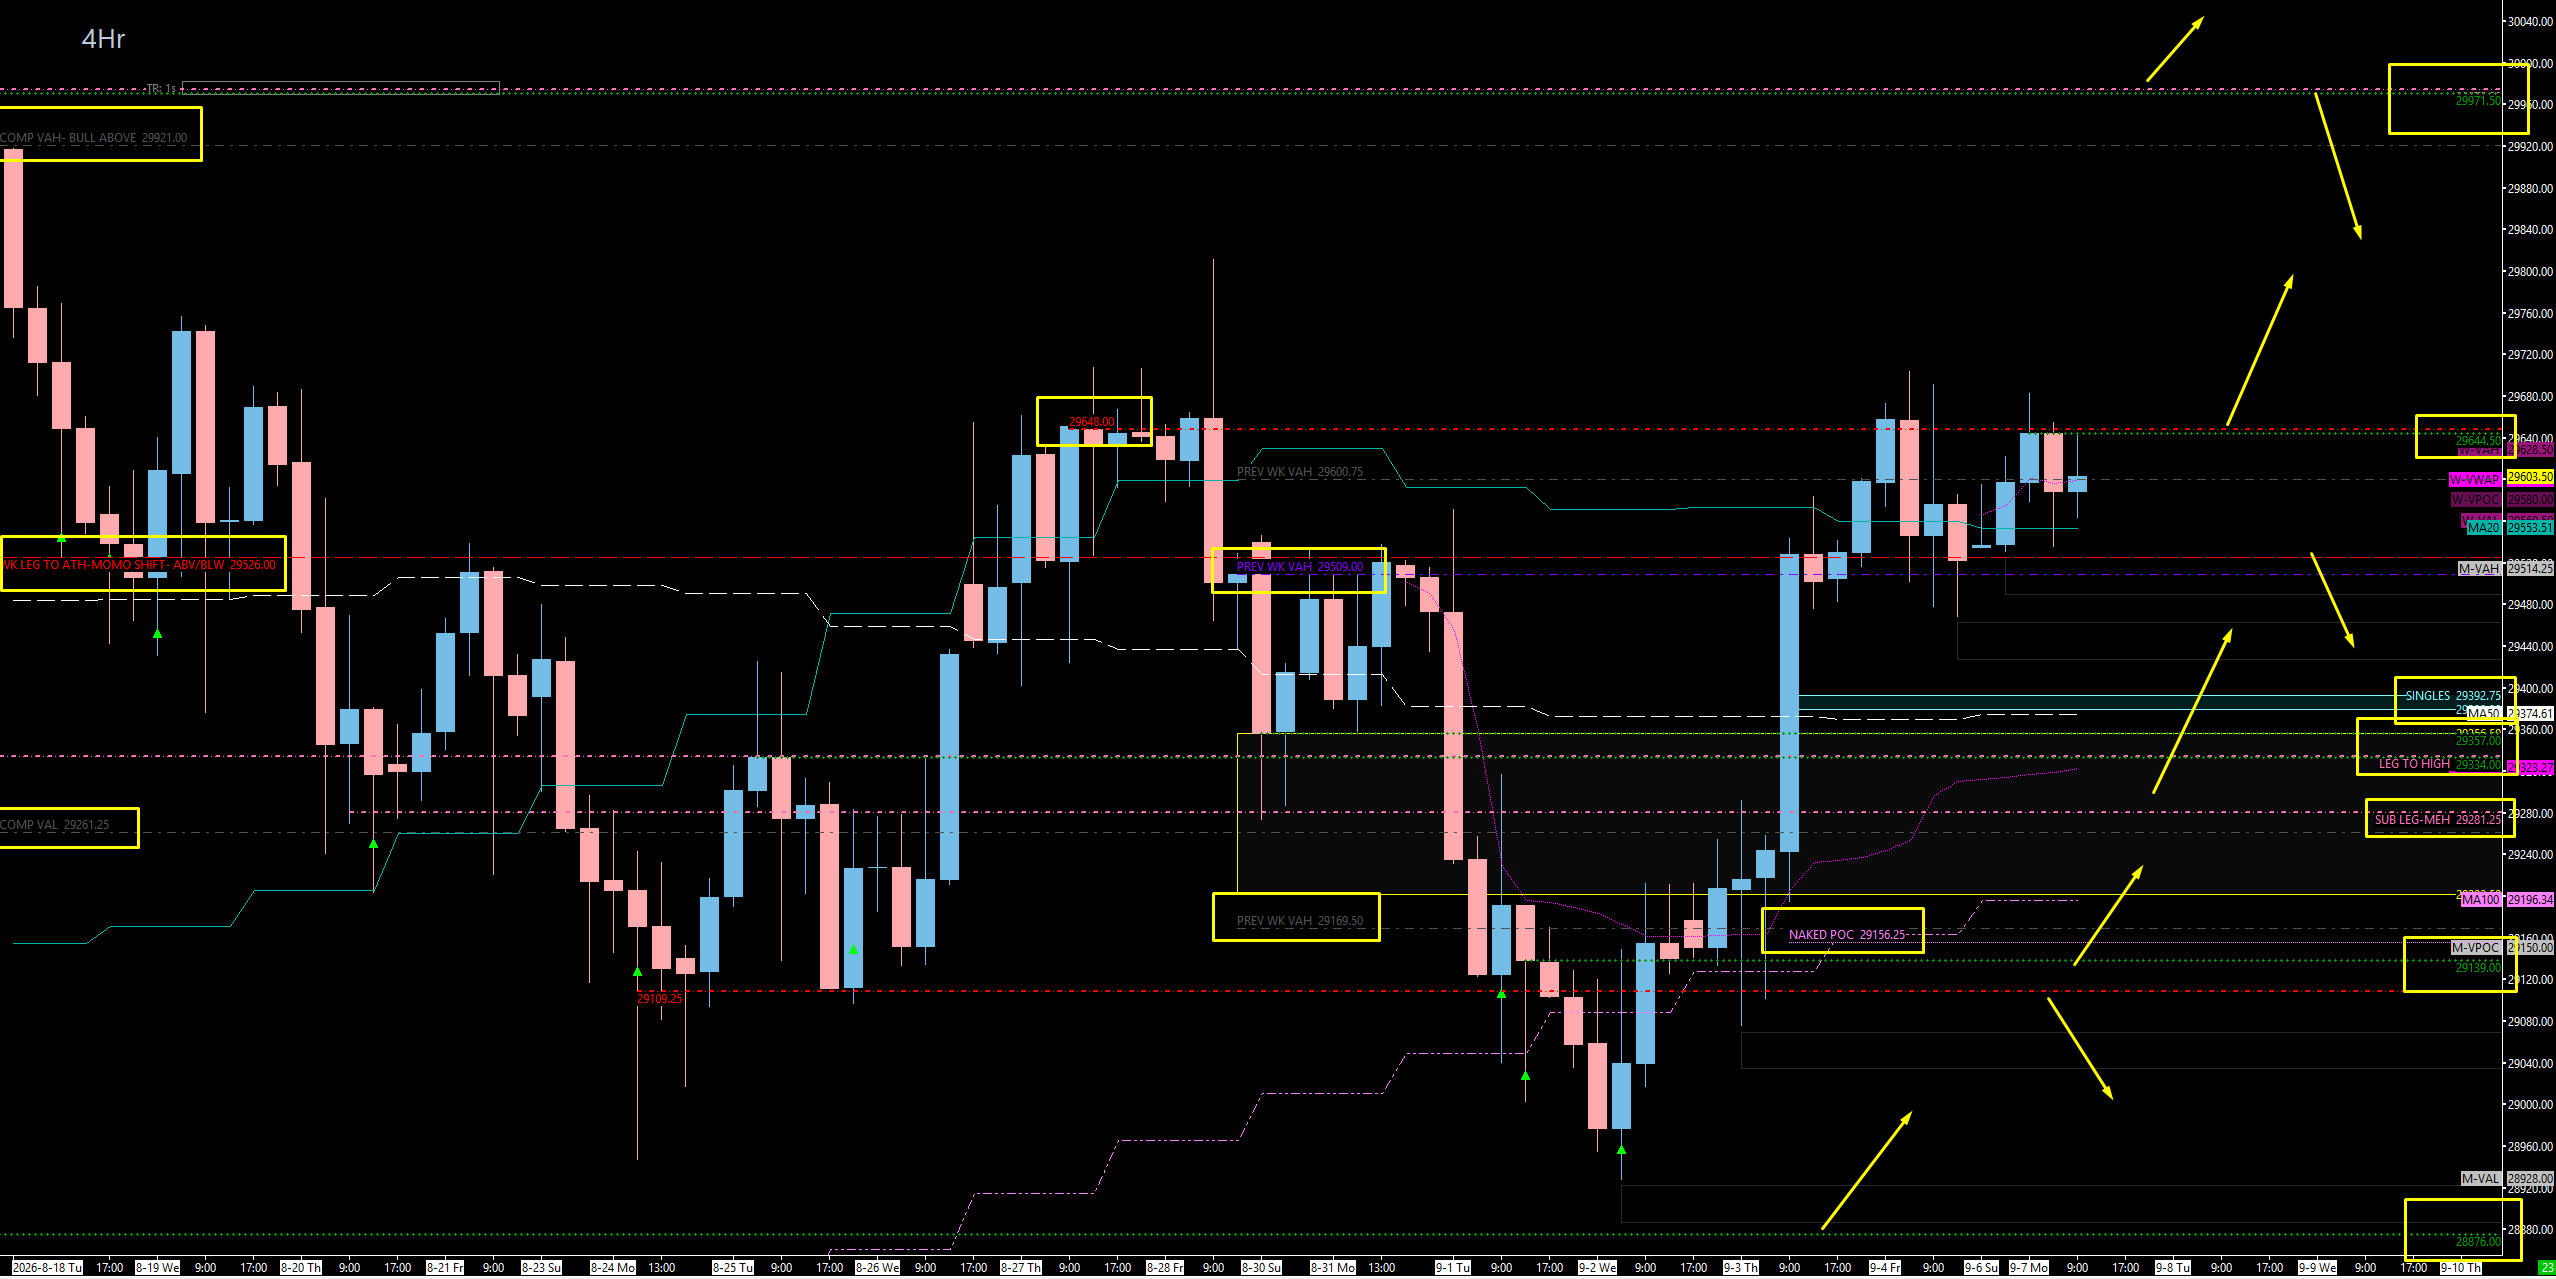
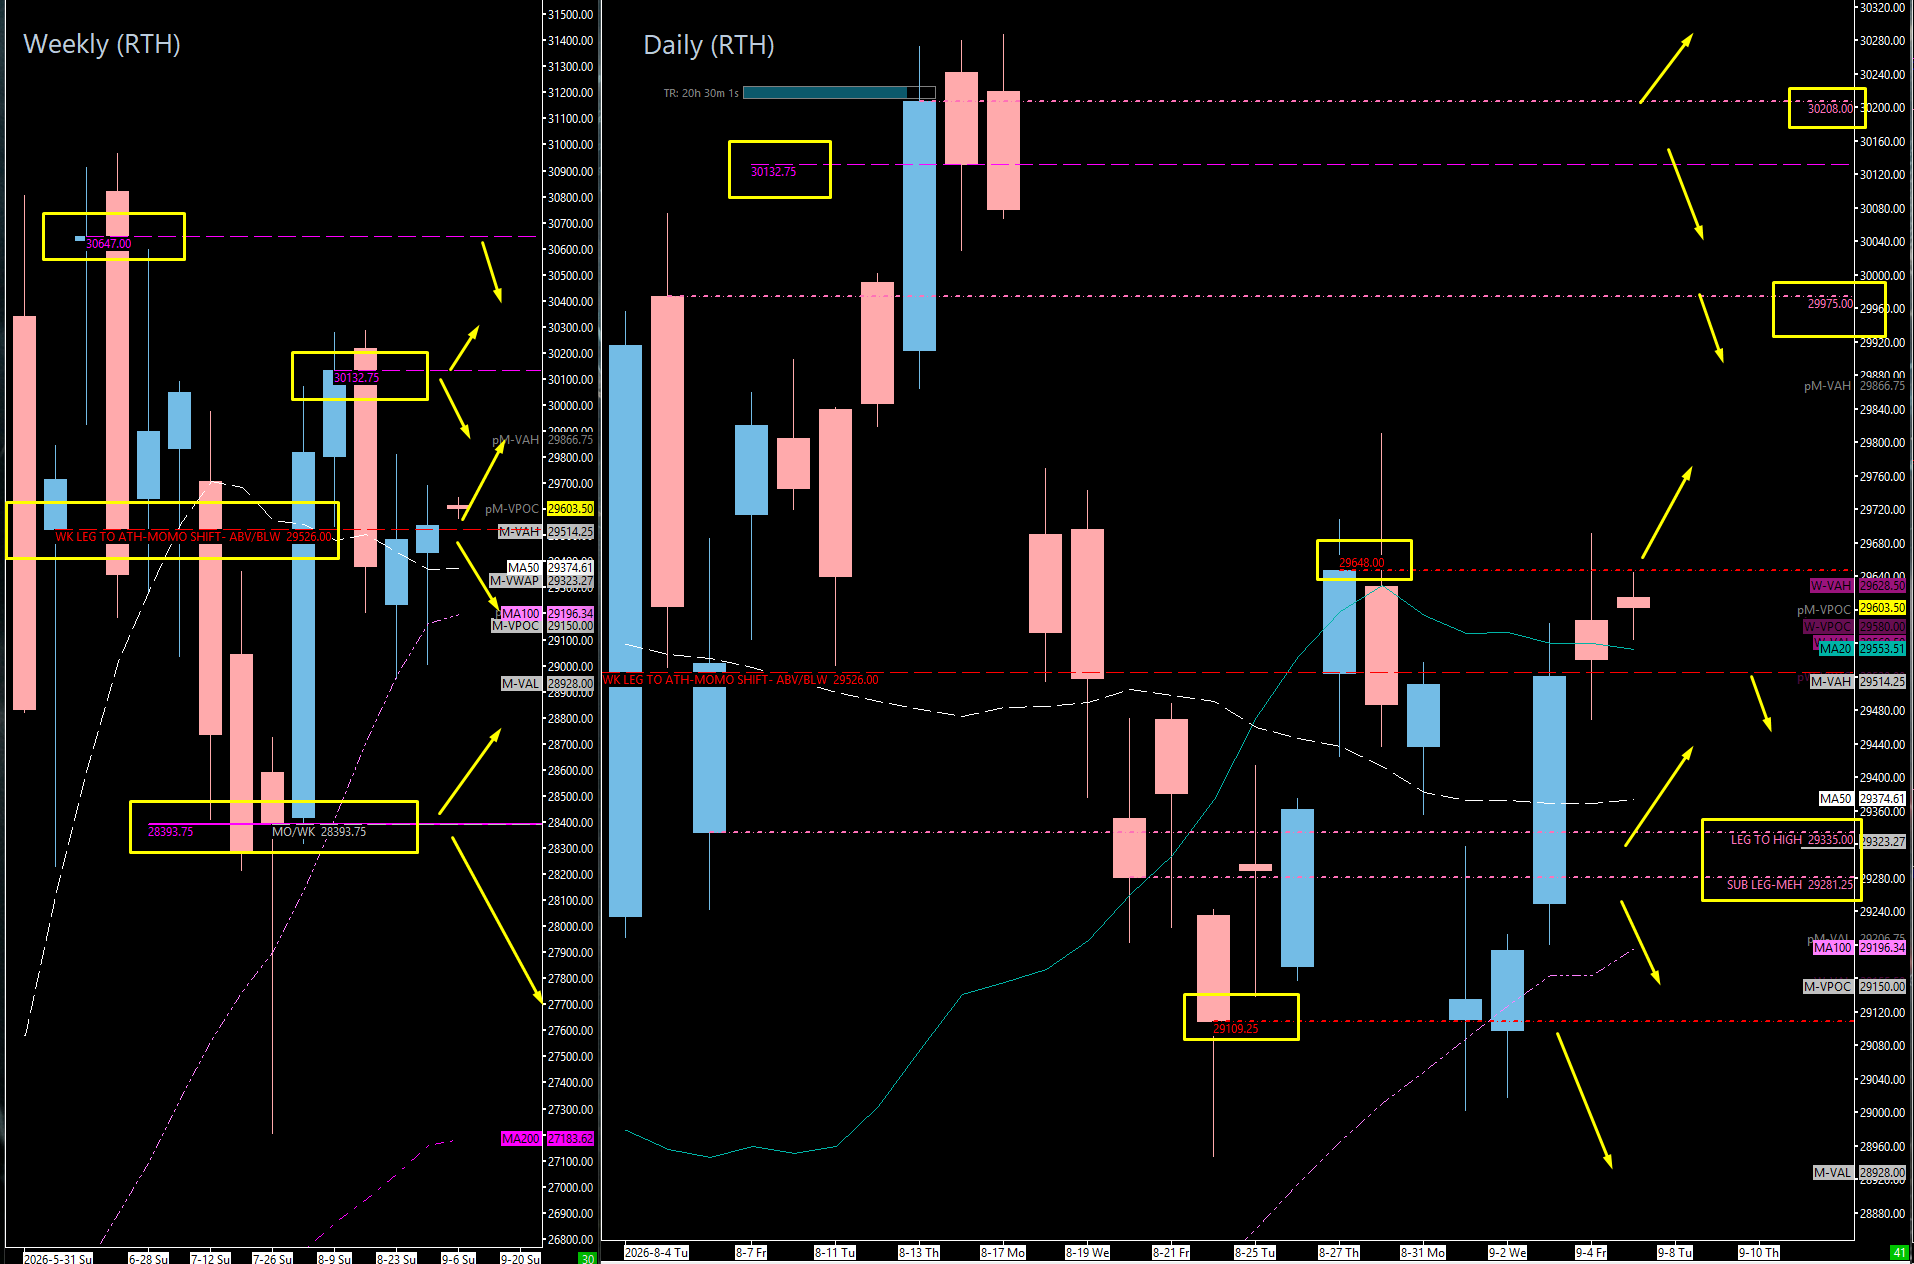
Now here is where NQ looks significantly different than ES. On the Weekly, we clearly closed below the leg to the high — we have lost on the Weekly timeframe. On the Daily, they had an opportunity to regain both Thursday and Friday and couldn’t get it done. They needed to close back above 29648.00 to really seal the deal for a gain on the Daily timeframe, and they did not. And when I pulled up the 4-Hour, I’ll be honest with you — at a glance I thought they had gained, and they did not. They had one, two, three, four opportunities to poke above the 4-Hour they needed to gain and could never close above it, not even by a tick. Then on the next leg, they still couldn’t close above it. So technically, right now, we are pointed down across all timeframes — Weekly, Daily, and 4-Hour. Pretty unbelievable. What they did do is sweep the low underneath the daily shoulder, grab some serious liquidity, and squeeze all the way back up. That sweep was a significant momentum shift just being below it, and now they cannot gain. That is a big deal, and it is exactly why I keep telling everyone to remain cautious when looking for longs here. It doesn’t mean it can’t go up — they could certainly go up right now because they are holding this area, and I like the support structure below us a lot. But we are continuing to make new lows on the higher timeframes, we can’t gain, and that means we could absolutely roll down to our first level of support to try again — either to finally put a gain in, or to fumble and come on down.
🎯 Detailed Actionable Trade Plan (NQ Futures)
We are going to use the 29526.00 Weekly leg to the all-time high and the previous weekly POC at 29509.00 as our big momentum shift pivot to understand whether we are going to continue the move higher. Above that pivot, the 29648.00 Daily is what takes us up. Below that pivot, there is plenty of room to rotate lower and clean up inefficiencies into the massive daily shoulder — and remember, until they gain on a timeframe, we really should still be looking for shorts with NQ. Longs are for the sweeps and reclaims at the structural edges only.
🔴 Key Resistance Zones & Setups
The Lid: 29648.00
29648.00 (Big Daily / Daily Gain Level).
Context: This is the big Daily that is really keeping the lid on things. They needed to close back above it Thursday and Friday to seal a gain on the Daily timeframe and could not get it done. This is also where I would be taking major profits on any long off the pivot below.
Actionable Setup: If price pushes above 29648.00, we should be able to get some continuation higher into the 29791.00 – 29796.50 reaction zone. This is where the Daily gain finally gets sealed. Below it, the lid holds and we keep leaning on the pivot underneath us.
The First Reaction Zone: 29791.00 – 29796.50
29796.50 (1-Hour), 29791.00 (Big Reaction Spot).
Context: Above our pivot we are bullish, with a 1-Hour all the way up at 29796.50 that will more than likely get a reaction. 29791.00 is going to be our big spot up here — just from experience, more than likely this is the spot that gives us a big reaction.
Actionable Setup: If we get above 29791.00 and it plays, we could come back down, hold it, and continue higher. But if this area plays and price gets back below it, we could really start to come down. Let it prove itself either way.
The Massive Daily & Composite Value Area High: 29971.00
29971.00 (Massive Daily / Composite Value Area High / Bullish-Above Pivot).
Context: This is a massive Daily, and really a very similar-looking ordeal to the head and shoulders we called out on ES and the S&P. This looks like a massive spot to me, and I would certainly be looking for a big reaction here. The composite Value Area High also sits right here as a bullish-above pivot — this is essentially where things really start to shift in the favor of the Bulls, big time, from the very high timeframe.
Actionable Setup: Expect a big reaction on first touch. A rejection here keeps the head-and-shoulders look alive and the higher-timeframe downside intact. Acceptance above 29971.00 hands control to the Bulls and opens the upper targets.
The Upper Targets: 30132.00 – 30208.00
30208.00 (Last & Final Untested Daily), 30132.00 (Big Weekly).
Context: Above 29971.00, we still have a big Weekly at 30132.00 and our last and final untested Daily at 30208.00, which we should certainly not take for granted.
Actionable Setup: If 29971.00 gets accepted, these are the next targets in sequence. Watch for first-touch reactions at each.
🔵 Key Support Zones & Setups
The Momentum Shift Pivot: 29491.00 – 29526.00
29526.00 (Weekly / Leg to the All-Time High), 29509.00 (Previous Weekly POC / Massive Support), 29491.00 (1-Hour).
Context: This is our big major pivot, and I think it’s pretty clear with this Weekly and the previous weekly point of control. The Weekly at 29526.00 is literally the leg to the all-time high — we are bullish above it and bearish below it. We continue to flirt with this area, and that is exactly why it is so important and will continue to be important time and time again. The previous weekly POC at 29509.00 is massive support for us. Below this area we can slip lower, and below the previous weekly Value Area Low things get really bearish.
Actionable Setup: Buy Setup: The way I’d want to see this play is the 1-Hour at 29491.00 play — it could potentially save the day — and price get back above the Weekly at 29526.00 for the continuation higher, taking major profits into the 29648.00 Daily area.
Warning: Once we push below the previous weekly POC and this other big Weekly, we really start to shift momentum. It is not necessarily over below here, but they have a lot of room to rotate down and fill inefficiencies — and we have not gained on a single timeframe.
The Daily Shoulder & Inefficiency Fill: 29344.00 – 29357.00
29357.00 (Untested 4-Hour), 29355.00 (Daily / Beautiful Shoulder), 29348.00 (50-Day Moving Average), 29344.00 (4-Hour). The Monthly VWAP is also creeping up into this area.
Context: The singles on the daily TPO run down to 29380.00, and this is the serious daily support sitting directly below them. The 29355.00 Daily is a beautiful shoulder — I really like this. The 4-Hour at 29357.00 is certainly untested and could potentially play; it played nicely from the top down previously. The 50-day sits right by the singles, and the Monthly VWAP creeping up here is a big sign for monthly value. This whole structure was created by the massive move up, so this is our support, and we really want to see this area hold.
Actionable Setup: Buy Setup: What I’d really like to see happen is the 29355.00 Daily and the 29344.00 4-Hour play and price get back above 29357.00. That can take us right back into the previous weekly POC at 29509.00 and the big Weekly at 29526.00, and potentially higher.
The Lower Shoulder & Composite Value Area Low: 29261.00 – 29281.00
29281.00 (Tested Daily), 29261.00 (Composite Value Area Low).
Context: I’m a little iffy on the 29281.00 Daily, but it’s still there and I can’t ignore it. I like the structure, and it played a lot of times, both above and below — lots of times on the underside. That makes the whole area from 29355.00 down to 29281.00 one big, massive daily shoulder that, in my opinion, will more than likely get some serious love. The composite Value Area Low at 29261.00 sits right underneath it, and I like that spot.
Actionable Setup: Buy Setup: If 29281.00 plays, we need to get back above 29344.00 for our push higher. That is really the big spot for me, guys.
Warning: We are down on the Weekly and the Daily. Let the reclaim confirm before you commit.
The Nasty Lasties: 29109.00 – 29196.00
29196.00 (100-Day Moving Average), 29139.00 (Last Untested 4-Hour), 29109.00 (Massive Tested Daily). There is also a 1-Hour level and a naked daily point of control down in this area.
Context: If we do end up coming lower, this is the one last 4-Hour we can pay attention to, and I actually like 29139.00 quite a bit — it is very close to the 100-day at 29196.00, with a naked point of control on the daily timeframe down there as well. The 29109.00 Daily is very tested, but it is the lowest support in this structure. This is the nasty lasties: 29139.00 is essentially the last untested area that could hold this structure up, and 29109.00 is ultimately our big support spot.
Actionable Setup: We have to get below 29109.00 in order to move lower. Hold here and the shoulder structure survives.
Warning: This is where everything really goes south if they can’t hold this area.
The Sweep & Reclaim: 28876.00
28876.00 (4-Hour).
Actionable Setup: Sweep Setup: Below 29109.00, we have a really nice 4-Hour spot after a sweep at 28876.00. This would be a great sweep of the low and a reclaim.
The Monster: 28607.00 – 28651.00
28651.00 (Untested Monthly Leg Up / 4-Hour), 28607.00 (Daily). Double back-to-back 4-Hours sit directly below.
Context: A little lower, we have two or three really huge spots that I like. This is a massive shoulder — it is where the leg turned up on the push higher, and there is a massive amount of support in here. The double 4-Hours below give me a lot of confidence in terms of support, and it all lines up really nicely with the untested Monthly leg up at 28651.00. This area is a freaking monster, without a doubt.
Actionable Setup: Buy Setup: This is a great spot to take a poke. If price ends up gravitating down here, pay very close attention — this will more than likely get a pretty significant reaction.
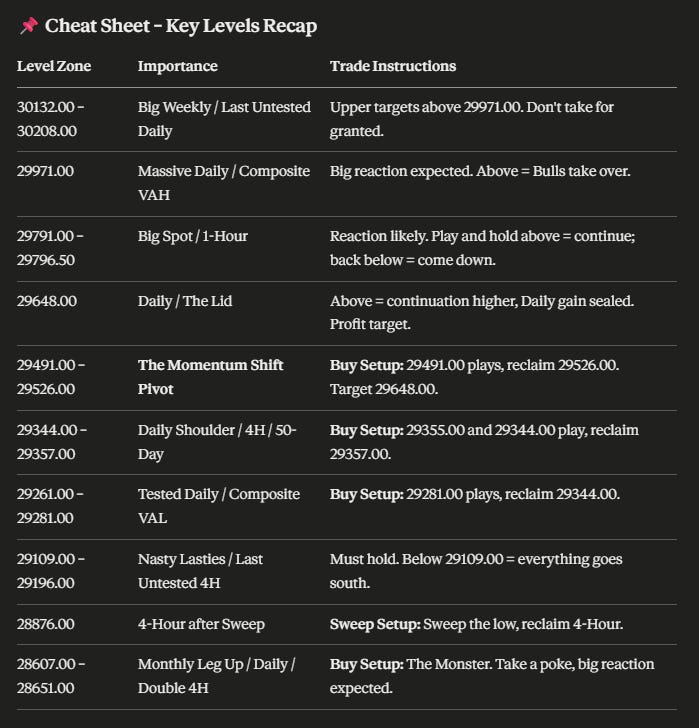
📌 Cheat Sheet – Key Levels Recap
🧠 Final Thoughts
So that is how I’ve laid it out for you guys — it is pretty crispy and pretty clear. NQ is sitting in the middle of a multi-week composite, truly in balance, and yet pointed down on the Weekly, the Daily, and the 4-Hour with no gain on any of them. As much as this looks like it wants to continue higher, I just tell everyone to remain cautious. We really should still be looking for shorts on NQ until they prove otherwise, and the way they prove it is simple: hold the 29526.00 Weekly leg to the all-time high and the previous weekly POC at 29509.00, then push through the 29648.00 Daily. Do that, and the 29791.00 – 29796.50 zone and ultimately the massive 29971.00 Daily come into play — and above 29971.00 is where the Bulls take over from the very high timeframe.
Lose the pivot, and don’t panic — there is a lot of room to rotate lower and clean up those inefficiencies down to 29380.00, and the massive daily shoulder from 29357.00 to 29281.00 is where I expect some serious love. Below that, 29139.00 and 29109.00 are the nasty lasties that must hold, and if they don’t, the 28651.00 Monthly leg up is a monster waiting underneath. Let the levels play, wait for the reclaims, and let the market gain a timeframe before you get aggressive. I hope you all enjoyed this very rare, very special NQ edition — I’ll see you in the room tomorrow.
Until next time—trade smart, stay prepared, and together we will conquer these markets!
Ryan Bailey, VICI Trading Solutions.
📊 Indicator String
Copy and paste the levels below into your S&P Edge Levels indicator on your NQ chart to automatically plot this week’s key levels:
30208.00|D|D
30132.00|WK|W
29971.00|D|D
29796.50|1HR|1H
29648.00|D|D
29526.00|WK|W
29491.00|1HR|1H
29357.00|4HR|4H
29355.00|D|D
29344.00|4HR|4H
29281.00|Tested D|TD
29139.00|4HR|4H
29109.00|Tested D|TD
28876.00|4HR|4H
28651.00|MO|M
28607.00|D|D


