

Top of the morning, everyone, and welcome back. It is time for the Weekend Review, and I am so happy to bring this to you because last week was phenomenal. I personally had a stellar week, and we had a lot of people in the Inner Circle who kept it rolling right along with me — congratulations to all of you.
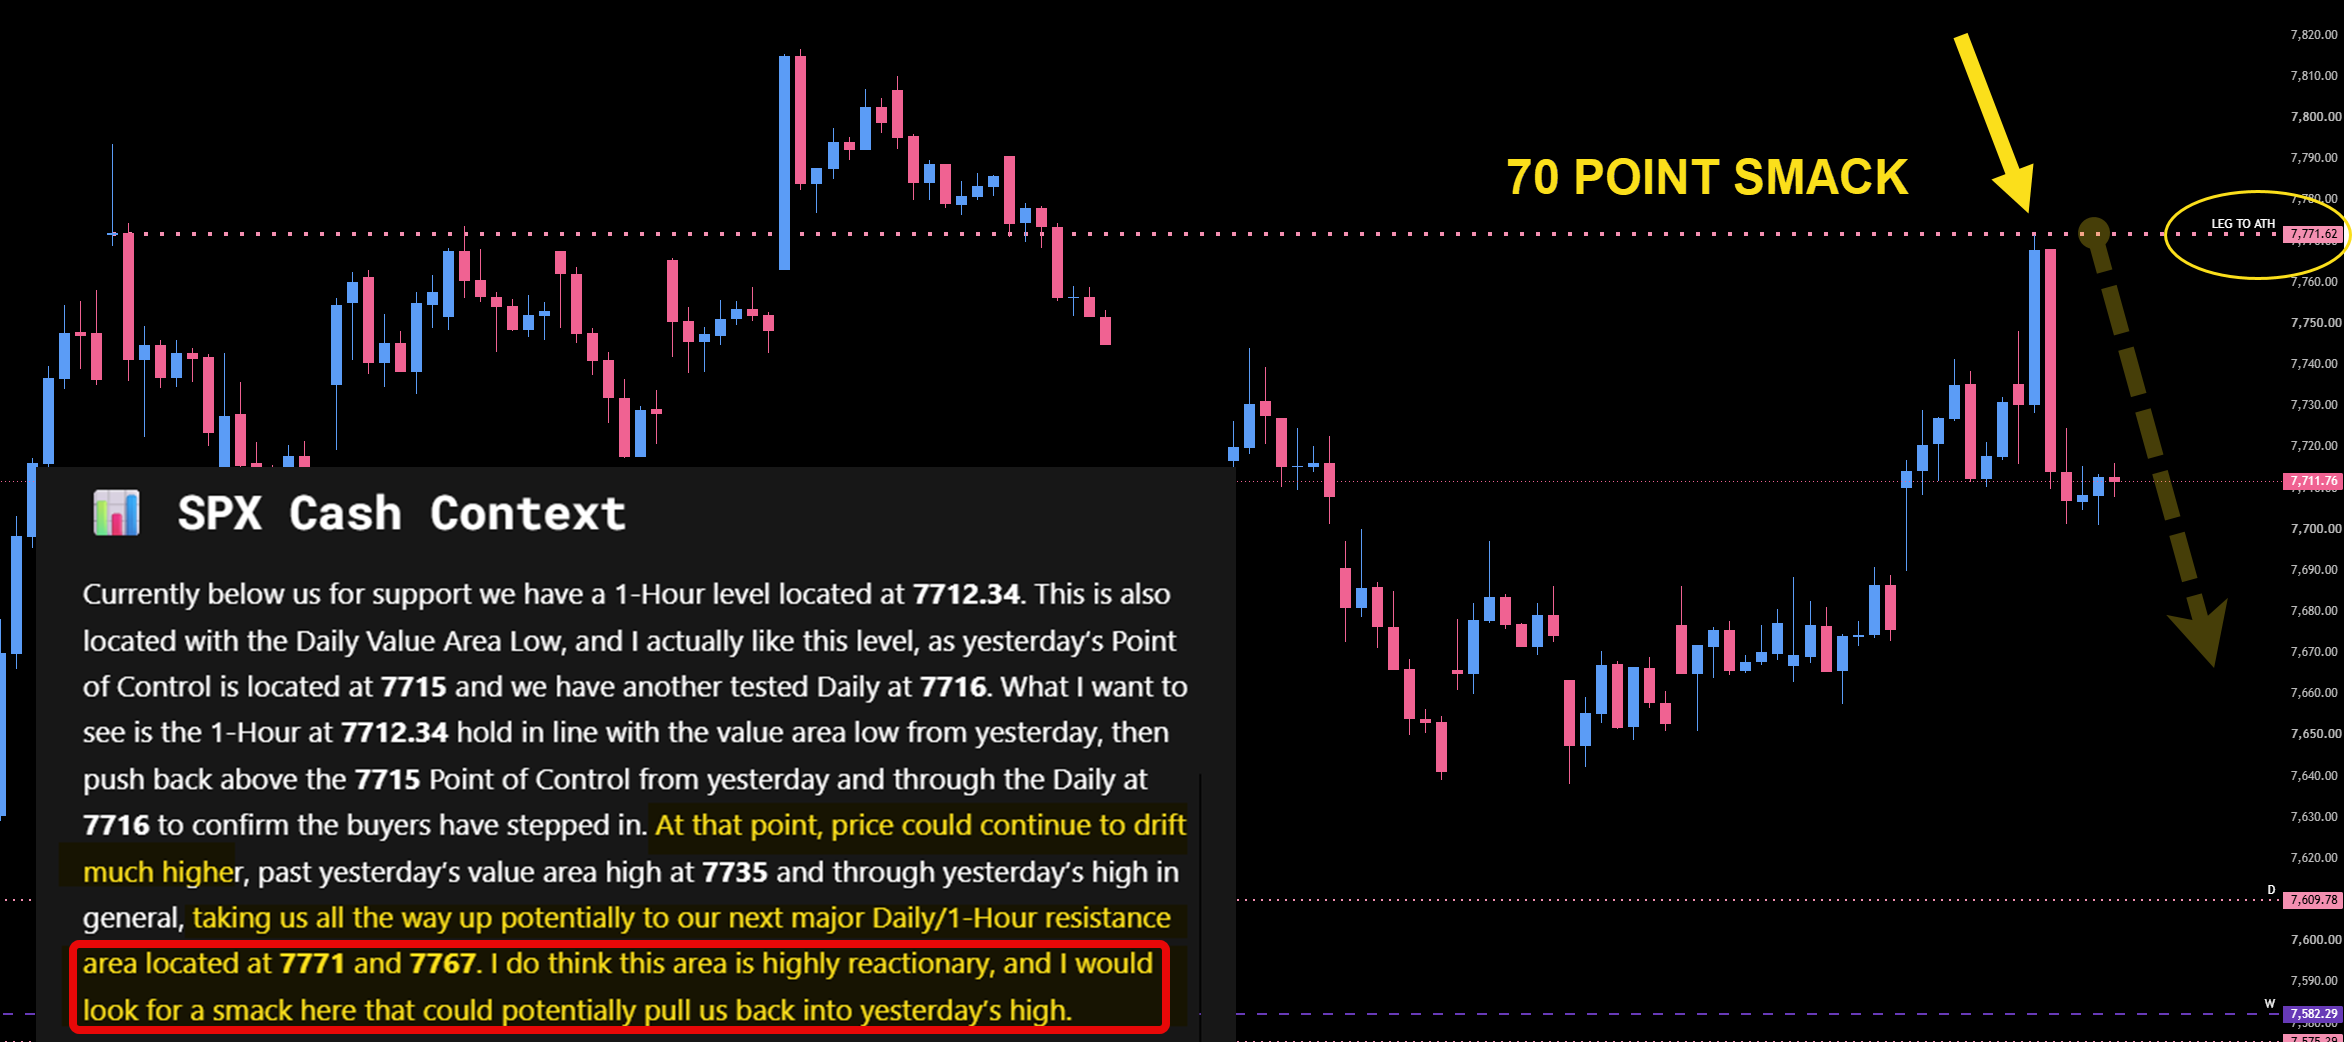
What I really want to talk about is Friday. We had the high nailed. After that massive push up, which we actually called, we came right into our significant resistance and it played perfectly to the tick. It was represented by SPX’s head-and-shoulders daily at 7771 — a level I have talked about over and over again. What a beautiful spot. And it was laid out perfectly in the trade plan, which said our next major daily resistance area was at 7771 and that the area was highly reactionary, with a smack expected. We called that out way in advance. I have been talking about that daily and the massive head and shoulders all week, so it should have been on everyone’s radar. We were all over it in the Inner Circle, I was short at the highs, got everybody to join me on the retest, and we made great money on Friday for the big one-and-done. We squeezed right up into our level, and it was a very powerful squeeze with the Fed on the mic in the afternoon giving us some nice volatility.
We have been in extreme summertime trading for the past two weeks and it has been super slow — but if you were patient and you played the process, you made out pretty well. I had a couple of days where I sat on my hands, and the trade plan still paid up. Patience is the trade. Sitting on your hands and waiting for the edges is the trade, and the past few weeks have really emphasized that. All you need is a couple of really good trades a week to set yourself up nicely. Big salute to everyone in the room who capitalized, and a special congratulations to Jeff — first day in the room after the webinar Thursday and he did really well just following along. Excellent stuff.
Let’s get into it: VIX, SPX, and ES. I have got some great places to buy and some great places to short. We had an interesting close on Friday that leaves me feeling like it could go either way, so we default to our higher timeframe.
☕ FREE RESOURCE — The SPX Morning Brief | Delivered 5:45 AM EST I have revamped this entire brief, and the new version comes out Wednesday — you need to get on the list before the spots fill up.
This is first come, first serve for 500 people, and once we hit that number we are done and you will miss out. Every morning at 5:45 AM EST it hits your inbox with everything you need to understand the significant value levels on SPX, over 150 indicator prediction assessments, and the top 5 news articles of the day. It is a fast read that gets you fully prepared well before the bell. It is free — all I ask is that you let me into your inbox. Get on the list now → https://pages.vicitradingsolutions.com/spx-edge
A Note on This Week’s Market:
News: The Fed on the mic Friday afternoon gave us a powerful squeeze and some welcome volatility right into our level. Nothing specific flagged for the week ahead, but we are rolling into the first of September, so stay alert at the open.
Volume: We are in extreme summertime trading with low relative volume, and it has been super slow for two weeks. But we are approaching the end of August — as we come into the first of the month in September, we have maybe a couple of weeks of summertime left, and then this whole low-volume, slow, grindy stuff should be over.
Range: We are technically right back in multi-week balance and multi-day balance. The weekly and daily profiles both show overlapping value areas stacked one on top of the other, and comparing the week before last to this past week, we have essentially gone nowhere. There is an extreme inefficiency in the valley of the weekly profile with singles that absolutely need to get cleaned up — a bell curve does not have divots in it, so that will more than likely get filled.
The Discrepancy: Here is the thing you need to know coming into the week: SPX has gained on the daily timeframe — really on all timeframes — but ES has not. ES is still pointed down on the daily while being up on the four-hour, the weekly, and the one-hour. That is a huge discrepancy, and it is the same one we dealt with on Friday. We made it work then and we will make it work again.
Trend: Leaning to the upside pretty hardcore. SPX is our lead, and its close has me still looking fairly bullish. That said, I do believe money can be made in both directions — I think we get longs and shorts into rotation. All things aside, it seems like we are still buying support, but with VIX this low, we keep our guard up.
🧠 Current Market Context
The Timeframe Discrepancy & The One Spot That Has To Hold
We find ourselves in a really interesting predicament. We are technically right back in multi-week and multi-day balance, and looking at the profiles side by side, the week before last and this past week have gone essentially nowhere. So we need to be very careful as we continue to balance back and forth while they determine whether they push higher or rotate lower. Ultimately they could just be accepting value for the next push up — we really do not know. What we do know is the areas we have to play and hold, and that is what we focus on.
The ES weekly TPO tells the important part of the story. We had that massive profile, we pushed down, and we have started to fill it all in — and not just in one week. We closed Friday underneath the previous weekly value area high at 7728, and we are also underneath the week-before’s value area high at 7748, which I told you last week was our big pivot area. But here is what I really want you to see: the value area low I flagged last week now lines up perfectly with our previous weekly point of control — the exact level I told you I really liked. And look at the valley in there: we have an extreme inefficiency with singles in the weekly profile that absolutely need to get cleaned up. Since we have closed below the previous weeks’ value, that tells me fair value sits down there, and more than likely we clean all of it up and settle back in around that zone. When you combine those profiles, you still have a big divot — and bell curves do not have divots. It needs to get cleaned up. On the daily profiles it is the same picture: massive overlapping values with a huge area below that aligns with our weekly spot, and a two-day composite whose daily POC lines up perfectly with the multi-day composite. I think it looks phenomenal, and it sets up a potential buy.
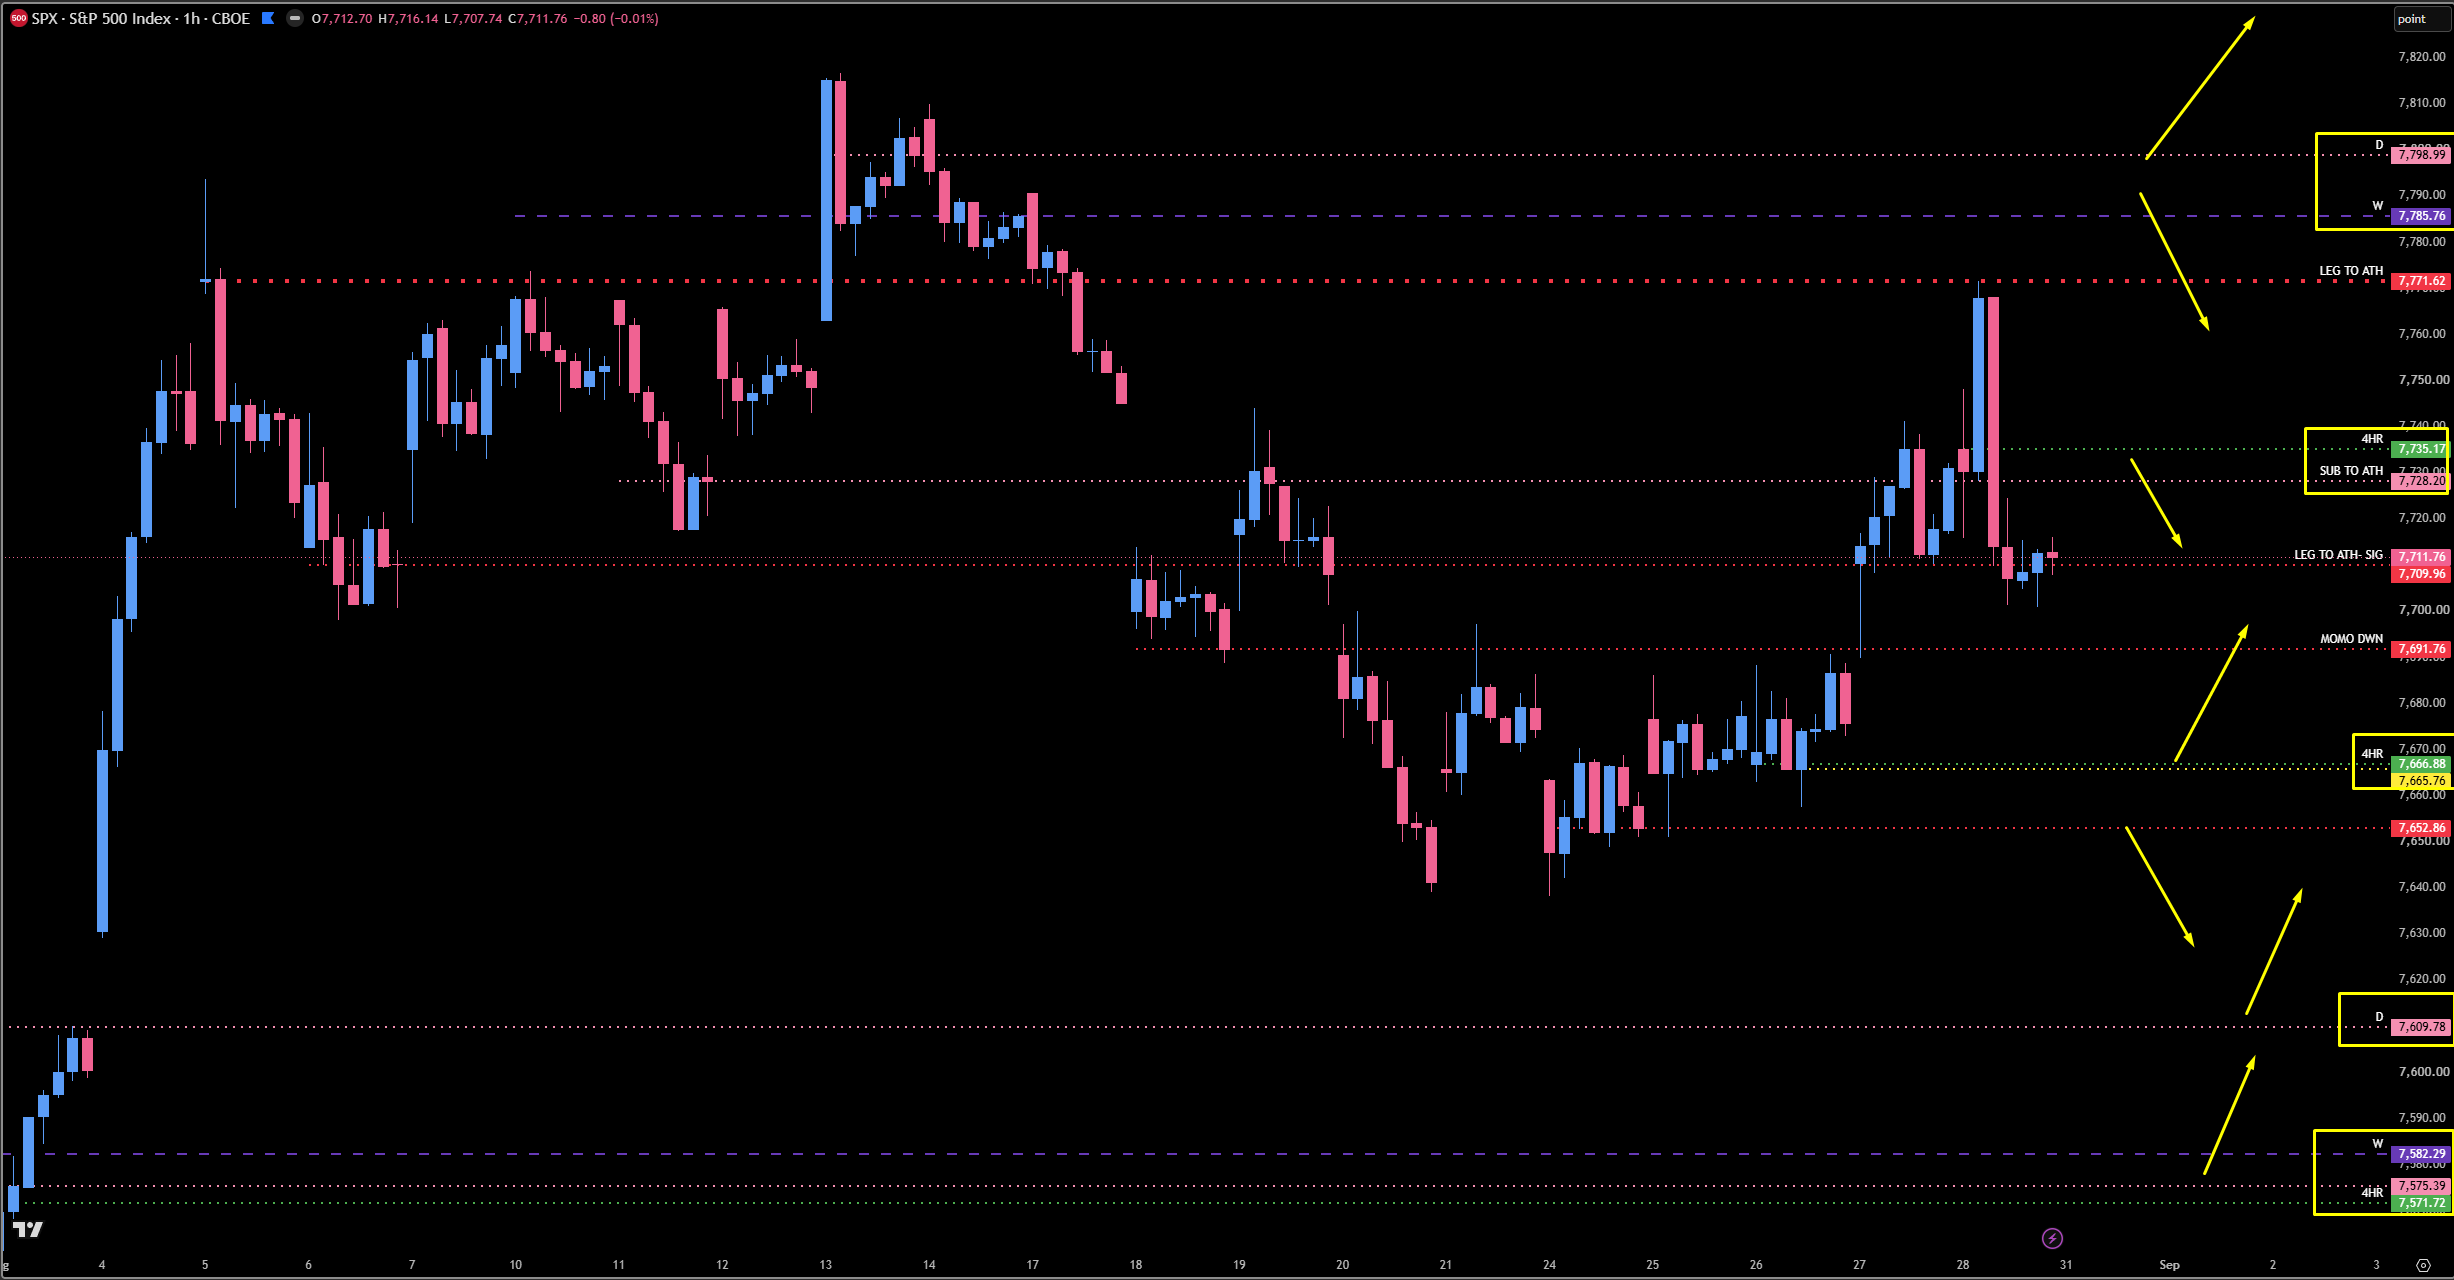
On SPX, look at that head and shoulders — what a beauty. The 7771 daily is now tested, so I am turning it red; it is no longer relevant as untested, but we know it is significant. Here is the discrepancy again: we gained on the daily on SPX but not on ES, and since SPX is our lead, we have to keep pointing that direction. I have exactly one untested level for support and I am watching it like a hawk: the four-hour buy spot at 7666, with a one-hour right at 7665. I love four-hour levels but I get more excited about dailies and weeklies — and we simply do not have anything untested below us for support. Those red dashed lines are dailies that are tested but very significant; we use them as static support and as momentum shift pivots for above/below continuation. Above us, we have an untested daily now at 7728 that was created Friday plus a four-hour at 7735. This whole thing is a monster spot. I could see us getting a massive pop off 7666 that takes us all the way back up, truly making that W formation — and that would be kind of sexy. If it holds and we get back above the daily at 7691 and ultimately 7709, there is really no stopping us from getting up into that resistance, as long as they test 7728 first. I want to see this get wiped, come down, play the buy and hold, get back above, and then come visit that area. Above there, 7785 is still an untested weekly and still that massive head and shoulders, and I have a very large untested daily at the high at 7798 — that one was actually tested on ES in the overnight session, but it is still very much wide open on SPX. If we push below 7666 and get below 7652, we come down into the major buy spot at 7609 - 7582, which fills that gap. So that is the line in the sand: we either play this and pop back up, or we come down, play that area, and try again.
🚨 VIX Analysis: The 13.60 Last Untested Weekly
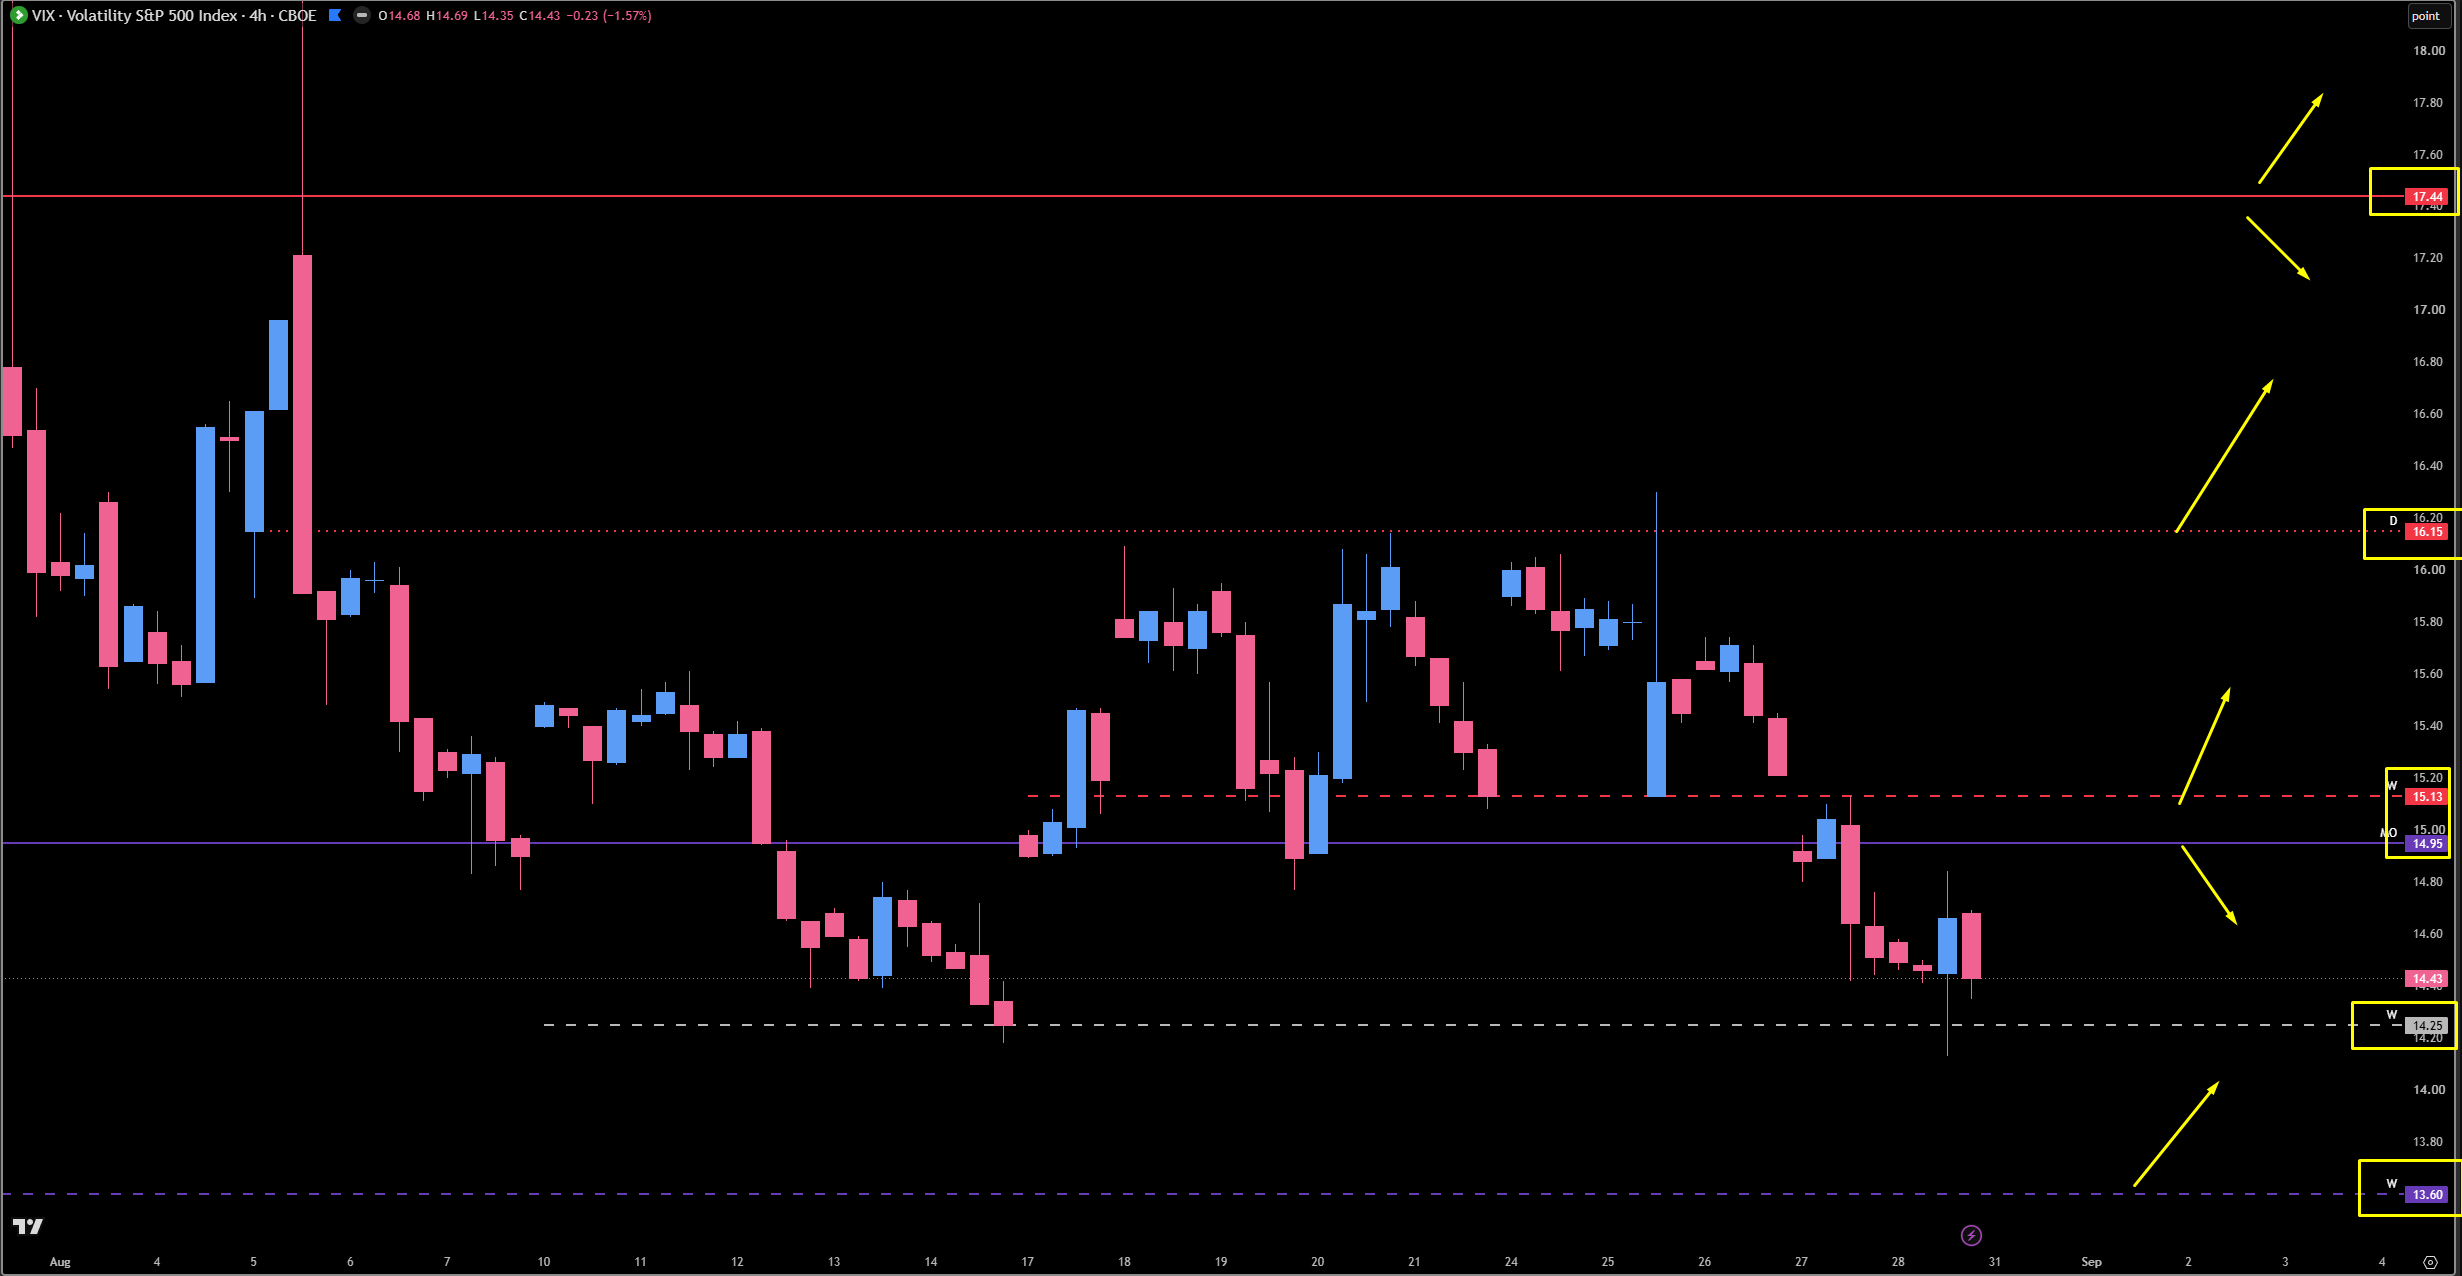
I want to throw out the same precautionary tale I gave last week: we are entering the $14 and $13 handle again, which is extreme suppression on VIX. When we get this low, we tend to get reactionary pops, because it is a balancing issue — VIX gets a little too oversold, we come into important supports, and the knee-jerk reactions cause the indices to pull back. This does not mean I am bearish. It just means I am cautious. I know how these reactionary pushes work — and if you recall, I put the same warning out last Sunday, and that turned out to be the all-time-high pullback. So again, exercise caution as we continue to drift lower.
The Last Untested Weekly: 13.60. We have one more untested level way down here, and that is my last untested weekly. I would be looking for a reaction here, and more than likely we will see this area based on what I can see on the charts right now — but we never know.
The Current Prop: 14.25 (Weekly). This weekly is currently propping VIX up and it looks pretty good. In my opinion, I still think we could come a little lower into the 13.60, but this one is doing its job for now.
The Reclaim Zone: 14.95 and 15.13. This is our big pivot area to get back above. 14.95 is the big one, and 15.13 is the hurdle — this weekly is highly untested and it is a big spot. If VIX gets above 15.13, we can start pushing through the daily above.
The Ceiling: 16.15 (Daily). You guys know this daily kept us suppressed for an entire week — it was an amazing call for being the ceiling and it acted as exactly that as we came down.
The Bull/Bear Line: 17.44 (Monthly). As you know, this has been a huge bull/bear line for us in the past. That is the high-timeframe map: 14.95 / 15.13 to get back above, and 13.60 for support.
🎯 Detailed Actionable Trade Plan (ES Futures)
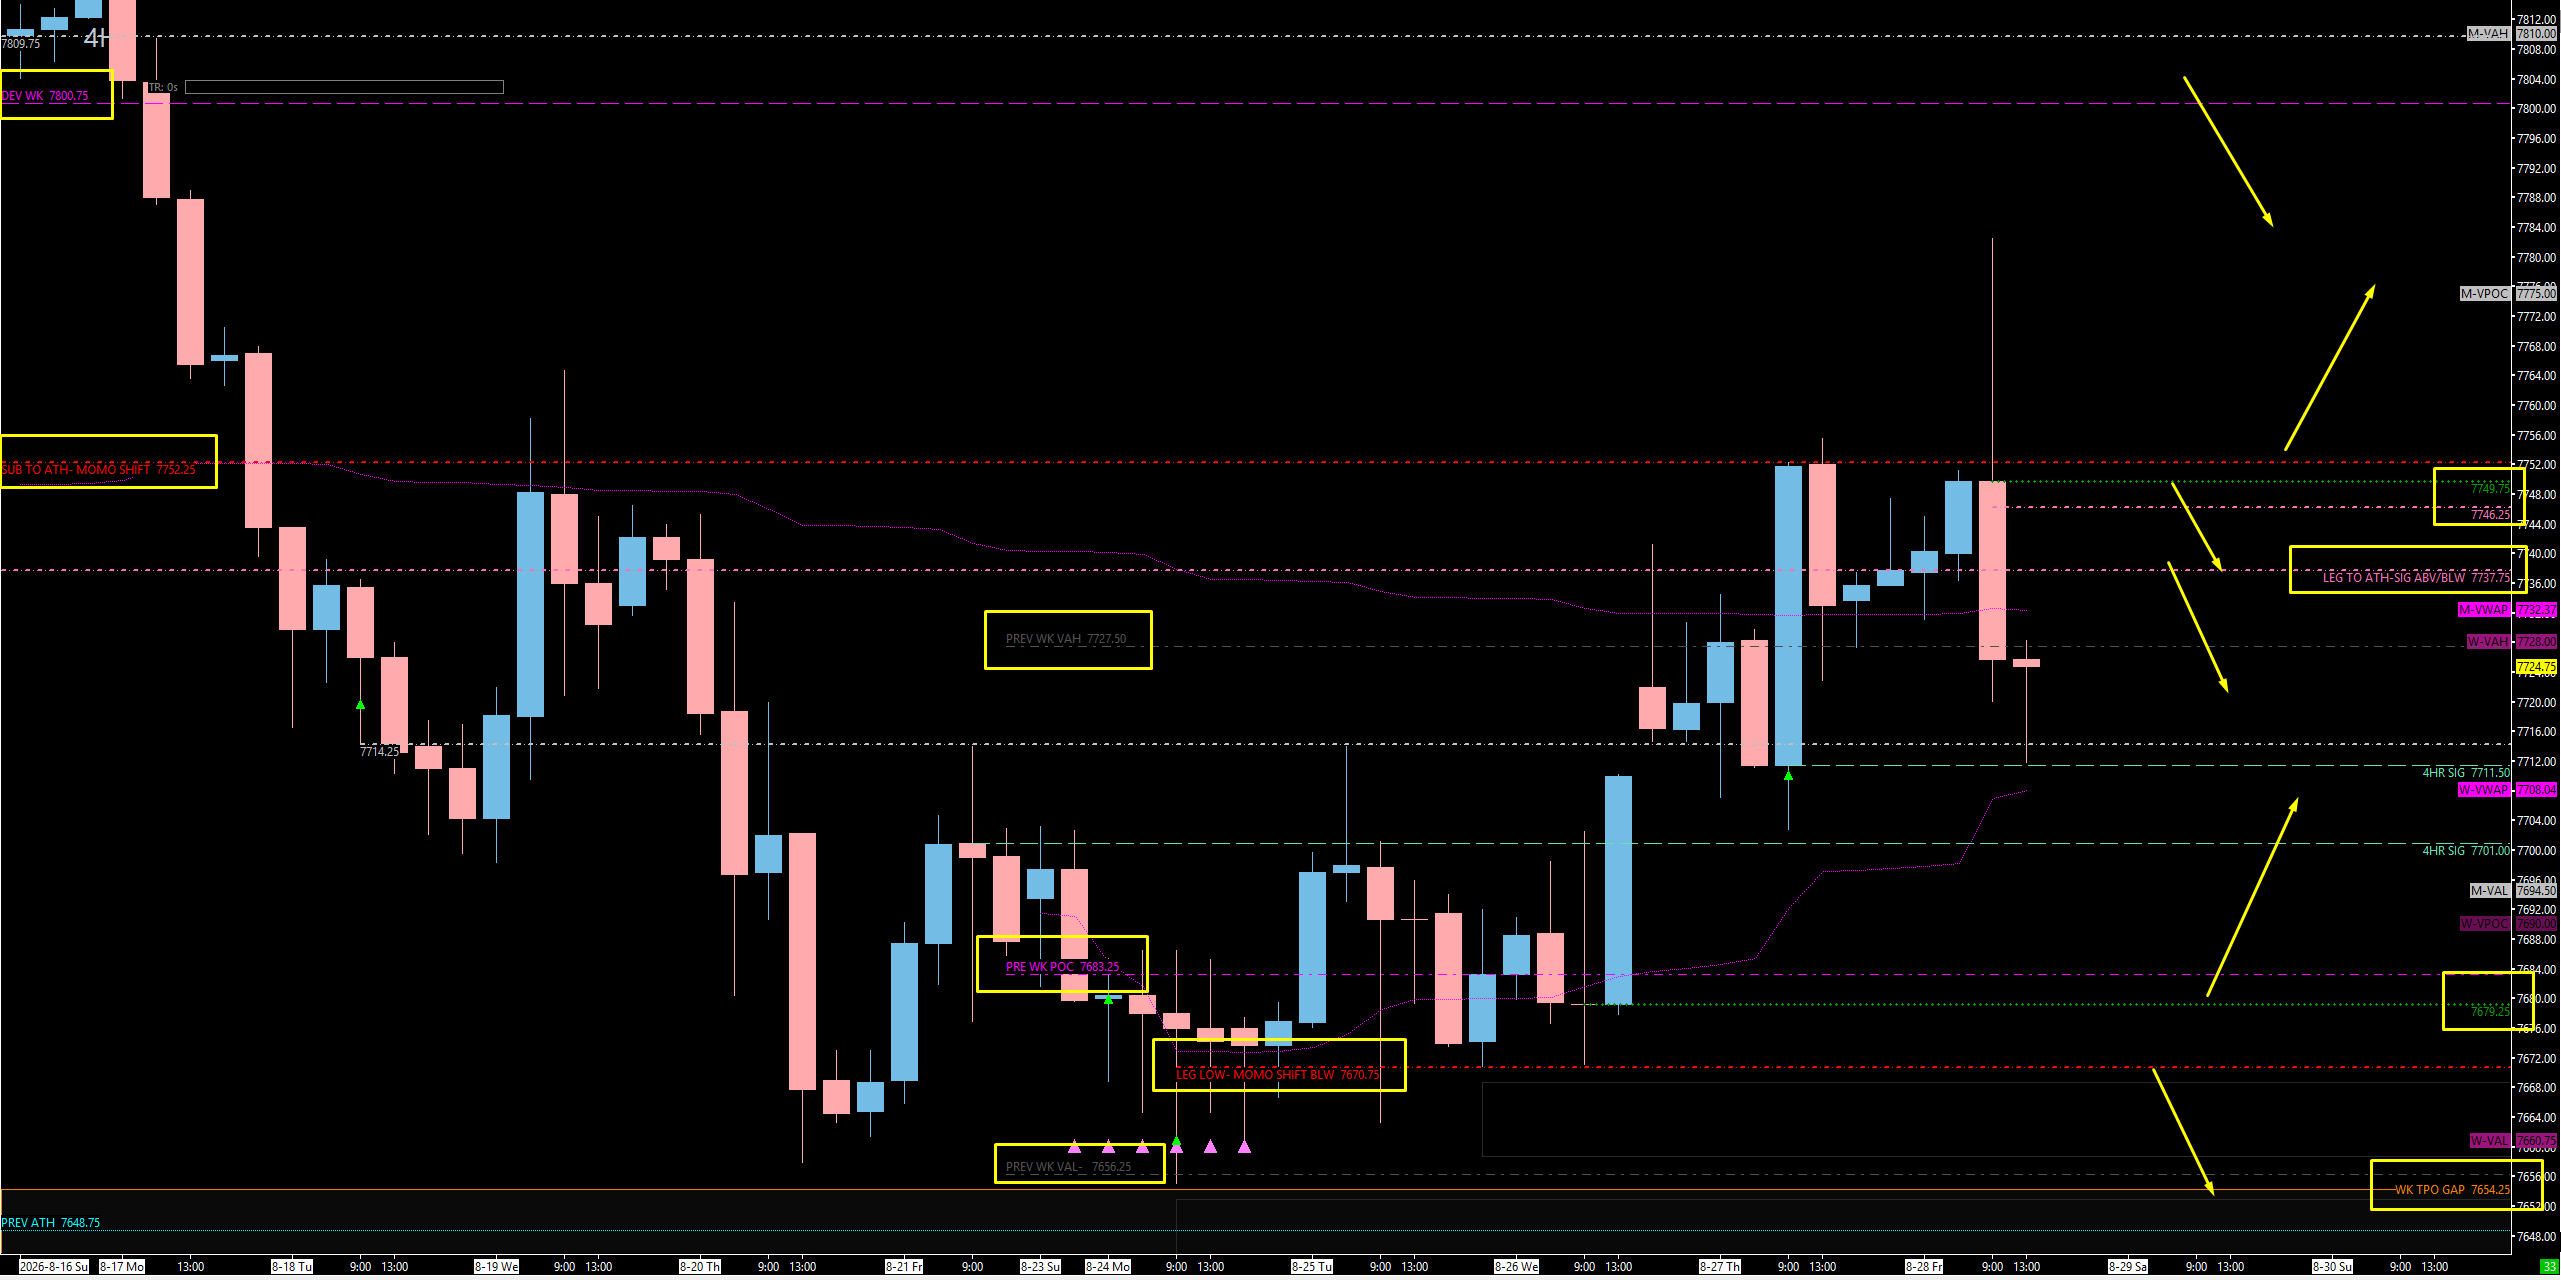
We are still buying support with the higher timeframe as our default, but I expect rotation in both directions. I have one massive buy spot: the 7679 four-hour, sitting on the previous weekly point of control at 7683 with a mountain of confluence. Above us, the resistance ladder is heavy and reactionary: 7737 first, then 7746.25 - 7749, and above 7752 I truly believe we shift and come up into 7800. It is my belief that we move lower before we move higher — but we go on facts, not feelings, so we let the levels decide.
🔴 Key Resistance Zones & Setups
The Previous Weekly VAH: 7728.00
7728.00 (Previous Weekly Value Area High).
Context: We closed Friday back below 7728, our previous weekly value area high, and we are also below the week-before’s value area high at 7748 that served as last week’s big pivot. Being under this is what keeps us in balance rather than in breakout mode.
Actionable Setup: Reclaiming 7728 is the first step in shifting the near-term picture back to the bulls. As long as we are below it, we remain inside the balance and the rotation-lower scenario stays live.
The First Resistance — Leg To The All-Time High: 7737.00
7737.00 (Untested Daily — Leg To The All-Time High).
Context: This number should be familiar to every single person who has traded with me for at least a week — we have talked about 7737 multiple times. It is now untested on the daily timeframe and it is our significant leg to the all-time high. This is a highly reactionary area.
Actionable Setup: Short Setup: This is our first resistance area and a prime location for a reaction. Expect a smack on the first touch, and if we are riding the long up from below, this is where to be taking profits.
The Second Resistance — Friday’s Leg Down & 4-Hour: 7746.25 - 7749.00
7749.00 (Four-Hour — Current Four-Hour Down), 7746.25 (Untested Daily — Current Daily Leg Down Made Friday).
Context: Directly above 7737 we have 7746.25, our current daily leg down that was made on Friday — also an untested area that could provide a potential reaction. And at 7749 we have our current four-hour down. My one caution on the four-hour, and I am using it as something to lean on: we have not lost on the four-hour timeframe. So while this could provide a smack, it could just as easily be a small head bump as we continue progression higher.
Actionable Setup: Short Setup: Our second resistance area is 7746 through 7749. Look for the reaction, but respect that the four-hour trend is still intact — do not marry the short here.
The Shift Level — The Big Daily: 7752.00
7752.00 (Tested Daily).
Context: We talked about 7752 last week as the big daily we needed to push above. We kept getting capped here, and capped again, and then Friday they tried to push up and still could not close above it — they pushed all the way up and closed way down, never securing the firm daily hold. As you know, when they got above 7752 the first time, they broke out. So here we are again.
Actionable Setup: Above 7752, I truly believe we shift and come up into 7800. That is the trigger for the upside continuation. Below it, we keep working the balance.
The Upside Target: 7800.00
7800.00 (Upside Objective).
Context: This is where we go if they clear 7752 and shift the structure. It is the same idea I pointed out on SPX with the head-and-shoulders zone up there.
Actionable Setup: Treat 7800 as the objective on an acceptance above 7752, and reassess the head-and-shoulders scenario when we get there.
🔵 Key Support Zones & Setups
The Tested Leg-Up Cluster: 7711.00 - 7714.00
7714.00 (Tested Daily — The Monster), 7711.00 (Very Tested Four-Hour — Current Leg Up).
Context: You guys know the 7714 daily has been huge — what a monster daily we have played time and time again. Right with it, the 7711 is our current four-hour leg up, which is now very much tested.
Actionable Setup: These are profit-taking markers on the way up from the buy spot below. If they push below this area, it will become resistance from the bottom side up, as we have talked about many times before.
The Thursday Sweep Level: 7701.00
7701.00 (Major Above/Below).
Context: 7701 has held us down multiple times, and just on Thursday they swept into this level and then catapulted us up higher. So we know this one is massive.
Actionable Setup: Take Profits: On the long from the buy spot below, this is where we take big profits before working toward the 7711 / 7714 cluster above.
THE MASSIVE BUY SPOT — 4-Hour Leg To The High: 7679.00 - 7683.00
7683.00 (Previous Weekly Point of Control), 7679.00 (Four-Hour + One-Hour — True Leg To The High).
Context: This is my massive buy spot. Now you are probably thinking: Ryan, we are smacking dailies all over the place — why are we buying a four-hour and treating it like the holy mecca? Because this is a fantastic spot. It lines up with the massive amount of accumulation we have had over the past week and a half, it sits right on the weekly POC, and this four-hour is not just any four-hour — it is our true four-hour leg to the high right now, and really the last untested. The one-hour at 7679 is the same spot and it looks beautiful and clean. This is also where the inefficiency in the weekly profile gets cleaned up, and where yesterday’s point of control sits if we rotate down from our current location. It is the same area I showed you on SPX at 7666, so there is confluence out the wazoo here.
Actionable Setup: Buy Setup: We play this area and we want to get back above the previous weekly point of control at 7683. From there we take big profits at 7701, then the 7711 / 7714 cluster, expect a little pullback, and if they push back through, we start taking more profits around 7752 and 7737. If this low holds, we could go all the way back up and make that W on the high timeframe.
Warning: If we play this area and they reject it, we come down and fill that big weekly TPO gap along with the rest of the inefficiency below. This is the one spot on both ES and SPX that absolutely has to hold to keep this whole market propped up.
📌 Cheat Sheet – Key Levels Recap
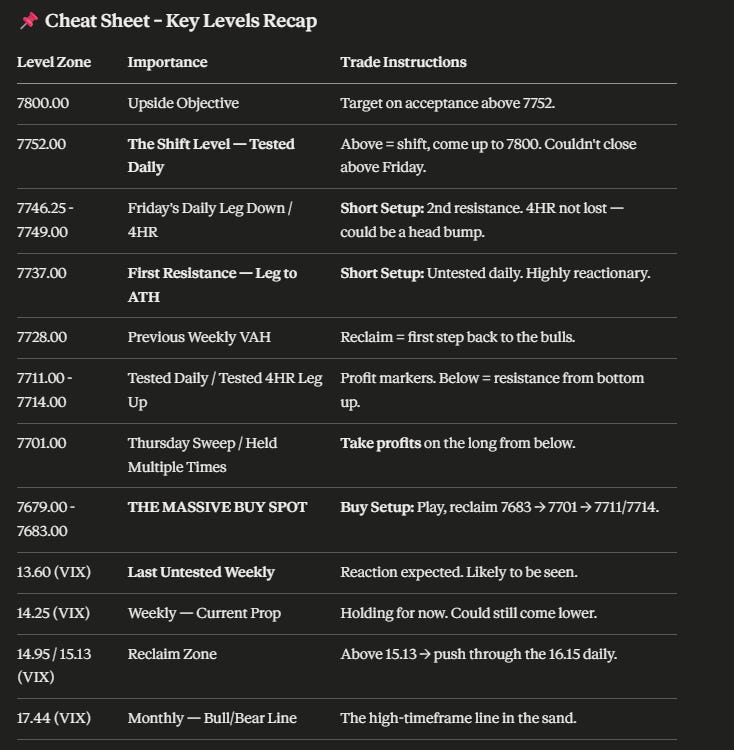
🧠 Final Thoughts
This is going to set every one of you up for success coming into next week, so let me lay out exactly where my head is at. We have a little disparity here. VIX is super low, which is kind of scary to me — but we are obviously still bullish and we should not think of it any other way; we just keep our guard up. On the other side, we have gained on the daily timeframe and really all timeframes on SPX, and that is truly keeping me leaning to the upside pretty hardcore. The discrepancy is that ES is down on the daily but up on the four-hour, the weekly, and the one-hour. All things aside, it seems like we are still buying support.
I do see some heavy reactionary resistance overhead: 7737 first as the untested leg to the all-time high, then 7746.25 - 7749, and above 7752 we shift and come up into 7800. It is my belief that we move lower before we move higher — but again, that is a belief, and we go on facts, not feelings. And really, we have just the one buy spot on ES and SPX that absolutely has to hold to keep this whole market propped up: 7679 on ES sitting on the 7683 previous weekly point of control, and 7666 on SPX. If it does not hold, we come down lower and fill the weekly gap, which is certainly a possibility. But I have to tell you — I think that spot is going to get love regardless. I do not know if it saves the day, I do not know if it creates the W on the high timeframe, but I do believe that area will get a reaction, and I will be looking to take that trade there, watching for the actionable setup. And of course, we ride runners to Valhalla.
Do not forget to get on the list for the revamped SPX Morning Brief — the new version drops Wednesday and it is capped at 500 people, first come, first serve.
And if you are a Trade Plan subscriber and you are not in the Inner Circle yet, hit me up and come into the Discord room. I will give you a good deal on your first month. Come check it out, try it out, join the crew — there are about 50 of us in there looking at the market the same way, taking the trades together, and putting up real numbers.
Last week was incredible. Let’s do it all again this week. I look forward to serving each and every one of you, and I will see you first thing Monday morning.
Until next time—trade smart, stay prepared, and together we will conquer these markets!
Ryan Bailey, VICI Trading Solutions.
📊 Indicator String
Copy and paste the levels below into your S&P Edge Levels indicator to automatically plot today’s key levels on your chart:
7752.00|Tested D|TD
7749.00|4HR|4H
7746.25|D|D
7737.00|D|D
7728.00|P.W. VAH|GD
7714.00|Tested D|TD
7711.00|Tested 4HR|T4
7679.00|4HR|4H


