

Welcome back, everyone. It is time for another Weekend Review, and we had one of the most amazing, volatile weeks last week. We absolutely dominated and conquered the markets. For those of you in the Inner Circle or following along in the trade plan, you know it was spectacular — it is hard to believe the plan plays with such precision over and over again, and so far in advance.
But I want to bring one thing to everyone’s attention first: summertime is over. I think that was pretty obvious on Friday. Coming into the first part of October, we finally had some massive moves — a big overnight move, then bigger overnight moves throughout the week even while RTH stayed muted, and then Thursday and Friday delivered some amazing moves. I have a feeling volatility may be back, and that is all we need to make some money. I am so tired of the summertime doldrums, and I know you are too.
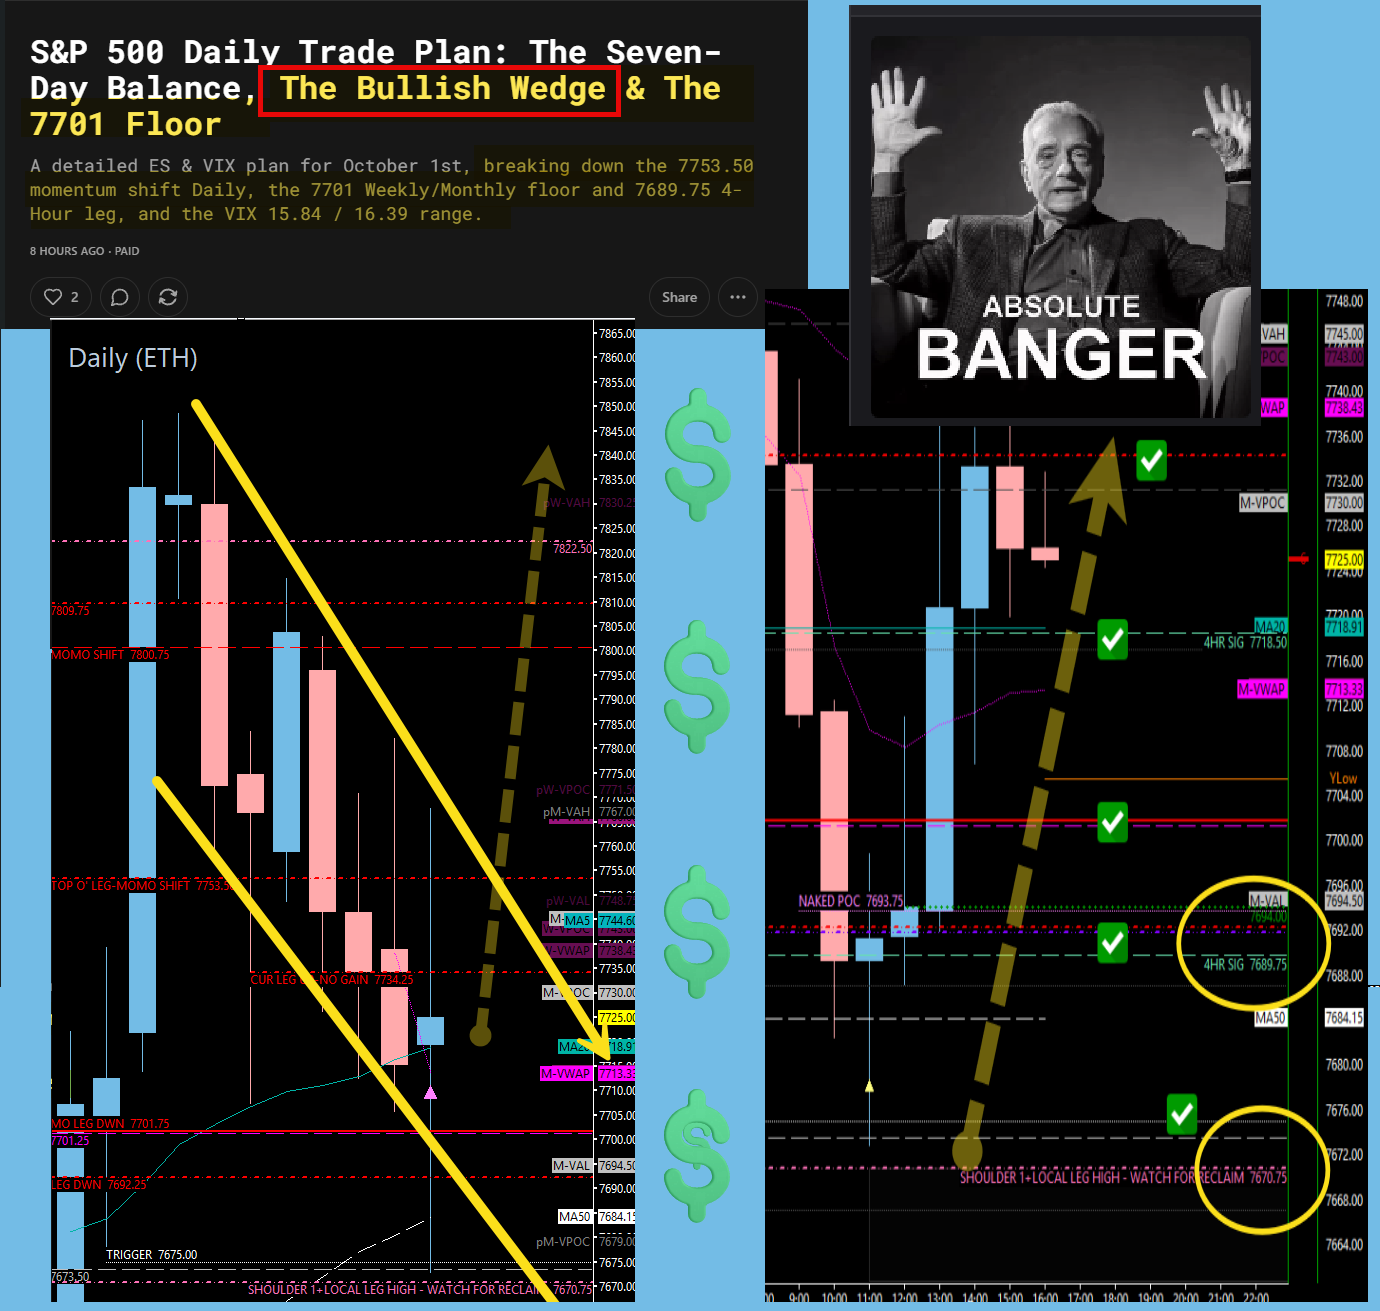
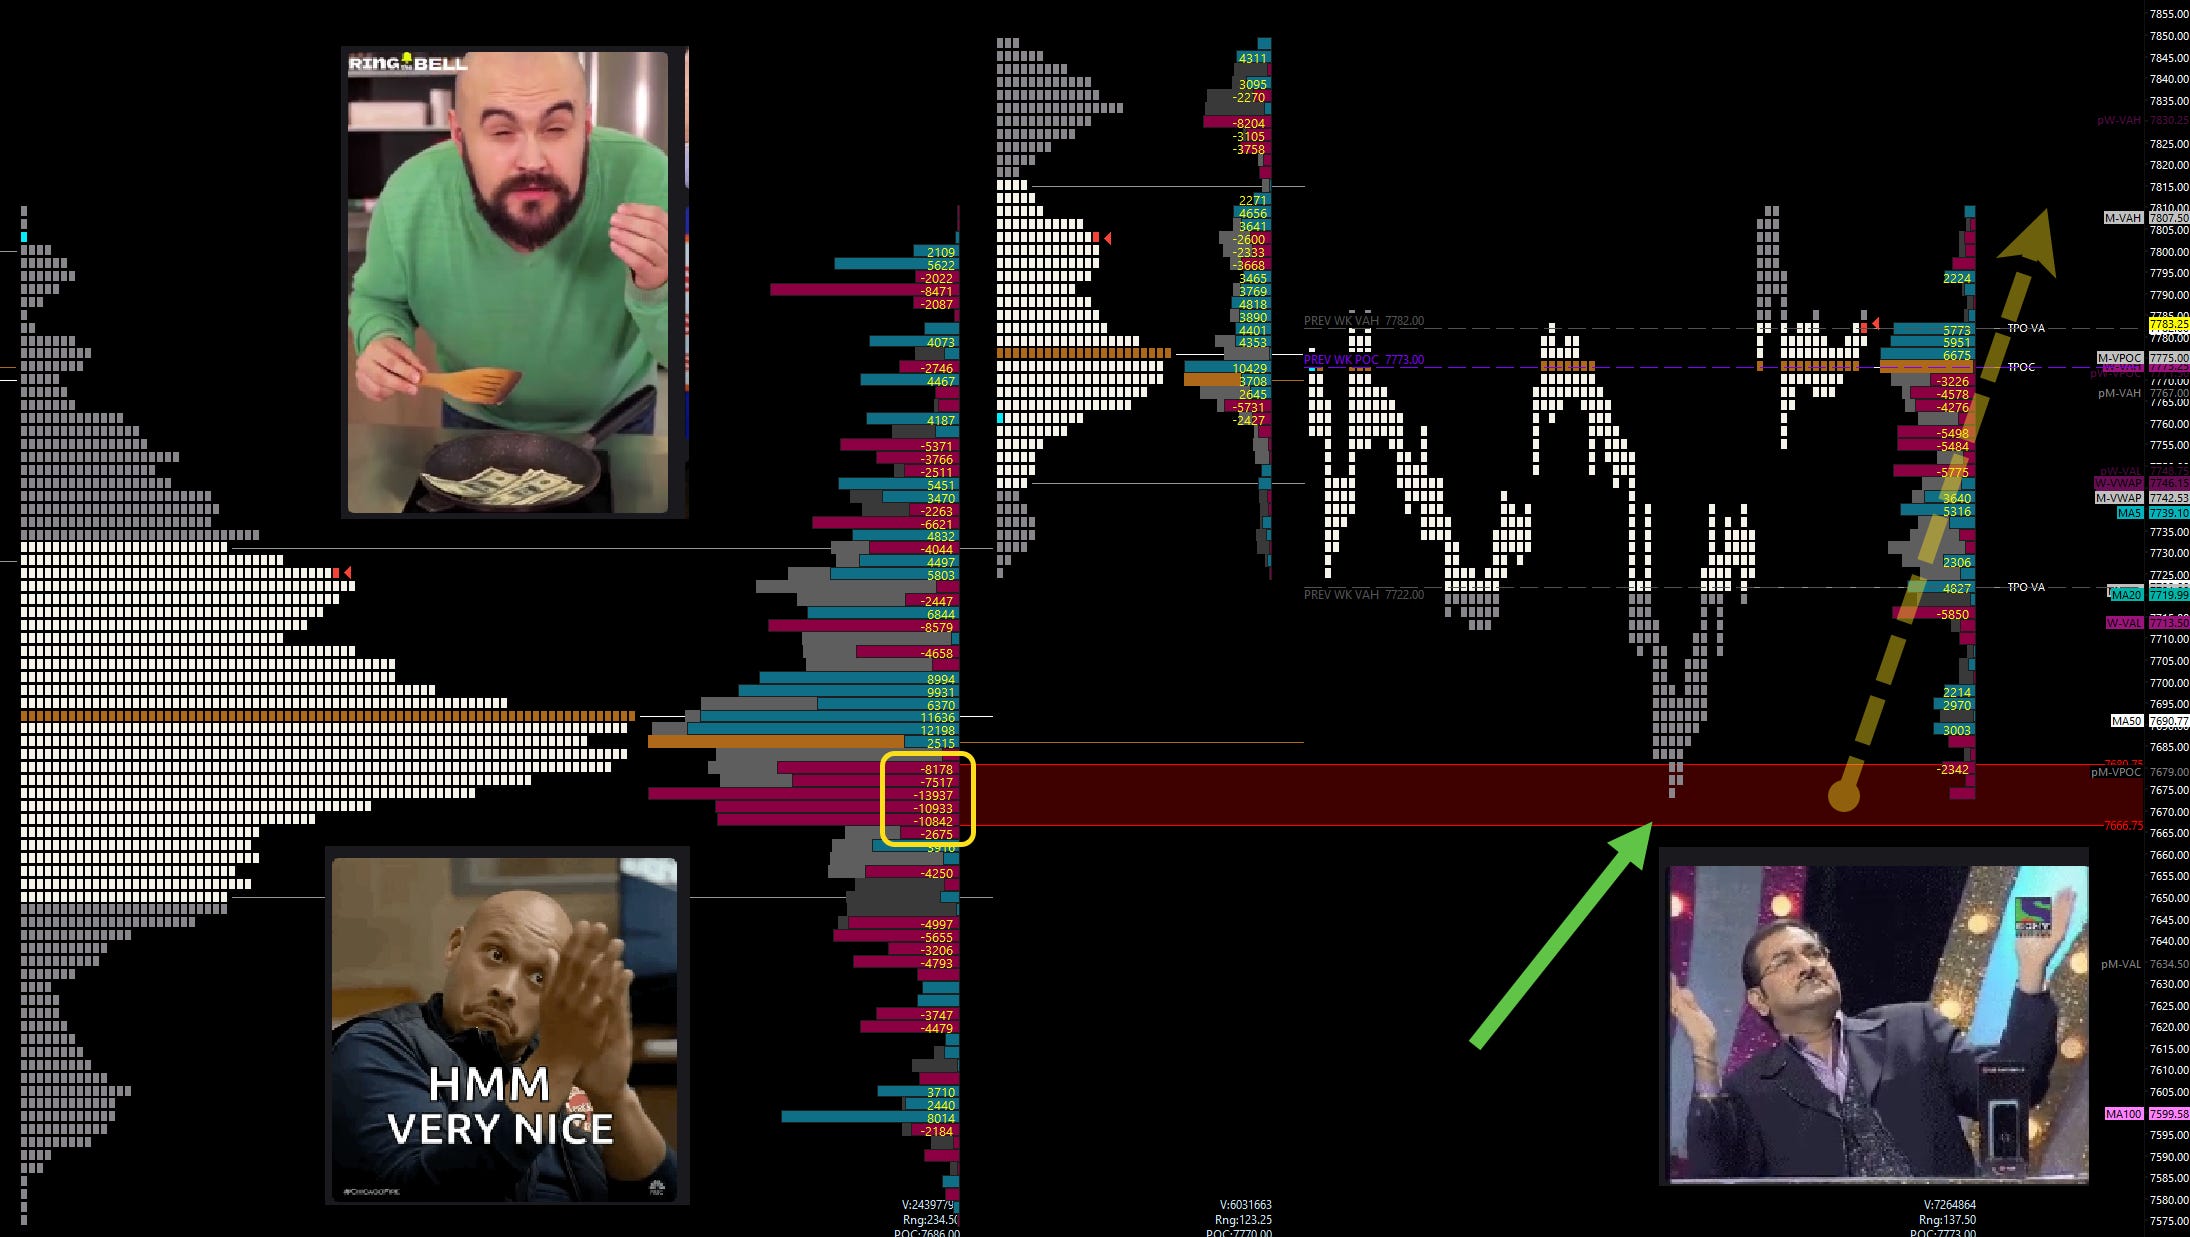
As promised, a little highlight reel. On Thursday we were calling for the bullish wedge, which was pretty obvious on the daily timeframe. We kept sweeping the lows, and I kept saying we were still bullish and looking for buyers to sweep liquidity. We had our big boy 7701 as our massive floor and momentum shift level — and they played our 7675 area almost flawlessly, catapulting us back above 7701 and sending the indices higher. That GIF says it all. An absolute banger. And it was all laid out in last Sunday’s Weekend Review: the weekly TPO showed a huge spot of seller absorption created from the big six-week point of control, and when I broke it into individual blocks, we came right down, dipped into the 7675 area perfectly, and catapulted completely outside of it — called well over five days in advance. That is the kind of precision you can expect from the trade plan. I had a banner week for students in the Inner Circle — so many people passing accounts and making money. It was absolutely obscene.
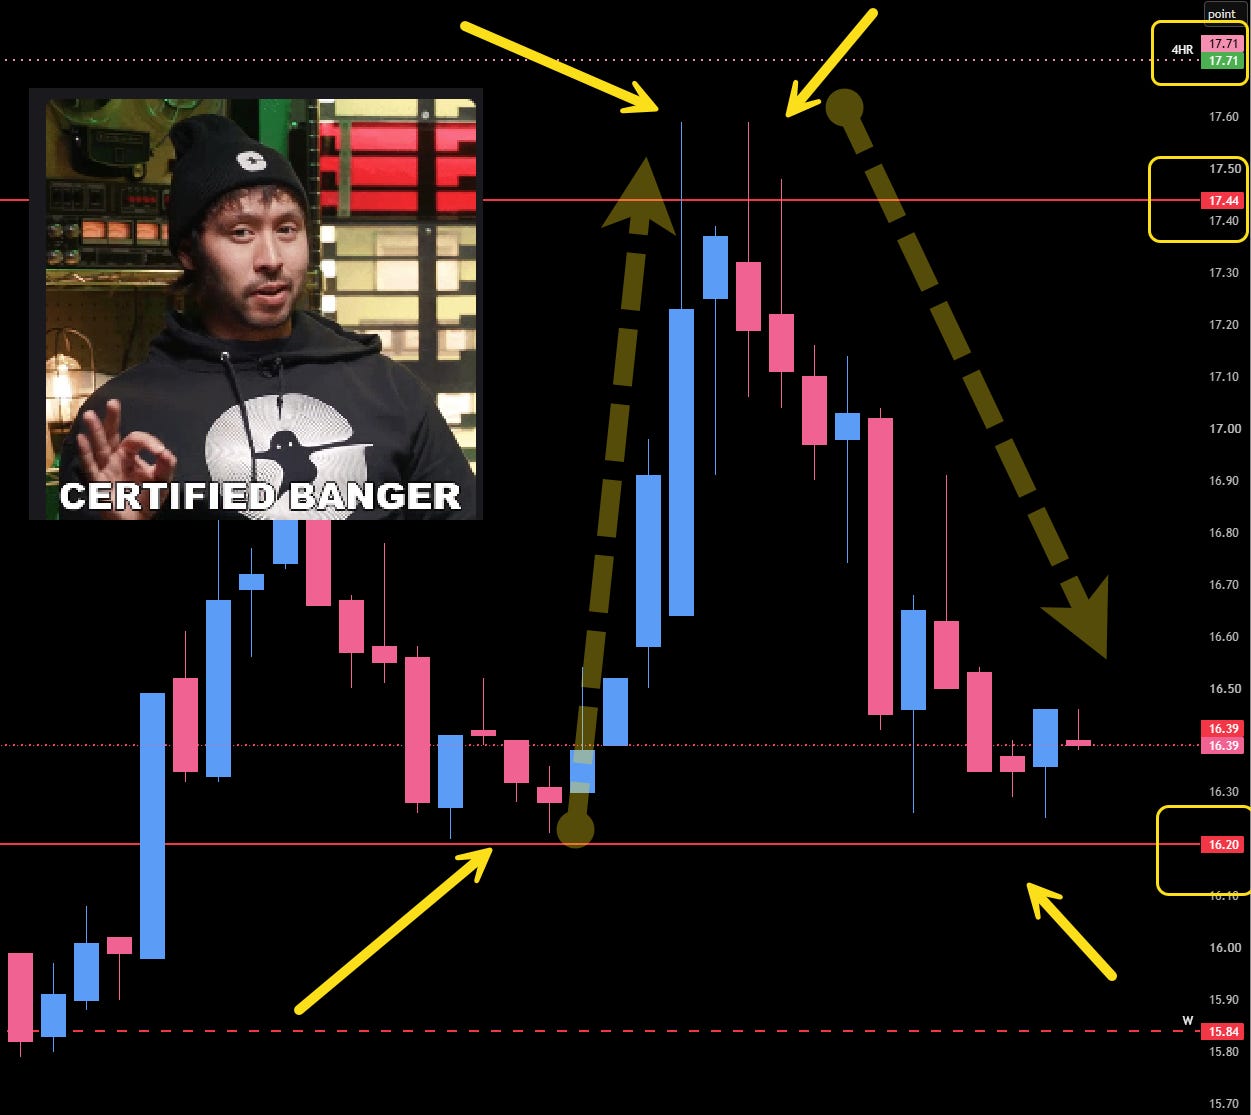
And on VIX, Thursday was a beauty. 16.20 held, and VIX popped right up into our 17.44 monthly and 17.71 daily area that we have spoken about many times. It was even in Thursday’s plan: if they hold 16.20 and pop into this area, it could be a fantastic spot to look for an inverse long in the indices. That is exactly what happened. The push-up flushed the indices Thursday, but the smack from the monthly and the daily sent VIX screaming lower, which was immediately the inverse long for the indices. A beautiful display of trade plan perfection — and we are going to do it all again this week. VIX, SPX, then ES. Let’s go.
📧 Check Your Spam Folder Follow-ups and SPX Brief emails are landing in spam. Look for rbailey@vicitradingsolutions.com and info@vicitradingsolutions.com, mark them “Not Spam,” and add them to your contacts so you keep getting them.
☕ FREE — The New & Improved SPX Morning Brief SPX value levels, 150+ indicator prediction assessments, and the day’s top news — in your inbox before the bell. Completely rebuilt and completely free. Seats are limited and they fill up fast. Get your seat now → https://go.vicitradingsolutions.com/spx-brief
A Note on This Week’s Market:
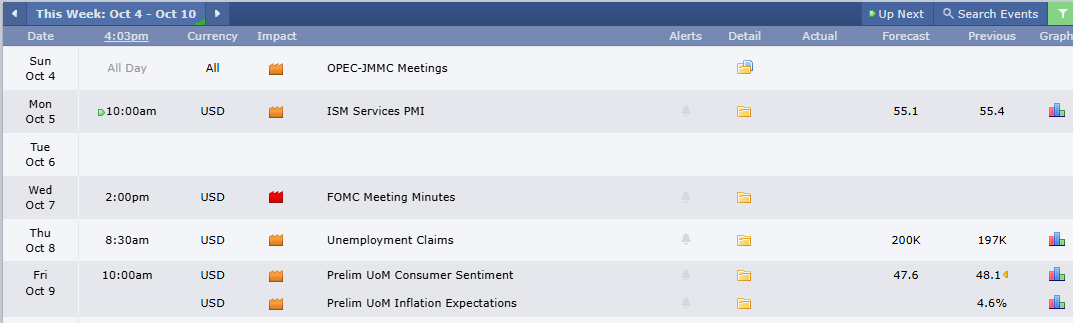
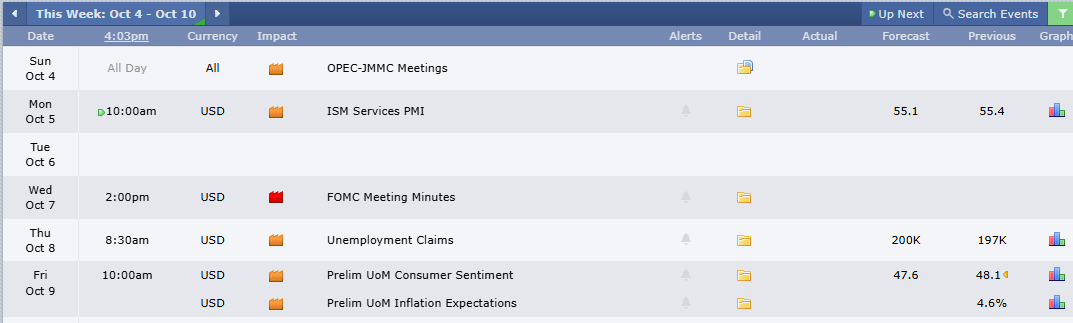
Scheduled News:
Volume: Summertime is over. We had big overnight moves early in the week, then massive moves Thursday and Friday. Volatility appears to be back, and that is exactly what we need to make money.
Range: We are still in a massive balance range — roughly 250 points on SPX that we have been going back and forth in since August, accumulating and accepting value without making progress. On ES we have overlapping points of control from weeks apart, which is straight-up balance. This is a huge decision point: if they have been accumulating since August and we break out to the highs, this thing could go to 8500 or more.
Gamma: We still have Negative Gamma at our backs, telling us dealers are hedging to the downside — so expect increased ranges and increased volatility.
Trend: ES is up on all timeframes — we regained the daily and the four-hour, and ES is still up on the weekly. No reason to believe this market is in trouble. SPX is up on the four-hour and daily but has not gained on the weekly. The catch: support is extremely thin on both. The bulls are in a precarious position — they either need to get their act together and keep pushing, or this could go south.
🧠 Current Market Context
Pointed Up, But Running Out Of Floor
Here is the honest read: we are pointed up and I have every reason to believe we continue higher — but it really comes down to one spot. They did not leave themselves a lot of options. On SPX we have one untested area of support. On ES we have a couple of buy spots, but really one high-timeframe level we are focused on. We are either going to hold, or this thing goes south — and with Negative Gamma and volatility back, it will not be quiet either way.
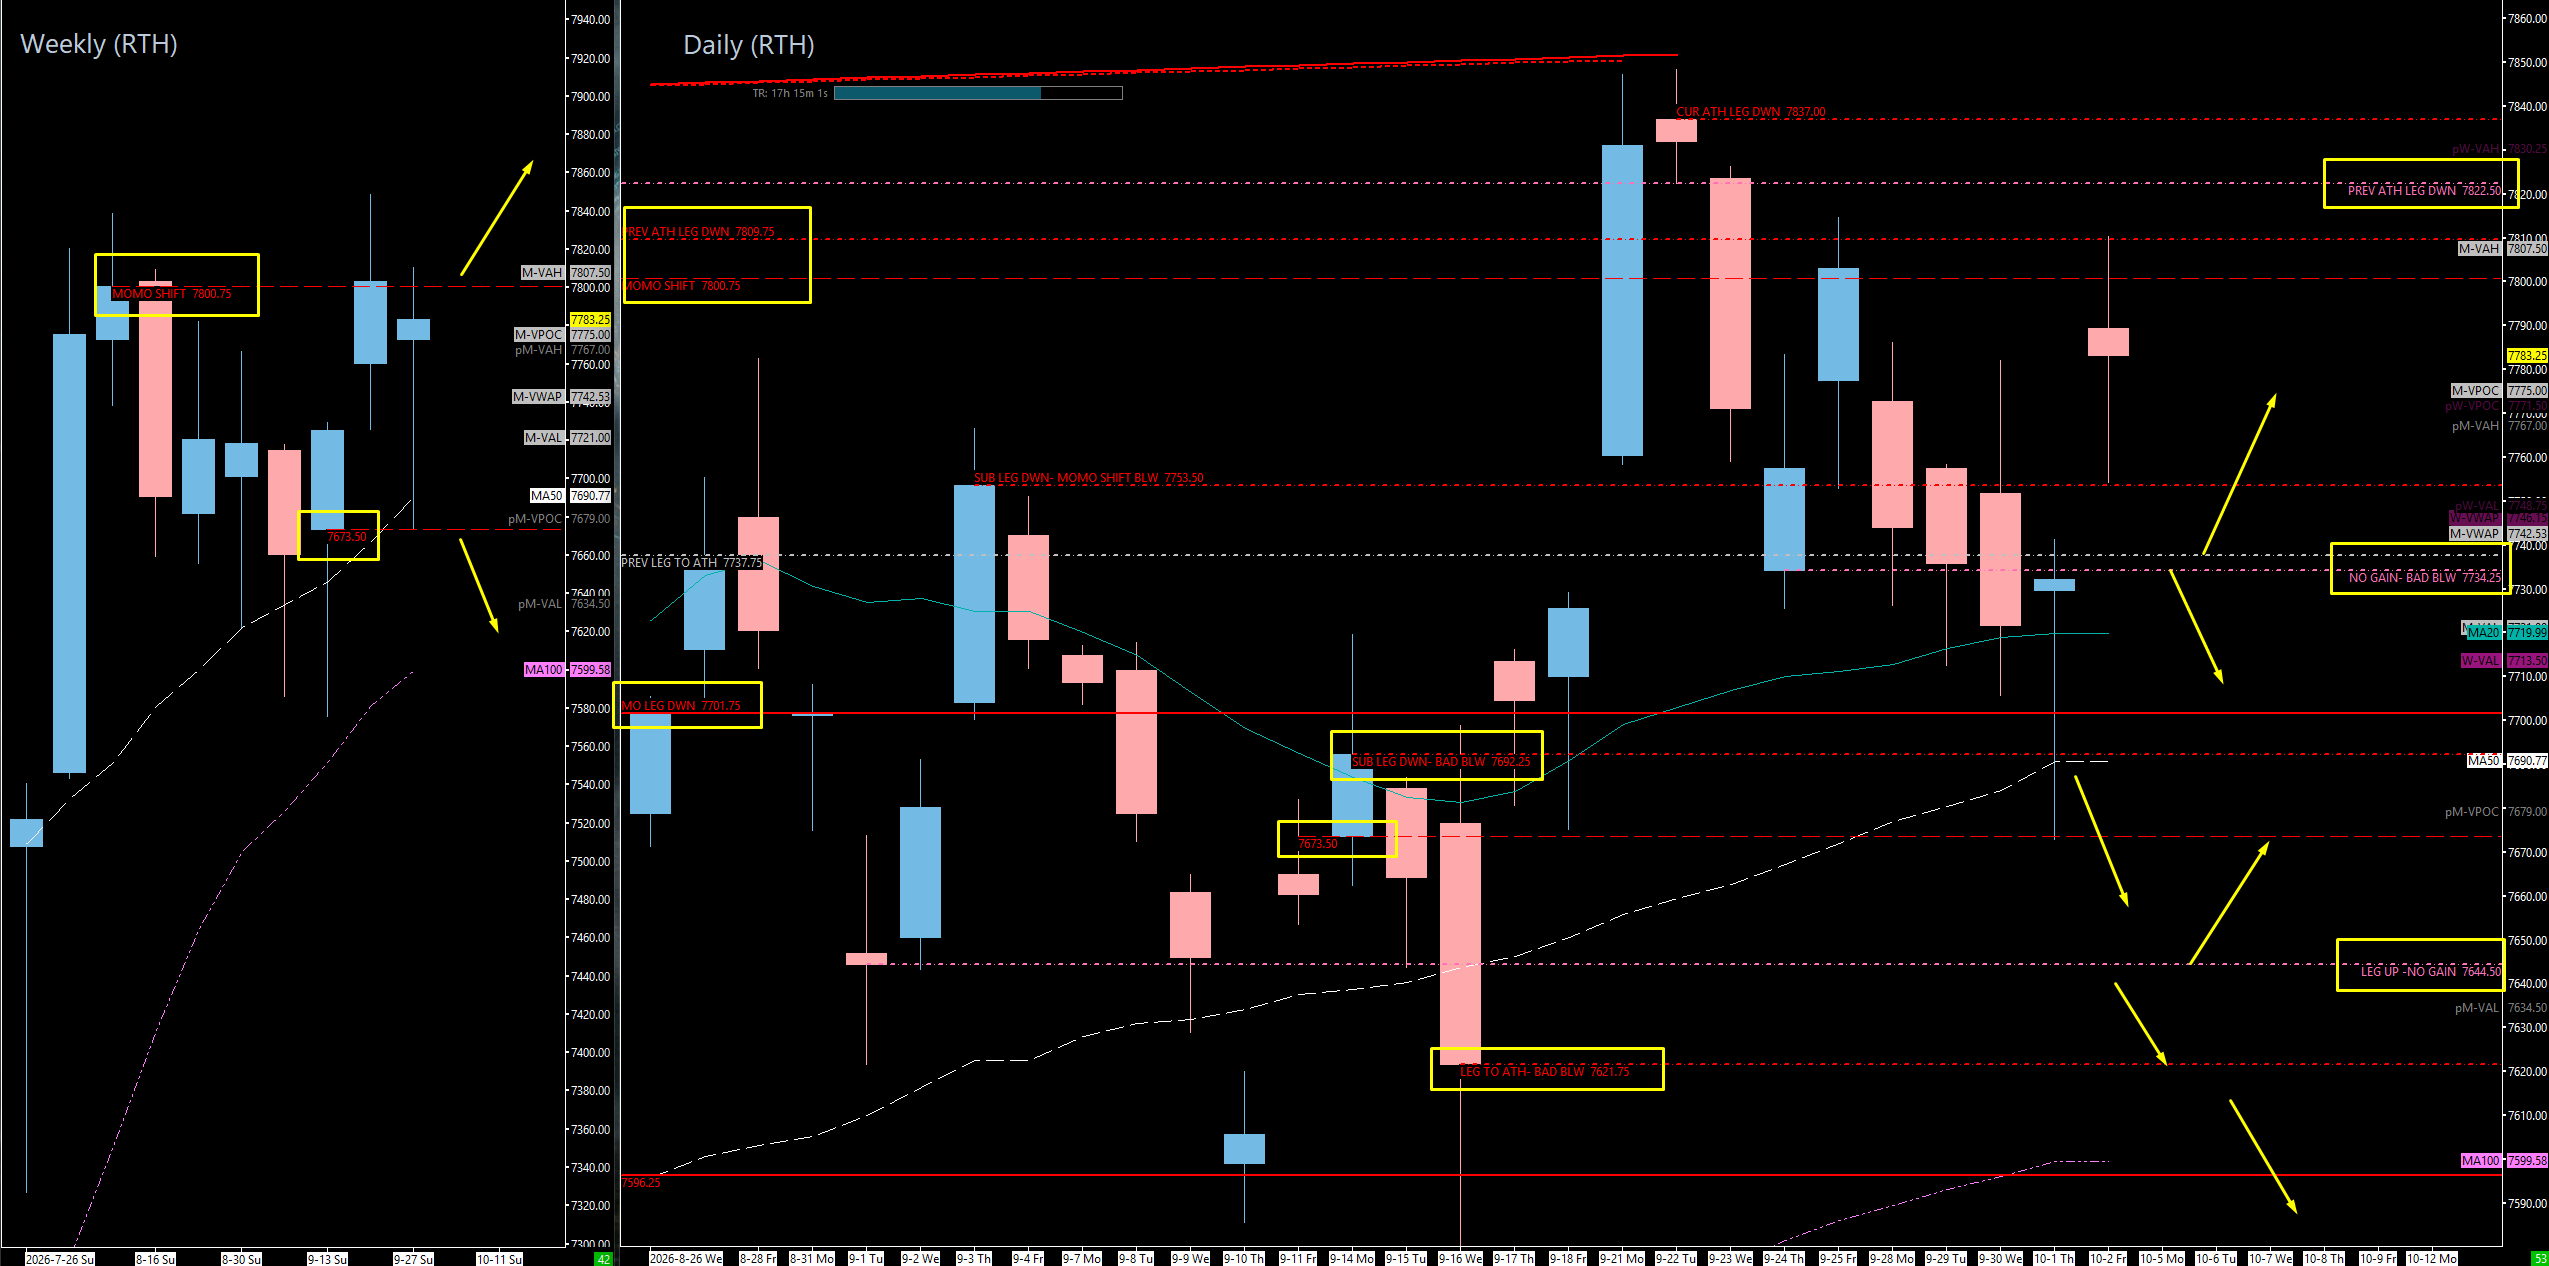
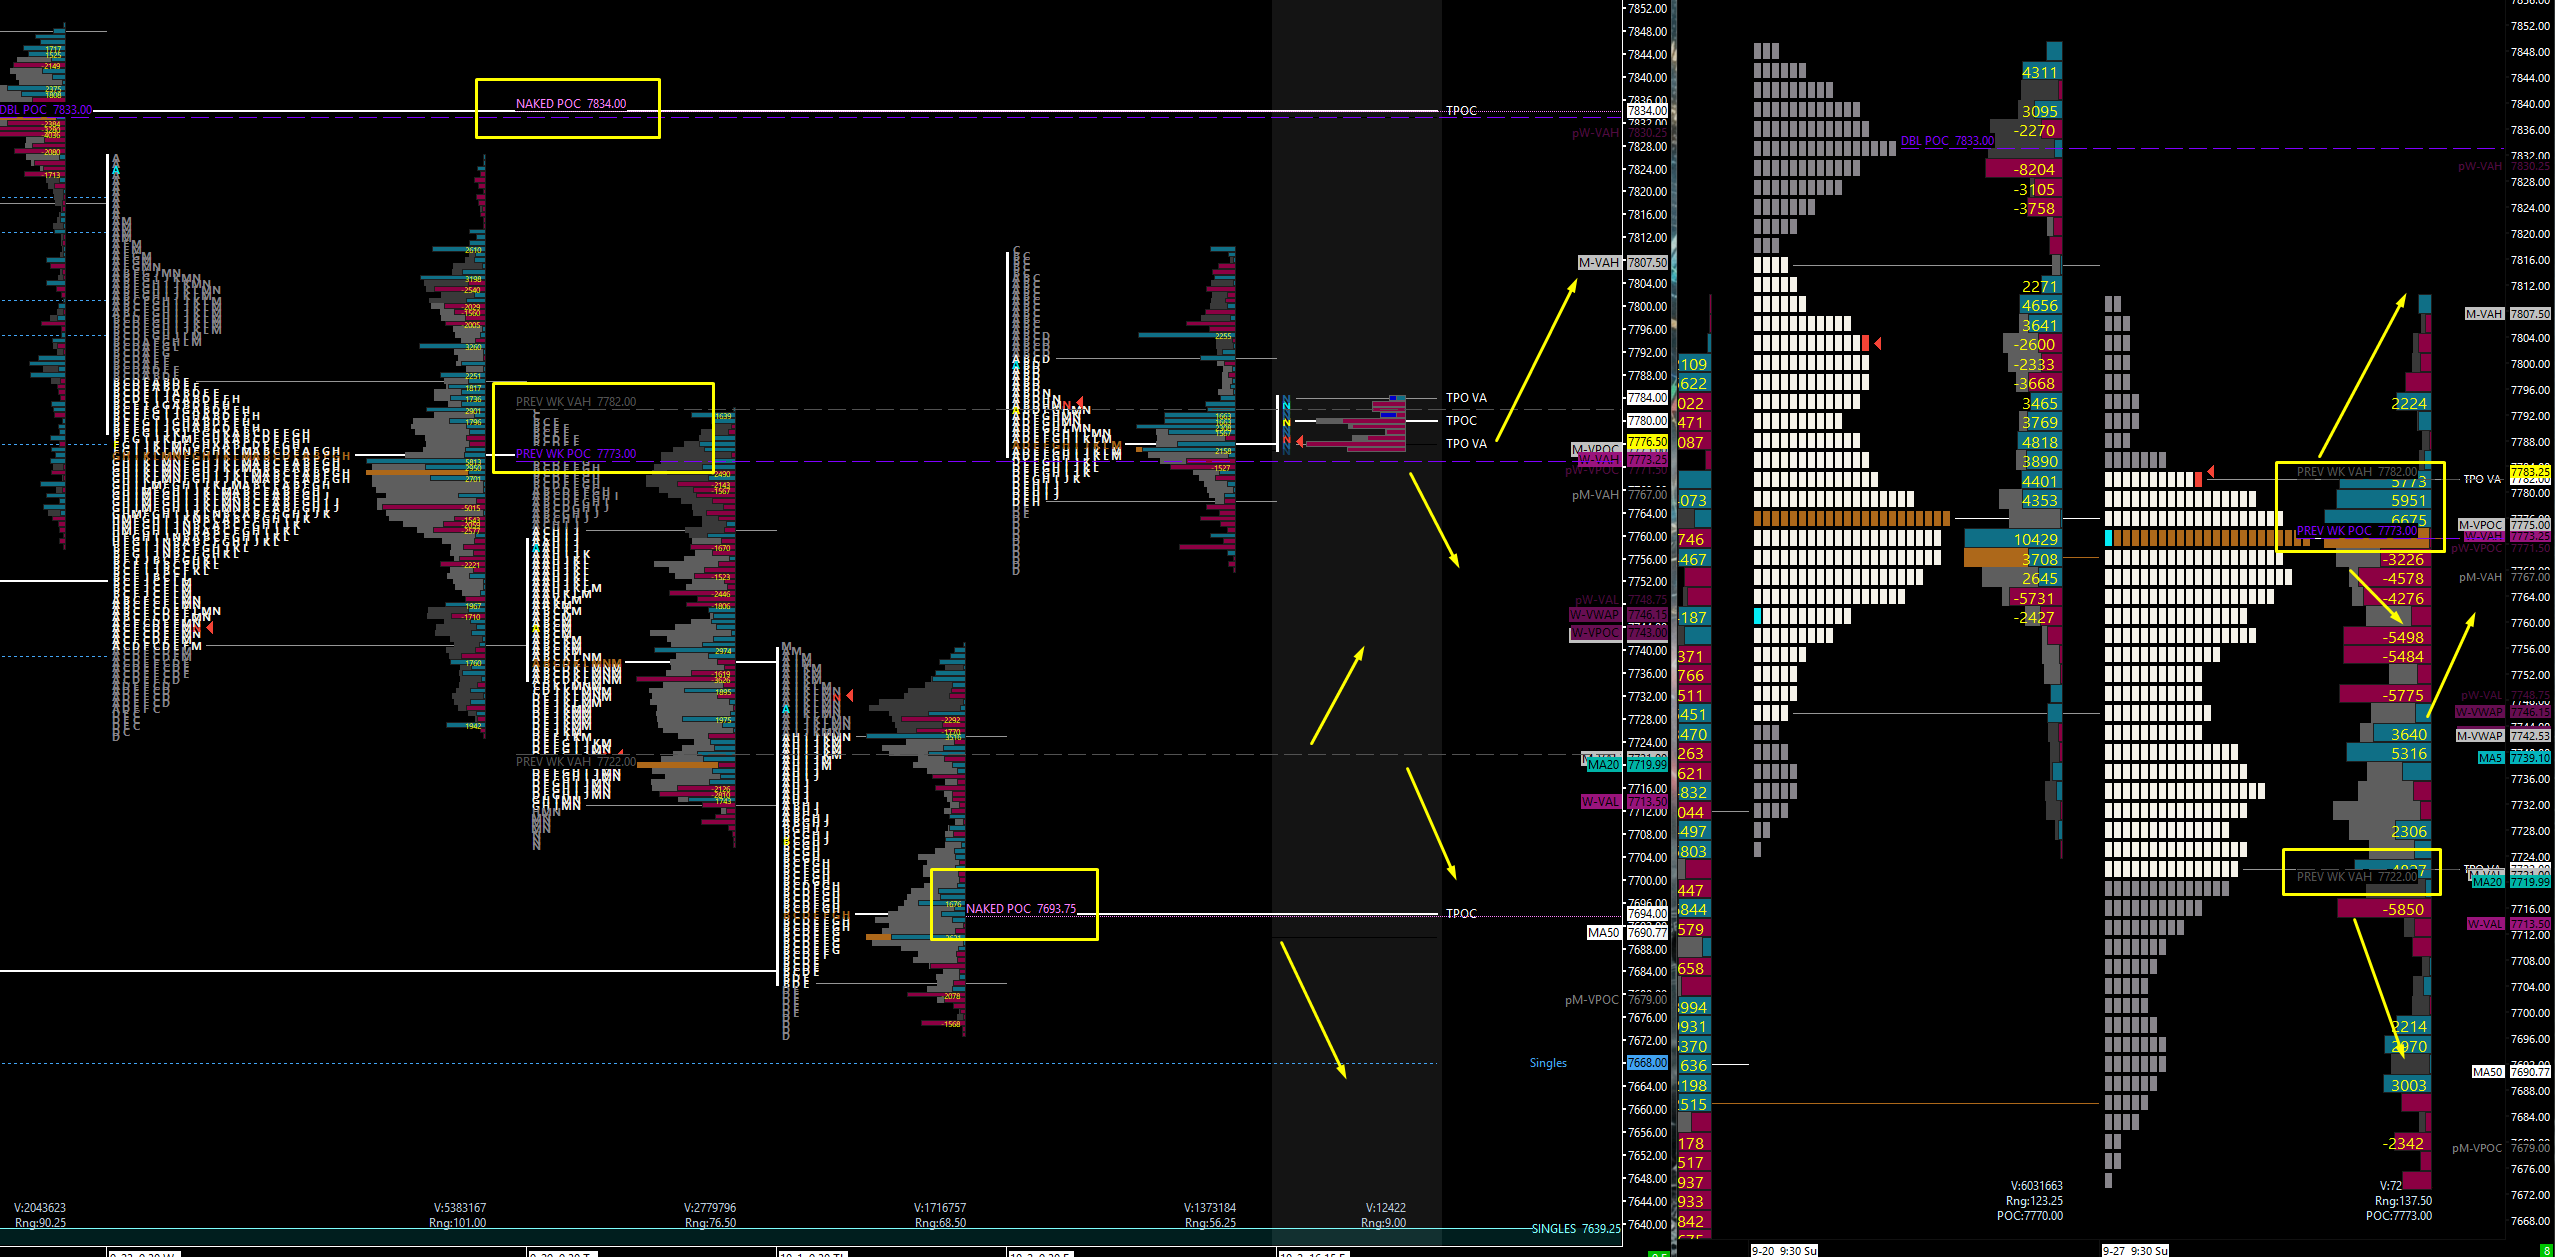
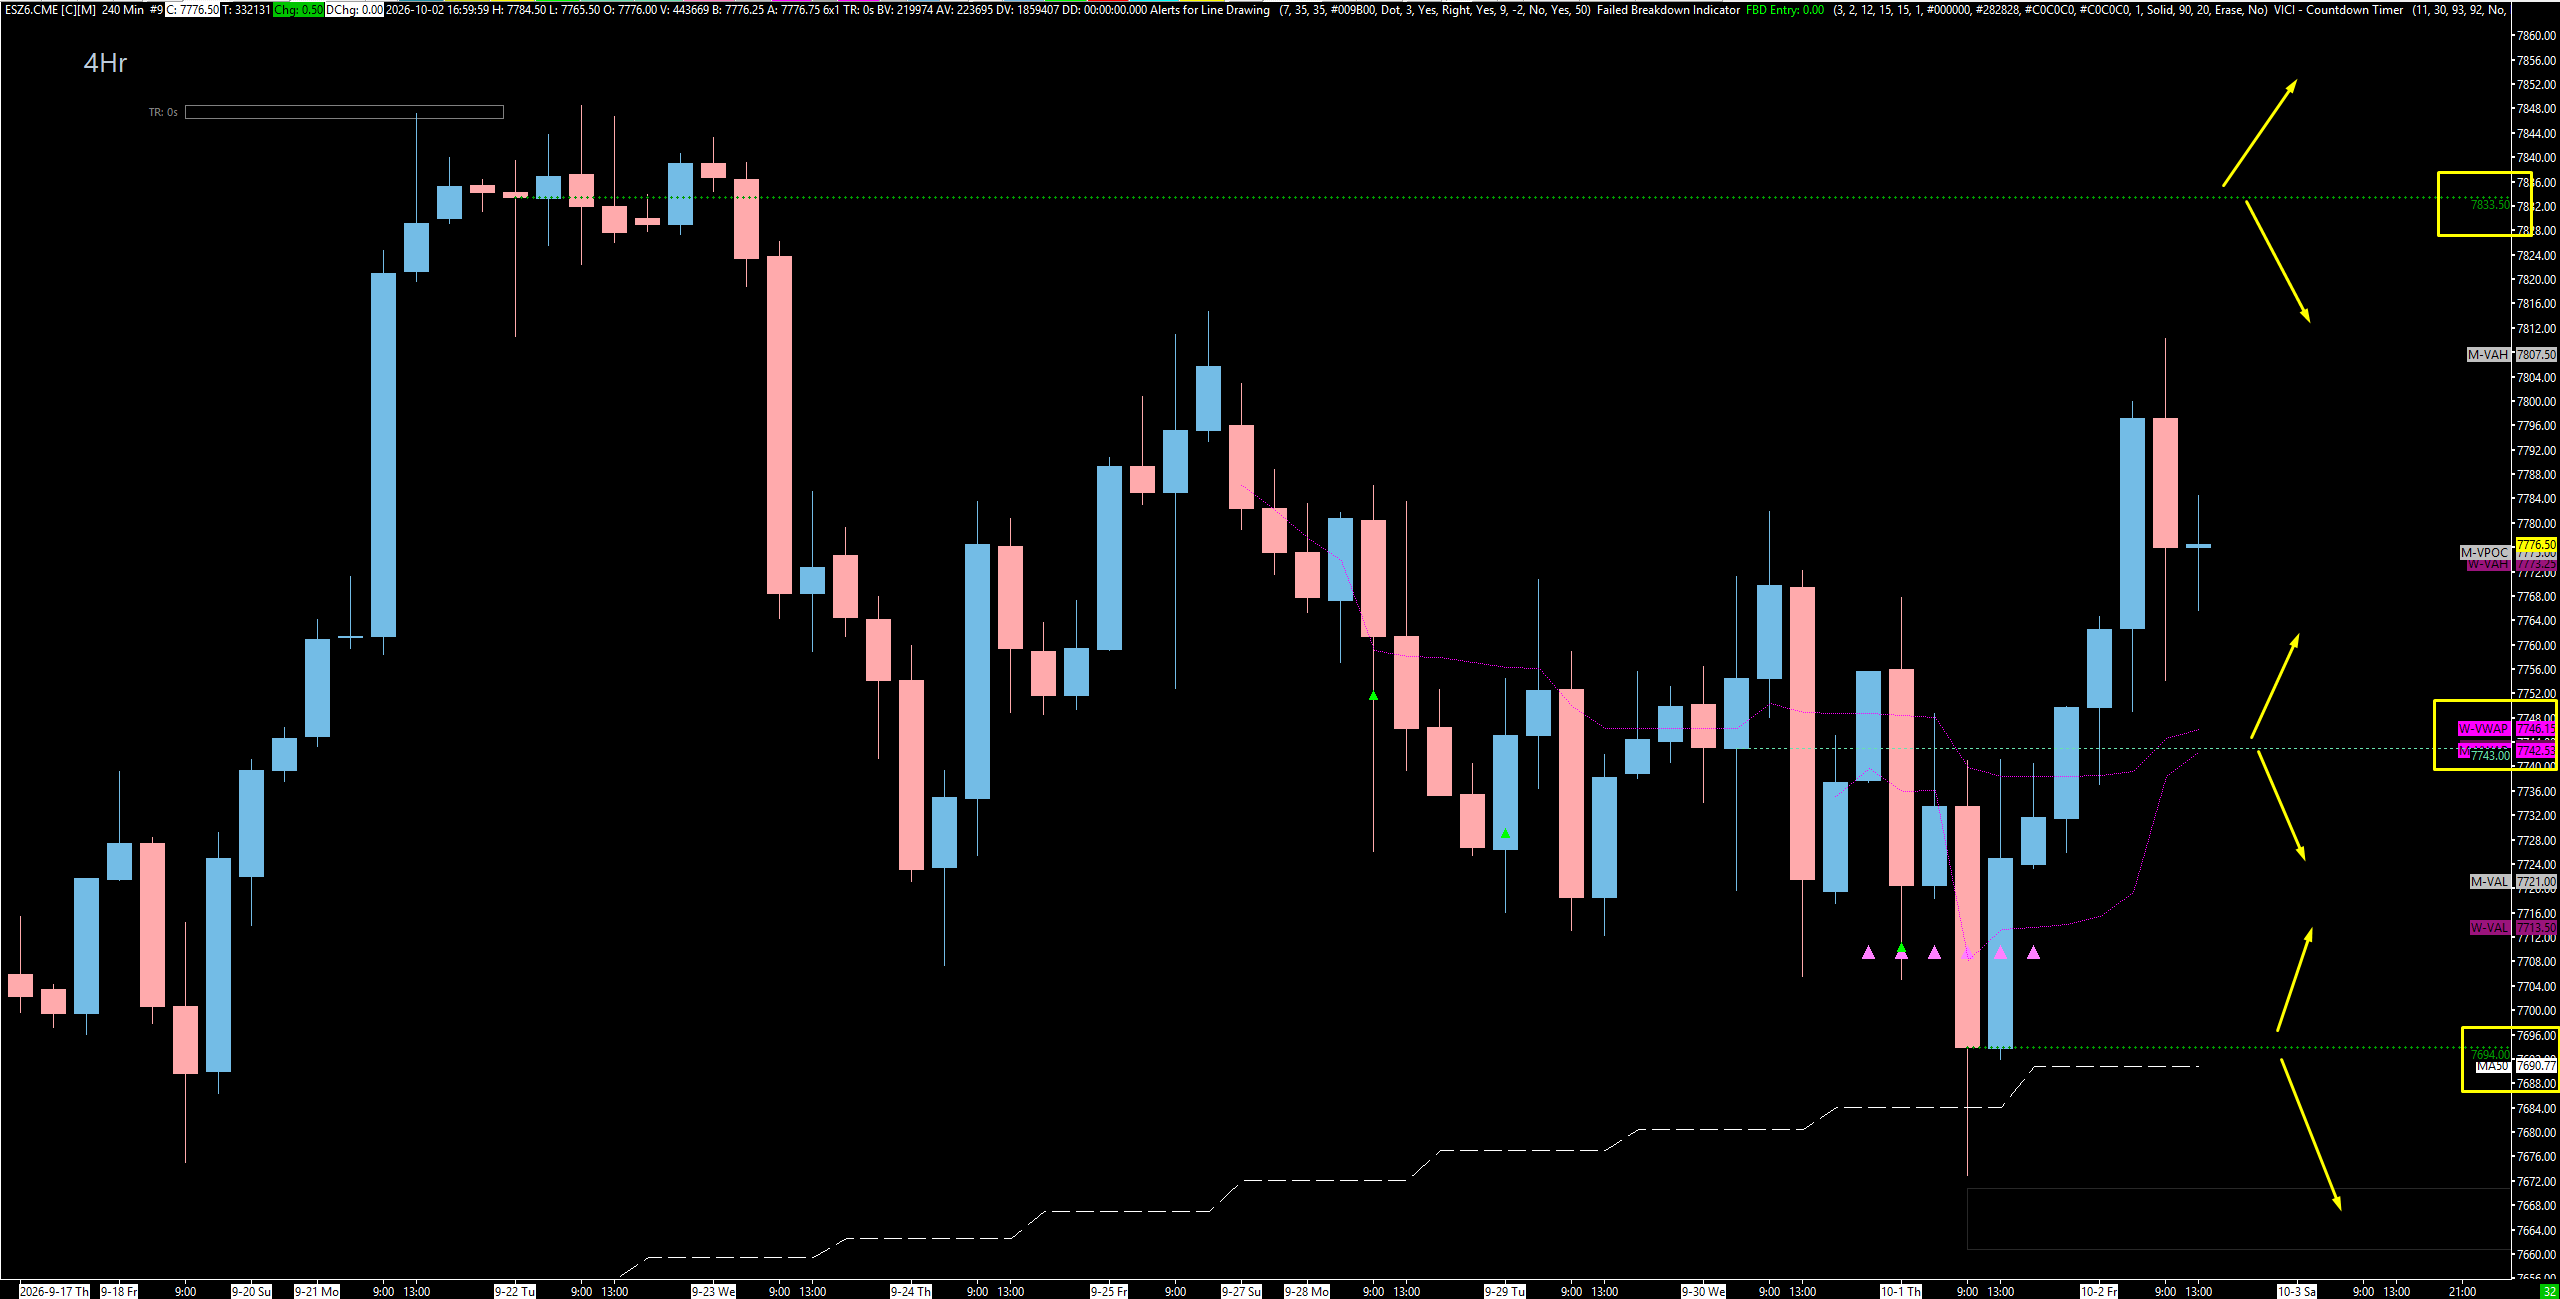
On the ES weekly TPO, this was the view that caught that massive low — a beautiful spot. We pulled back, accumulated once again inside the previous week, and now we have overlapping points of control — the previous weekly POC is literally the same as the POC from two weeks ago. That is massive balance; we have not gone anywhere. I want you aware of two things from a high-timeframe perspective. One: underneath 7722, things start to go bad and they go bad fast — and in my opinion it is actually a little higher than that. Two: the 7735 to 7740 area is a big decision point. I would normally get more excited if that were sellers getting stuffed, but focus on it when we get into the candlesticks. On the upside, as long as we hold the 7773 area and pop above the previous weekly value area high at 7782, we pretty much have liftoff for a push much higher into 7833 — the double distribution we created up there, sitting apart from the real OG point of control. I do believe we see a decent reaction from it.
On the weekly candlesticks, we pulled back into a level we were monitoring at 7673.50, a big weekly up. This is not how I normally work, but I was actually tracking it from last Thursday — call it gut feel, call it intuition — and it played perfectly. They held it, rebounded, and went up super nice. Two weeks ago we had a monster close well above the support on the leg down and created a new all-time high, which gives me reason to believe we push higher. We also had a beautiful textbook setup on SPX for my course holders, which, based on our process, tells us we will at least produce a new high above our current move down.
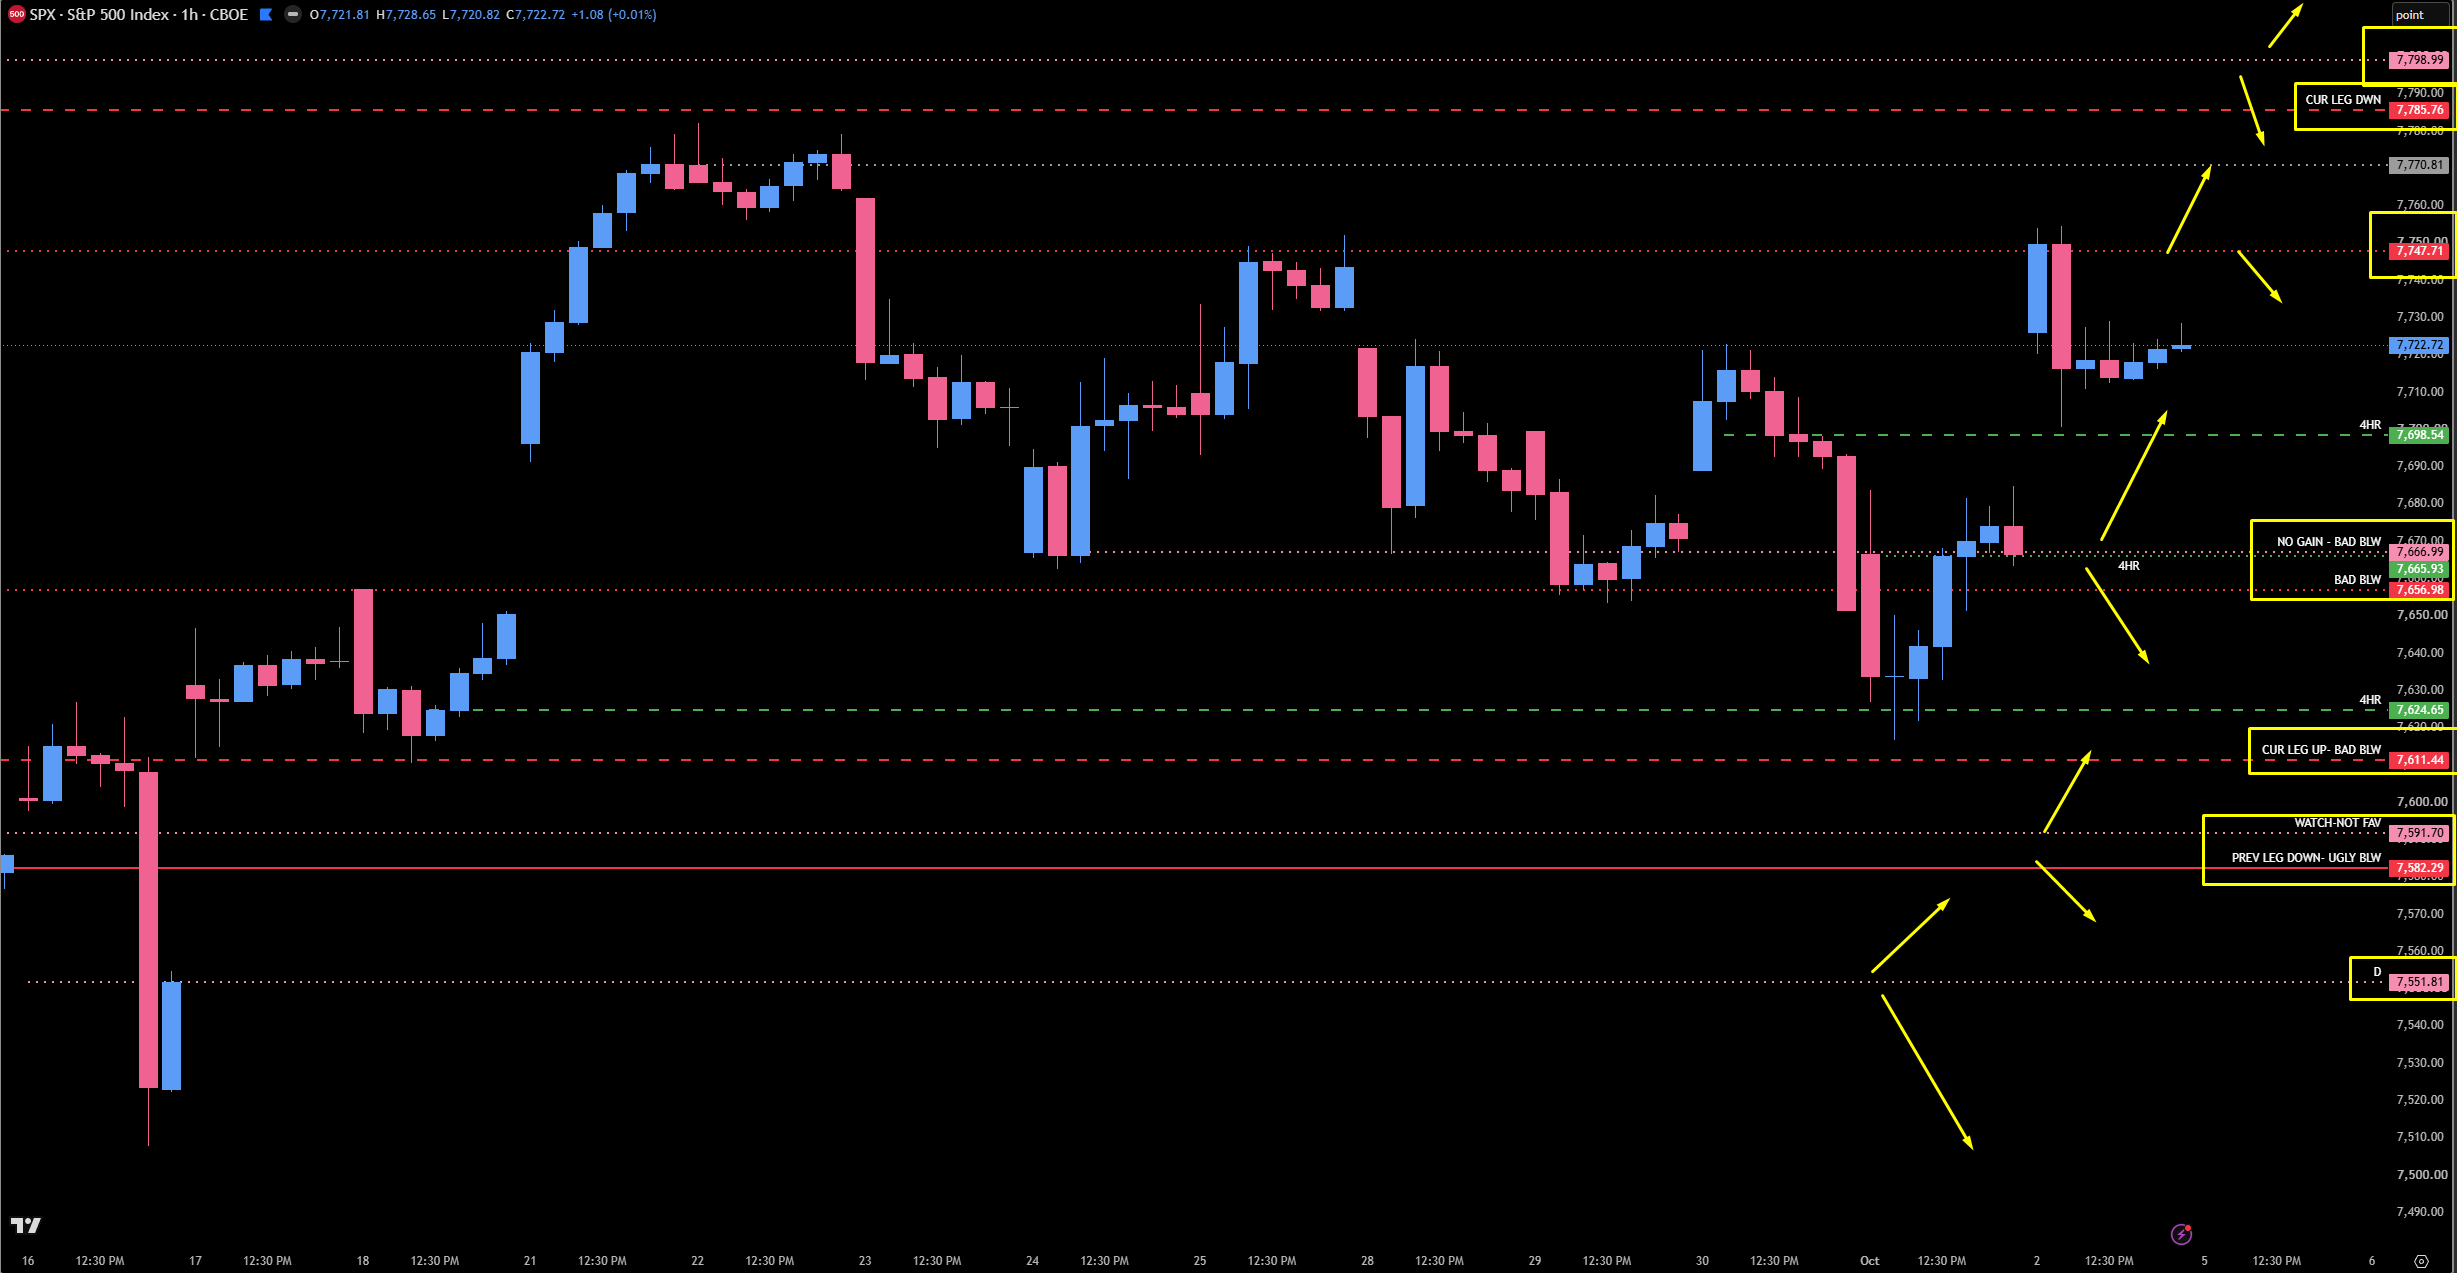
On SPX, this is where it gets really interesting, because we really do not have a whole lot of support to speak of. We are up on the four-hour and daily, not yet gained on the weekly, and our areas of support are extremely muted. We have one spot: 7666.99. It is untested, it is both a daily and a four-hour, and it is the shoulder to this really massive support. Look how many times that area has played over and over again. I like it a lot — it is a textbook setup, and I am going to be taking this trade without a doubt. It also has confluence with an ES level. But you can see I have “bad below” written right underneath it: we have nothing left untested. If we slip below the 7656.98 daily, which was important again on Thursday, there is nothing untested until 7591.70, a massive untested daily aligned with a monthly. And be careful down there, because the 7611 weekly is a massive momentum shift pivot — simply being below it shifts confidence in favor of the bears. Below that weekly is another daily at 7551, absolutely untested and a huge gap fill, and I would probably buy it — but we would get capped right away by the big monthly/daily levels above, which makes longs down there not only dangerous but not long-lasting. Right now, the 7747.71 daily — Friday’s high — capped us, and we came down into the big four-hour at 7698.54. That is our only four-hour support, truly the shoulder on this move down, and it has held us so far. If we push below 7698.54, SPX comes down into the one and only untested area at 7666.99. And 7698.54 is also the breakout spot: above it, we have nothing left untested until we get all the way up to the highs — the big 7785 weekly we have played, and the highest untested daily up there, where I anticipate a reaction. I doubt it is a crash play up there; more than likely just a head bump. Bottom line: if they hold this area and we break out, this thing is going to absolutely launch, and people are going to lose their minds. All you need to worry about is not why it is doing it, but how do I get on it. And the inverse: if we break below this area, we could be in real trouble for a long time.
🚨 VIX Analysis: The 16.39 Big Pivot
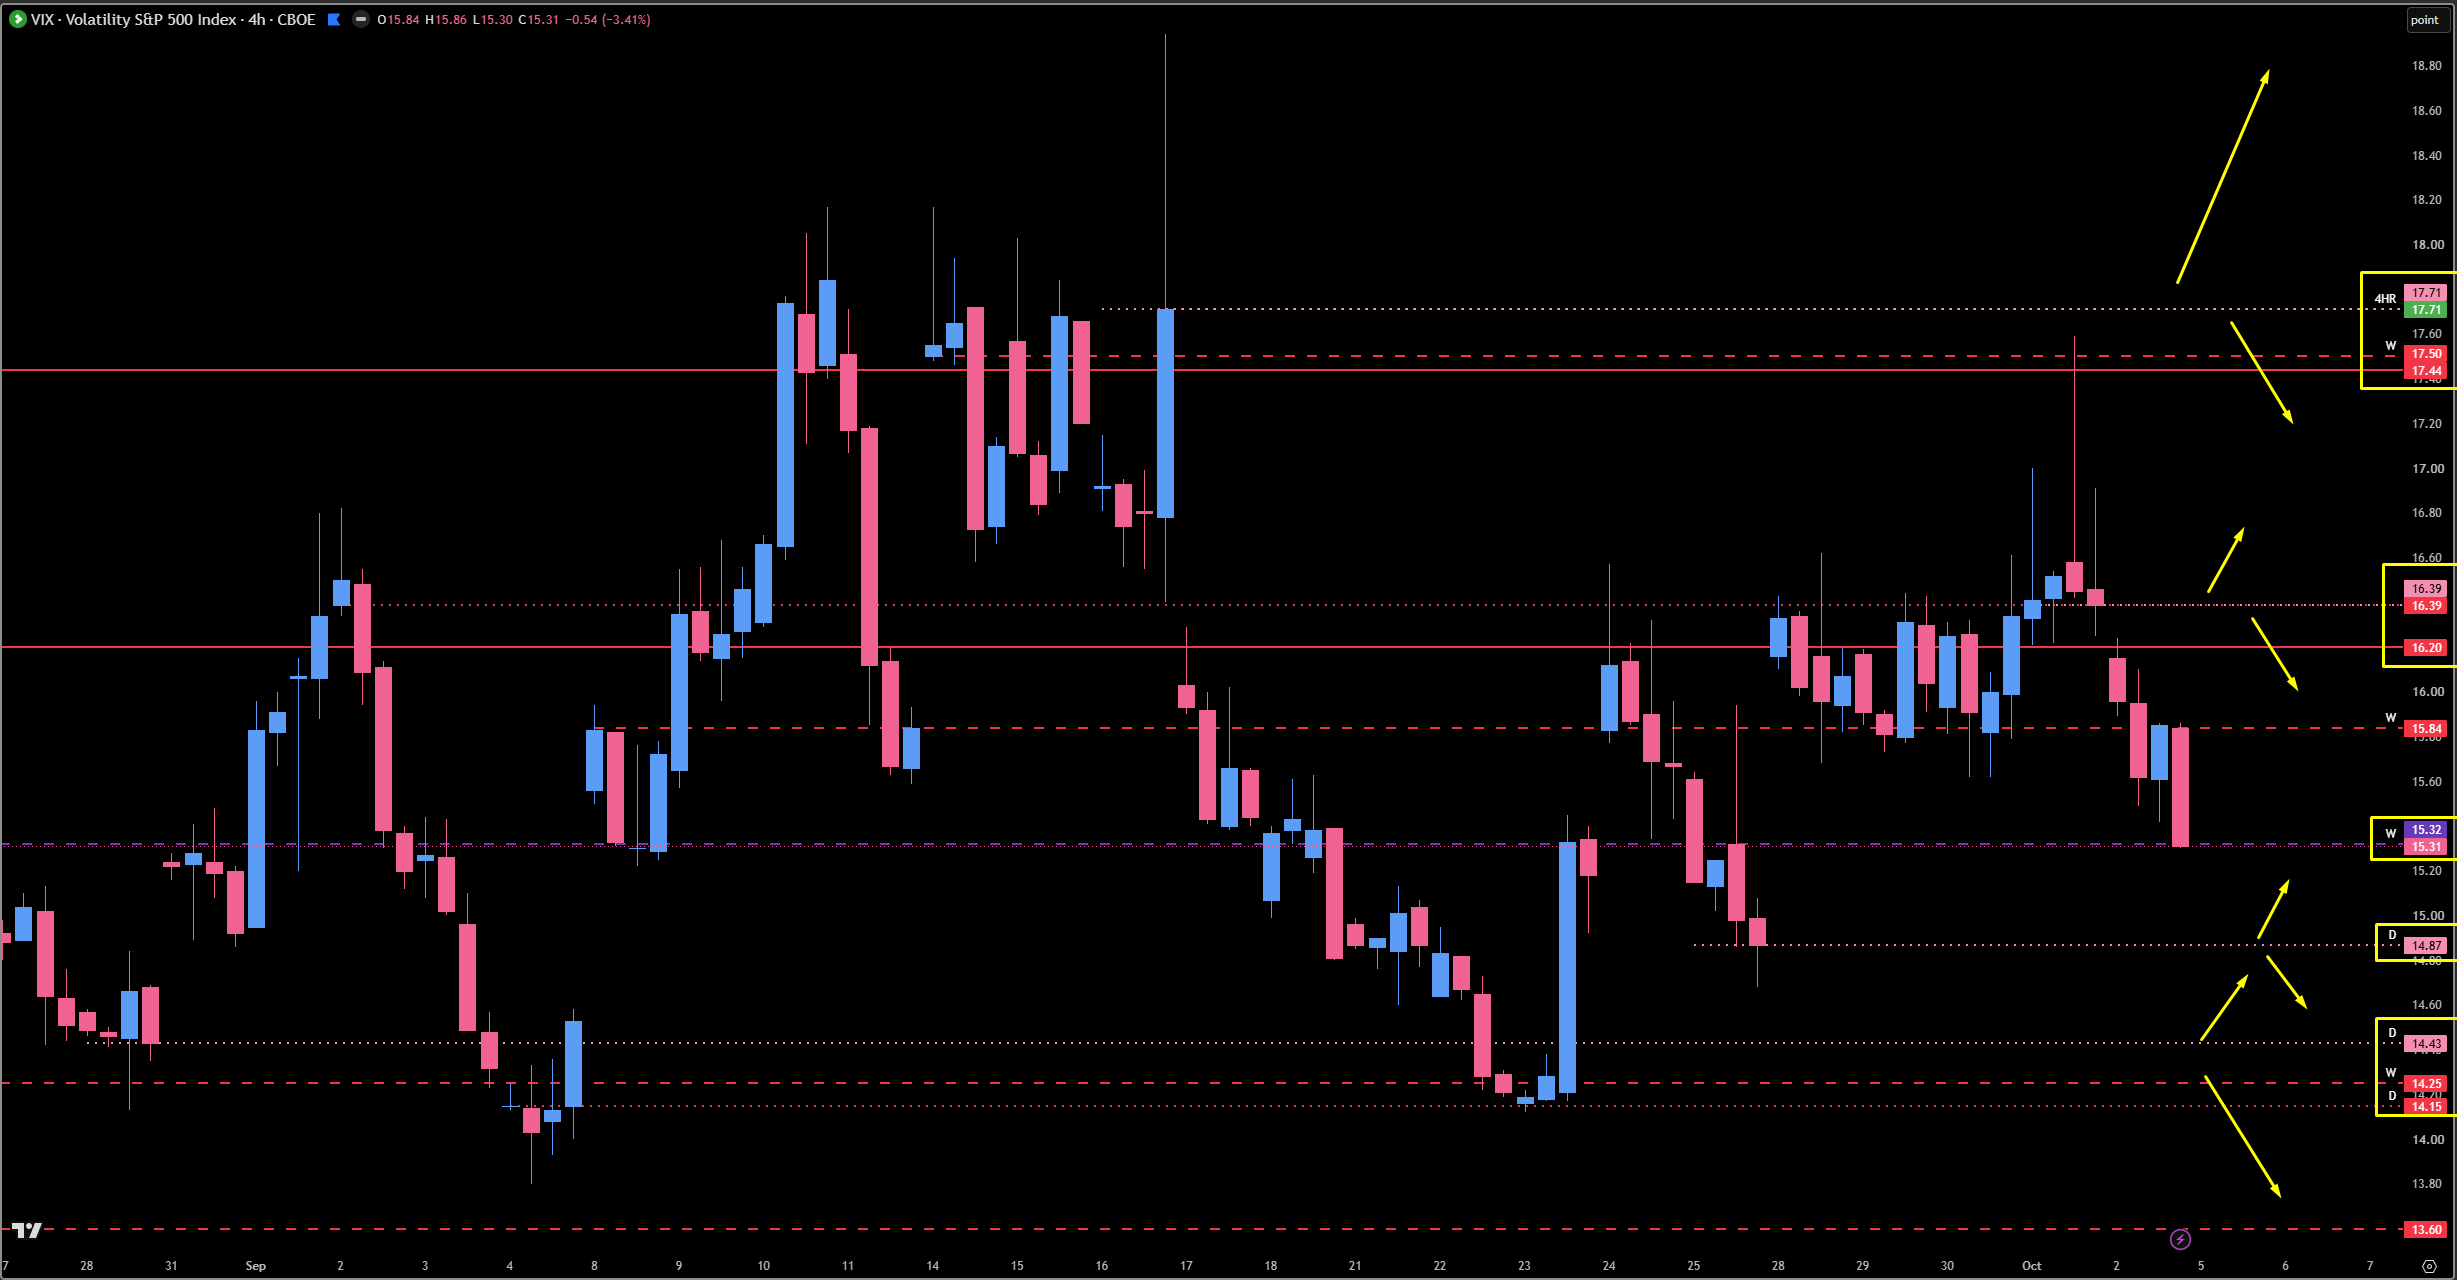
Here is the high-timeframe look on the four-hour. That was the beautiful smack from our 17.44 monthly / 17.71 daily area — the big push and the collapse that sent VIX down. We have to assume VIX continues to come down, because we still have not gained. VIX continues to pop up and lose, getting sold back every single time it comes into a massive resistance area. We are now underneath 17.44, back below 16.20, and — to make things even worse for VIX — below the 15.84 weekly that kept it propped up all last week.
The Current Spot: 15.32 (Weekly). We came down into our next major spot and closed here Friday. We played this from the bottom side and the top side two weeks ago, telling us it was going to be important. We could get a potential reaction on the open — it would not surprise me, given they usually buy VIX up on Friday. If it holds, we could get a little pop, but nothing to be concerned about.
The Big Pivot: 16.39 (Untested Daily). This is not just a single daily — it is an older daily that has remanifested at the exact same price point, which tells me it is going to be a massive area to get above or below once again. If we push above 16.39, VIX can easily continue higher — and because the area above was wiped and tested Thursday, from a process perspective it could potentially move much higher. As long as we are below 16.39 and ultimately 16.20, VIX remains bearish. That is where we get our antennas up — above it, the indices could come down. Below it, we have the wind at our backs.
The Gap Fill: 14.87 (Daily). Created for the daily leg up on VIX, a major gap fill, and very much untested. Keep an eye on it — but as we drift lower, these could just produce little pops, which could give the indices some inverse reactions. Being below 16.39 and 16.20, we are still pointed to the upside.
The Last Untested: 14.43. You know how I feel about the $13, $14, $15 handle. This is the last and lowest untested spot. I am not sure it gets a massive reaction, but I predict it gets a reaction — so if you are long the indices, that is a good point to take profits. Below 14.43, VIX could continue to peel off much lower.
The Big Picture: VIX has been sitting in roughly an $18 to $14 handle since August, balancing sideways without making progress. But if it continues to accumulate down here, at some point this thing is going to take off screaming — especially because we really only have one big level keeping a lid on things right now: 16.39.
🎯 Detailed Actionable Trade Plan (ES Futures)
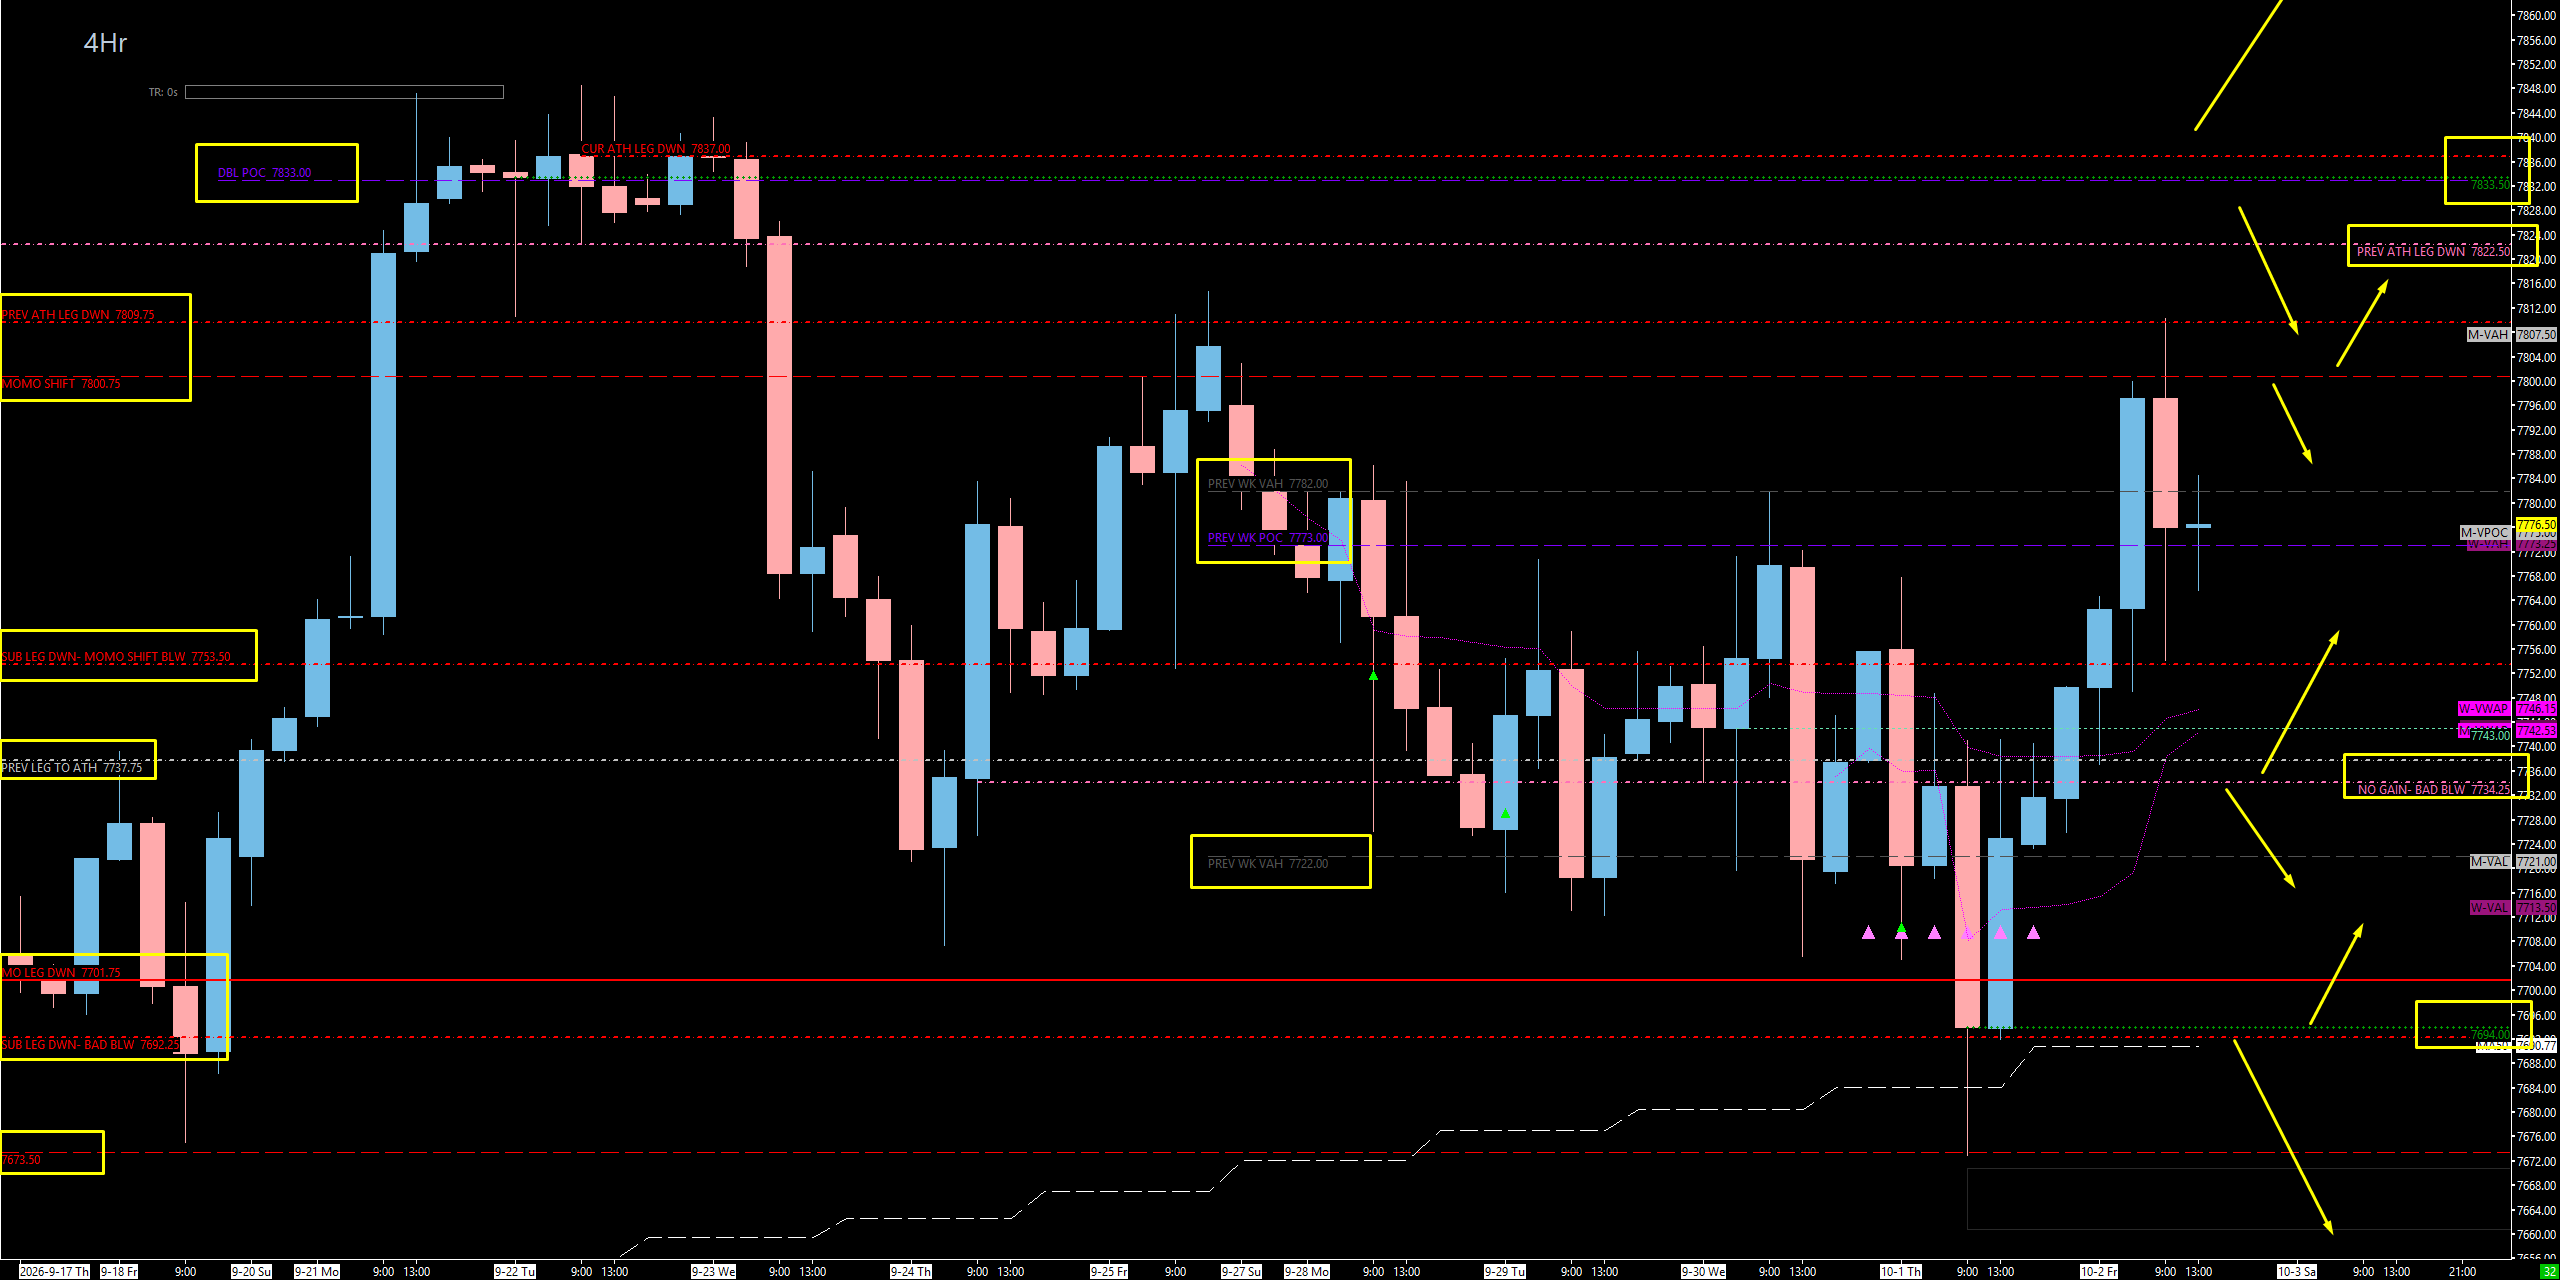
ES is up on all timeframes, so we are looking up — but support is thin. Hold the 7773 area and pop above the 7782 previous weekly value area high, and we have liftoff into 7833.50. 7800 / 7809 remains our big momentum shift level — Friday was our third rejection from it. On a pullback, I have two spots I am really watching: the 7743.50 one-hour/four-hour area with the monthly and weekly VWAP (trigger above 7749), and the 7734.25 — the only untested daily and the last untested high-timeframe area I have. That is where everything goes well or goes bad. Underneath it, the 7722 previous weekly value area low gives way and we have nothing untested on the four-hour until 7694.
🔴 Key Resistance Zones & Setups
The Liftoff Trigger — P.W. VAH: 7773.00 - 7782.00
7782.00 (Previous Weekly Value Area High), 7773.00 (Hold Area — Previous Weekly POC Region).
Context: It is pretty blatantly obvious: as long as we maintain above the previous weekly point of control area, we start to get a pop higher. Basically hold the 7773 area and pop above the previous weekly value area high at 7782.
Actionable Setup: Above 7782, we pretty much have liftoff for a push much higher into 7833.50, where I do believe we see a decent reaction.
The Big Momentum Shift: 7800.00 - 7809.00
7809.00 (Momentum Shift Level), 7800.00 (Momentum Shift Level).
Context: We know 7800 and 7809 have been a big spot for quite some time — our big momentum shift level. Every time we approach it, it becomes important. This is our third time up here, and once again we got a rejection from it on Friday.
Actionable Setup: A clean push through 7809 opens the reaction zone above. On the way back down, getting back below 7809 and 7800 confirms a pullback is underway.
THE REACTION ZONE — Last Untested Daily & The Lost Four-Hour: 7822.50 - 7833.50
7833.50 (Four-Hour — Highest Support That Was Lost + Double Distribution), 7822.50 (Last Untested Daily).
Context: I have exactly one area of resistance on the four-hour: 7833.50 — and that should ring a bell for many of you. It is the highest support that was lost, and it will produce a reaction. I do not know if it is 10 points or 50, but we should get something from it. It lines up with the double distribution at 7833 from the weekly TPO. Just below sits the last untested daily at 7822.50, also a great spot. Somewhere between 7822.50 and 7833.50, we are going to get a reaction — if I had to guess, probably from the higher one. Watch the whole zone; it is highly reactionary.
Actionable Setup: Short Setup / Take Profits: If they play 7822.50 and get back below the wick — and below the 7809 and 7800 — this could get a pretty nice pullback.
Warning: I am anticipating a reaction up here, but hopefully it is just a head bump. If we go to 7833.50 and punch through, we go much higher.
🔵 Key Support Zones & Setups
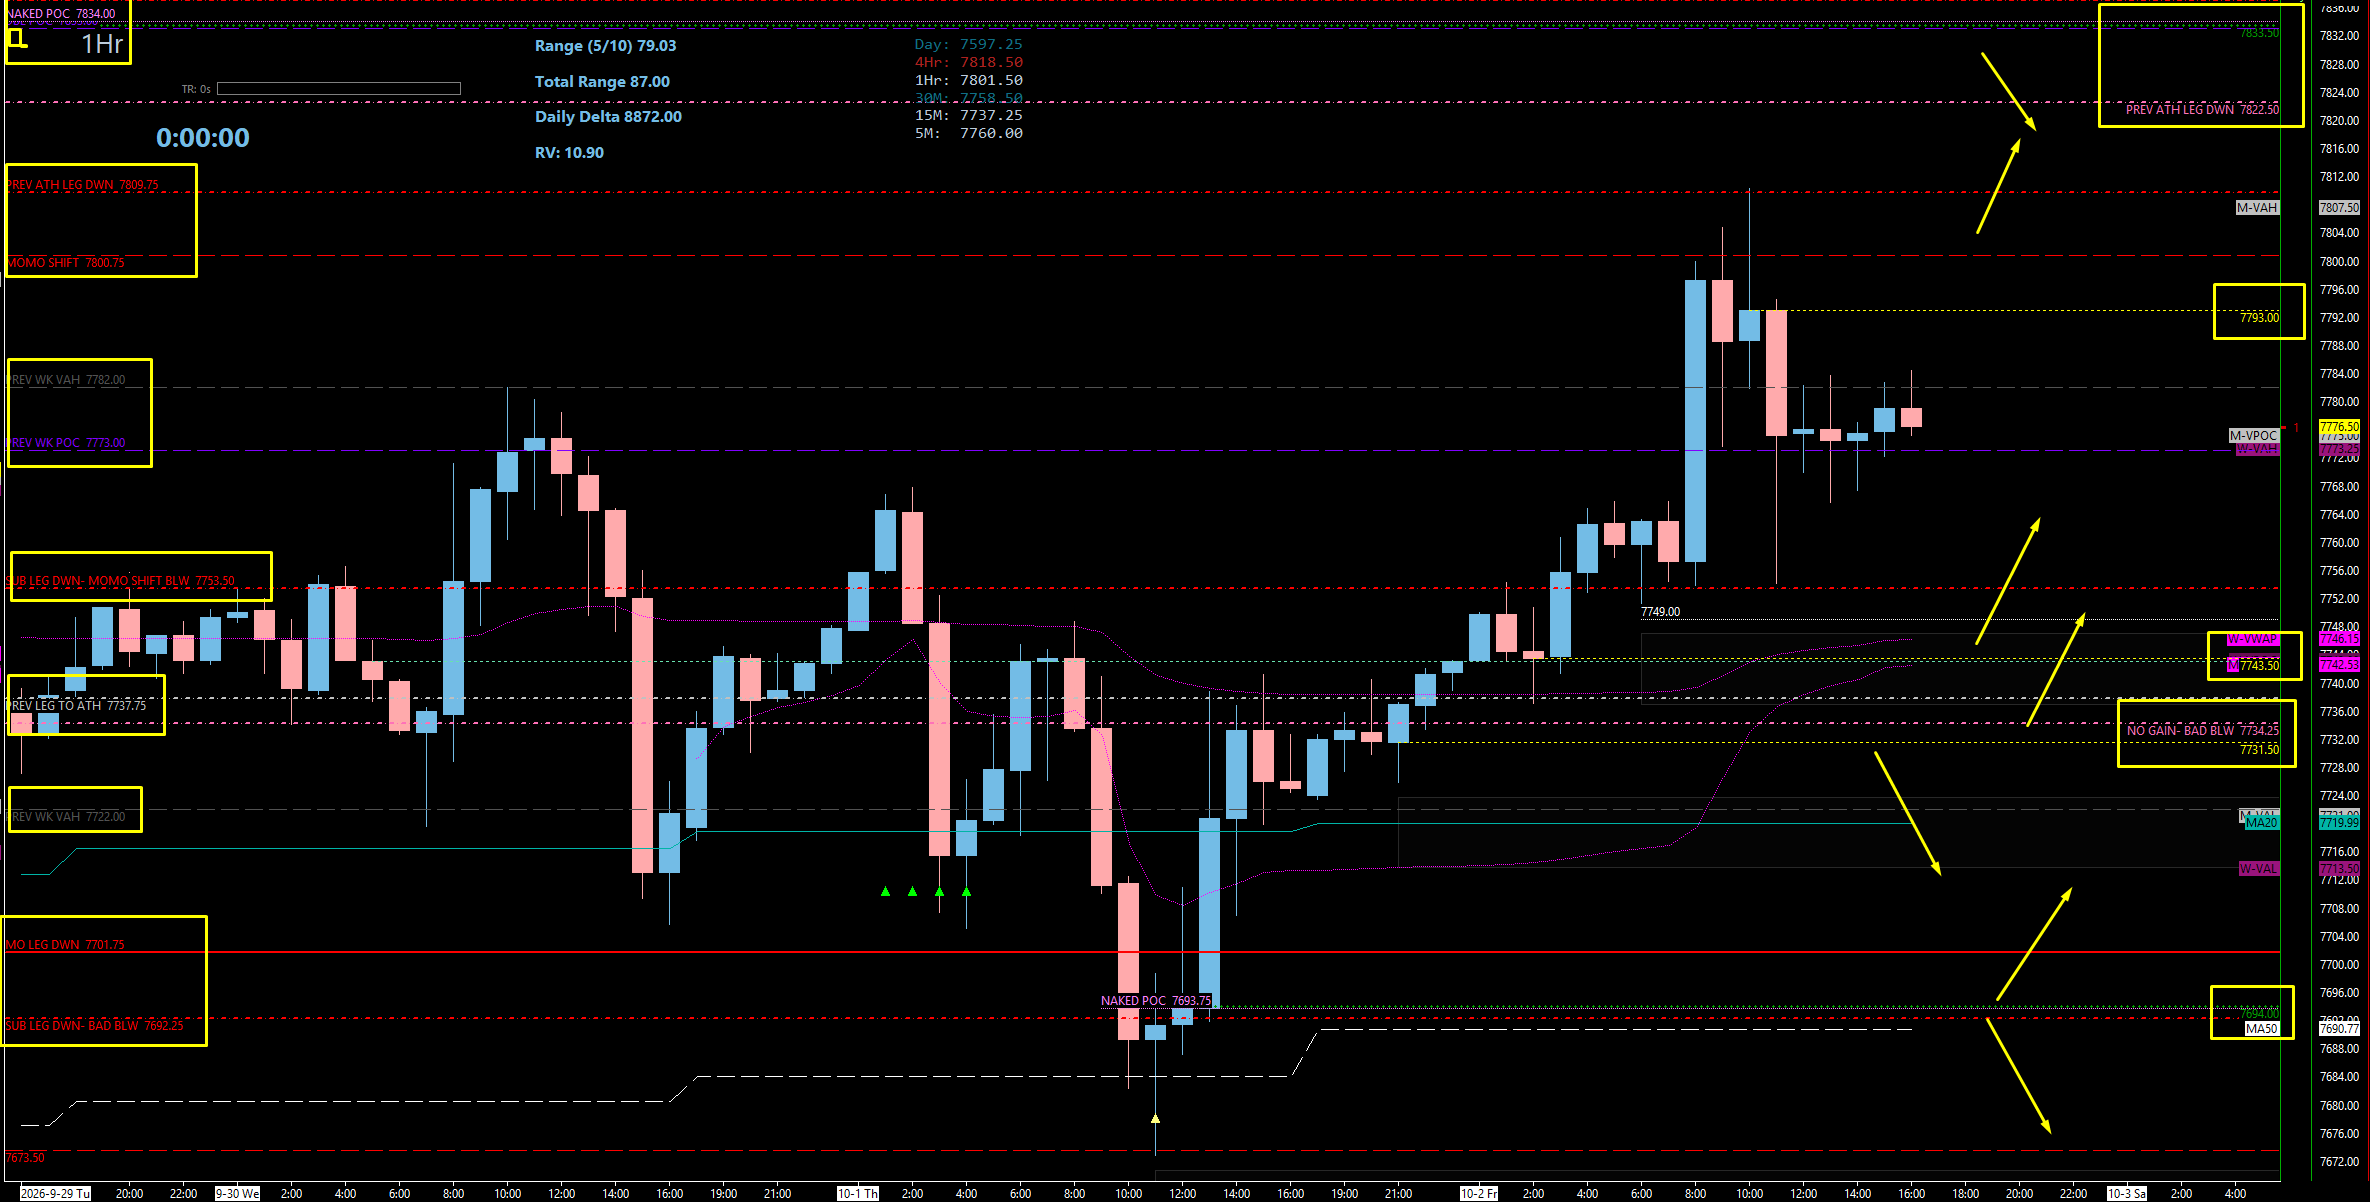
The Above/Below Pivot — Friday’s Launch Daily: 7750.00 - 7753.50
7753.50 (Daily — Held Twice), 7750.00 (Big Above/Below Pivot).
Context: You know 7750 has been a big above/below pivot for us for quite some time, and it was huge on Friday — we launched from it, came back, and tested it. Right above it, the daily at 7753.50: in Thursday night and Friday morning’s Globex, we held 53, launched, played our big area, came right back down — and held 53 again. That tells you it is going to be a massive area to get above. For those of you who have traded with me longer than a week, you know why.
Actionable Setup: Get above 7753.50 to move higher. This is the confirmation level on the long from either buy spot below — once above it, we could potentially just squeeze.
BUY SPOT #1 — The Value Lean: 7743.50 - 7749.00
7749.00 (Engage Trigger), 7743.50 (One-Hour + Tested Four-Hour Area), plus the Monthly VWAP and Weekly VWAP.
Context: Remember on the weekly TPO I said I was really interested in this 7745 to 7735 area — there is something going on in there. It is also where the monthly and the weekly VWAP sit, which in terms of assessing value tells us that is where value is, on both the monthly and the weekly timeframe — the same thing as saying that is the point of control on the TPO. You know I am not a fan of one-hour levels, but the 7743.50 one-hour is perfectly in line with the monthly and the weekly. This four-hour area is tested, so I am going to call it tested and use it as something to lean on — but it could definitely present a nice buying opportunity. This is one of the two spots I am really going to be watching on a pullback.
Actionable Setup: Buy Setup: If 7743.50 plays, we want to see price get back above 7749 before we engage. That cements the move up and we should be perfectly fine getting on it. Then we look for a pop above the daily at 7753.50 to move higher.
BUY SPOT #2 — THE MAKE-OR-BREAK: 7731.50 - 7737.75
7737.75 (Reclaim Trigger), 7737.00 (Tested Daily — Leg To The All-Time High), 7734.25 (Untested Daily — Only Untested Daily), 7731.50 (One-Hour).
Context: This is the big one. From a daily timeframe, we only have one spot: 7734.25. It is the shoulder here, and it comes from a previous leg to the all-time high on the left as support. It is technically untested — we actually missed this level; price played the one above it, the daily at 7737. It is deep in the pocket, it has confluence with a one-hour at 7731.50, and it is truly the last spot we have — the last untested high-timeframe area I have. This is truly where everything goes bad or goes well.
Actionable Setup: Buy Setup: If they end up bleeding down through here, I want to see the 7734.25 / 7731.50 area play and get back above our daily leg to the all-time high at 7737 — call it 7737.75 for the trigger. That would be a massive momentum shift for us, and then ultimately above 7743.50 and 7753.50. If that plays, we are going to get some major liftoff — all the way back up to the highs and into the last untested daily at 7822.50.
Warning: Underneath this, it all goes bad.
The Previous Weekly VAL — Where It Goes South: 7722.00
7722.00 (Previous Weekly Value Area Low).
Context: On the weekly TPO I showed you that underneath 7722, things start to go bad and they go bad fast — and I said it was actually a little higher than that. It is: the real line is the 7734.25 daily right above. But 7722 is the previous weekly value area low, and losing it confirms we are heading south.
Actionable Setup: Treat a sustained break below 7722 as the confirmation that the bulls have lost the high-timeframe floor, at least momentarily.
The Last Untested Four-Hour — 50-Day Confluence: 7692.00 - 7701.00
7701.00 (Profit Target / Reclaim), 7694.00 (Untested Four-Hour — Leg On This Move Up), 7692.00 (Daily), plus a point of control and the 50-Day Moving Average.
Context: Below the make-or-break, we really have nothing left for untested four-hour support until we come all the way down to 7694 — the untested four-hour leg on this move up. It lines up with a nice point of control, the daily at 7692, and the 50-day moving average. I know what you are thinking: “Jesus, Ryan, that is 80 points away.” Do I think we are coming down there right away? No. But it is the next area we will be monitoring.
Actionable Setup: Buy Setup: I do believe it plays on first touch, but I would be very cautious about actually trying to hold the trade. You already know your big target: 7701. Reclaim that and you can start taking profits.
The Held Weekly: 7673.50
7673.50 (Tested Weekly — Last Week’s Low).
Context: This is the big weekly up we pulled back into last week. I was tracking it from Thursday, and it played perfectly — they held it, rebounded, and went up super nice. It is the 7675 area we called five days in advance.
Actionable Setup: Reference support only — it has already done its job. A return here means the bulls have lost everything above it.
Death To The Bulls (Momentarily): 7644.50
7644.50 (Next Untested Daily).
Context: If they slip below the 7734.25 daily, everything is tested until we get all the way down to 7644.50, which is way down there and would be death to the bulls — at least momentarily. I say momentarily because we are still in this massive balance range, and the indices lean up by default.
Actionable Setup: The deep reference level. If we get here, the high-timeframe momentum has failed and we re-evaluate from scratch.
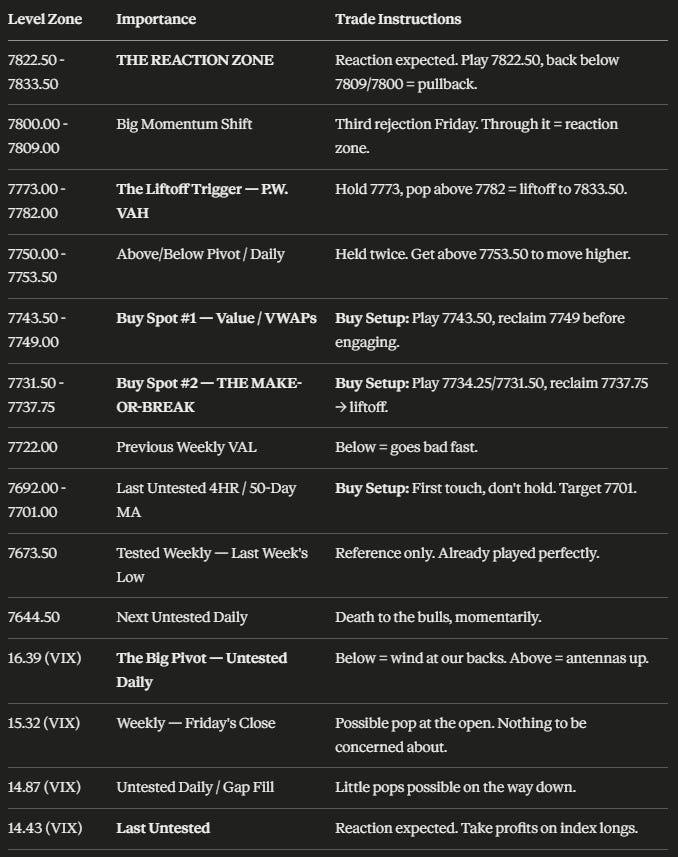
📌 Cheat Sheet – Key Levels Recap
🧠 Final Thoughts
This has been an extremely clear, extremely defined trade plan. We have VIX with the wind at our backs — below 16.39 and 16.20 — but we are getting dangerously close to that $14, $13 handle, where we always see reactionary pops. SPX has one spot to buy at 7666.99 — scary stuff. And ES has a couple of buy spots, but really one high-timeframe level we are focused on: 7734.25. Hold it and reclaim 7737, and we get major liftoff back toward the highs. Lose it, and below the 7722 previous weekly value area low it goes bad fast, with nothing untested on the four-hour until 7694.
The upside is just as clean. Hold the 7773 area, pop above 7782, and we have liftoff into 7833.50. 7800 / 7809 is the momentum shift we have now been rejected from three times, and the 7822.50 - 7833.50 zone is going to produce a reaction — I just hope it is a head bump. If the bulls hold this balance and break out, remember: accumulation since August could send this market to 8500 or more, and the only question you need to answer is how you get on it.
One thing I know for sure: we are coming off the summertime doldrums and entering an amazing volatility regime once again. We still have Negative Gamma at our backs, dealers hedging to the downside, and we can expect increased ranges and increased volatility. That is the environment where this process shines. Stick to the levels, use the actionable setups, and let’s go make some money. Cheers, and have an excellent one.
Until next time—trade smart, stay prepared, and together we will conquer these markets!
Ryan Bailey, VICI Trading Solutions.
📊 Indicator String
Copy and paste the levels below into your S&P Edge Levels indicator to automatically plot today’s key levels on your chart:
7833.50|4HR|4H
7822.50|D|D
7782.00|P.W. VAH|GD
7753.50|D|D
7743.50|Tested 4HR|T4
7737.00|Tested D|TD
7734.25|D|D
7731.50|1HR|1H
7722.00|P.W. VAL|GD
7694.00|4HR|4H
7692.00|Tested D|TD
7673.50|Tested WK|TW
7644.50|D|D


