

Welcome back everyone. Captain Bailey is in the house and we are back from rollover. It is an absolute pleasure to see everyone. It took everything in my power not to look at these markets this week, and hopefully you were able to do the same — relax, take the week off, touch some grass, and let all that nonsense play out. Because we are going to absolutely crush it this week. I cannot wait to get back, make some money, conquer these markets, and show everybody what time it is.
So I come to you for a very special Weekend Review today, because this is a fresh rollover special. We are coming back off rollover and all the levels are going to look different — SPX and ES both look different to me. And we have some discrepancies I want to talk about, because once again we have a very strong read on ES while SPX is actually still pointing to the downside. We are going to go through all of that a little bit at a time, and we are also going to talk about VIX. The market is looking pretty sexy, honestly. I got a chance to go through some NQ as well — I unfortunately do not have time to do it this very second, but I will try to get it out for everybody. Let’s do ES, SPX, and VIX, and we are going to start with VIX.
☕ FREE — The New & Improved SPX Morning Brief SPX value levels, 150+ indicator prediction assessments, and the day’s top news — in your inbox before the bell. Completely rebuilt and completely free. Seats are limited and they fill up fast. Get your seat → https://go.vicitradingsolutions.com/spx-brief
A Note on This Week’s Market:
News: Right now things are looking fairly okay from a geopolitical standpoint from what I could see over the weekend. The Feds are getting ready to throw more money at this market, so it is just buy, buy, buy — at least for now, until other things are proven otherwise.
Rollover: We are coming back off a fresh rollover, so every level looks different on both SPX and ES. Treat this as a clean slate and work the new structure, not last contract’s memory.
Range: We are in a huge balance area with week after week of overlapping value. Looking at the monthly composite from 8/16 to 9/13, we literally closed Friday dead in the middle of our value area — and even all of last week’s value area sat right in the middle of the month’s value area. We are essentially moving from roughly 7550 to 7800 back and forth without accomplishing anything, just balancing and accepting value.
VIX: Extremely suppressed. We are well below 17.44, well below 16.20, and now below the 15.32 weekly. It has been a phenomenal year to sell volatility — every single spike gets followed by a sell-off. But we are entering the $13, $14, $15 handle, and every time we get down here we get an adverse pop.
Trend — The Discrepancy: ES is up on the daily, weekly, and four-hour — pointed very much to the upside. SPX is down on the daily and the four-hour. That is exactly opposite. I am still looking for longs, but that is based on ES. Be careful, because ultimately SPX is the indices — it is the true lead. We have conflicting information, so be cautious. I am not saying do not buy it. I am simply saying be cautious.
🧠 Current Market Context
The Standoff: ES Says Up, SPX Says Down
I find it very difficult to give an accurate representation of my belief in what the market will do when we have conflicting signals like this — and that is exactly where we are. SPX says we are down on all timeframes and ES says we are up on all timeframes. We are trading ES, we are using SPX as confluence, and we are looking at VIX as the tiebreaker. VIX is extremely suppressed and looks like it could come lower, so for right now I am going to lean on ES. I am going to look at our supports, use the actionable setups to get into these trades with minimal risk, ride the runners, and go from there. But I want every one of you to understand that we have conflicting information, and I think we are going to have to let this first week wash out. It really all came down to Friday’s close, which was a little soft — they barely missed the daily close on SPX. Barely. Monday is going to set the tone for the entire week.
On SPX, let me explain this very clearly. Right now we are down on the daily timeframe and down on the four-hour timeframe, so technically speaking, SPX still looks like a short. On the weekly it looks similar to ES but not perfect — we have a big bullish wedge and they found that massive area of support we have talked about, the big 10-or-11-week balance, which ultimately could send us much, much higher. But the big thing to watch tomorrow is our current daily leg down at 7658.98. We needed to close the daily above this to cement our bullish move, get back up on the daily timeframe, and continue looking for more upside. We obviously played it on Friday — that was the open at the high and we basically dumped off that area. We really need to close above 7658.98 to shift our timeframes higher on SPX. I do think they could ultimately close above it, and if they do on Monday, that cements our move to the upside and 7658.98 becomes a nice momentum pivot to move higher.
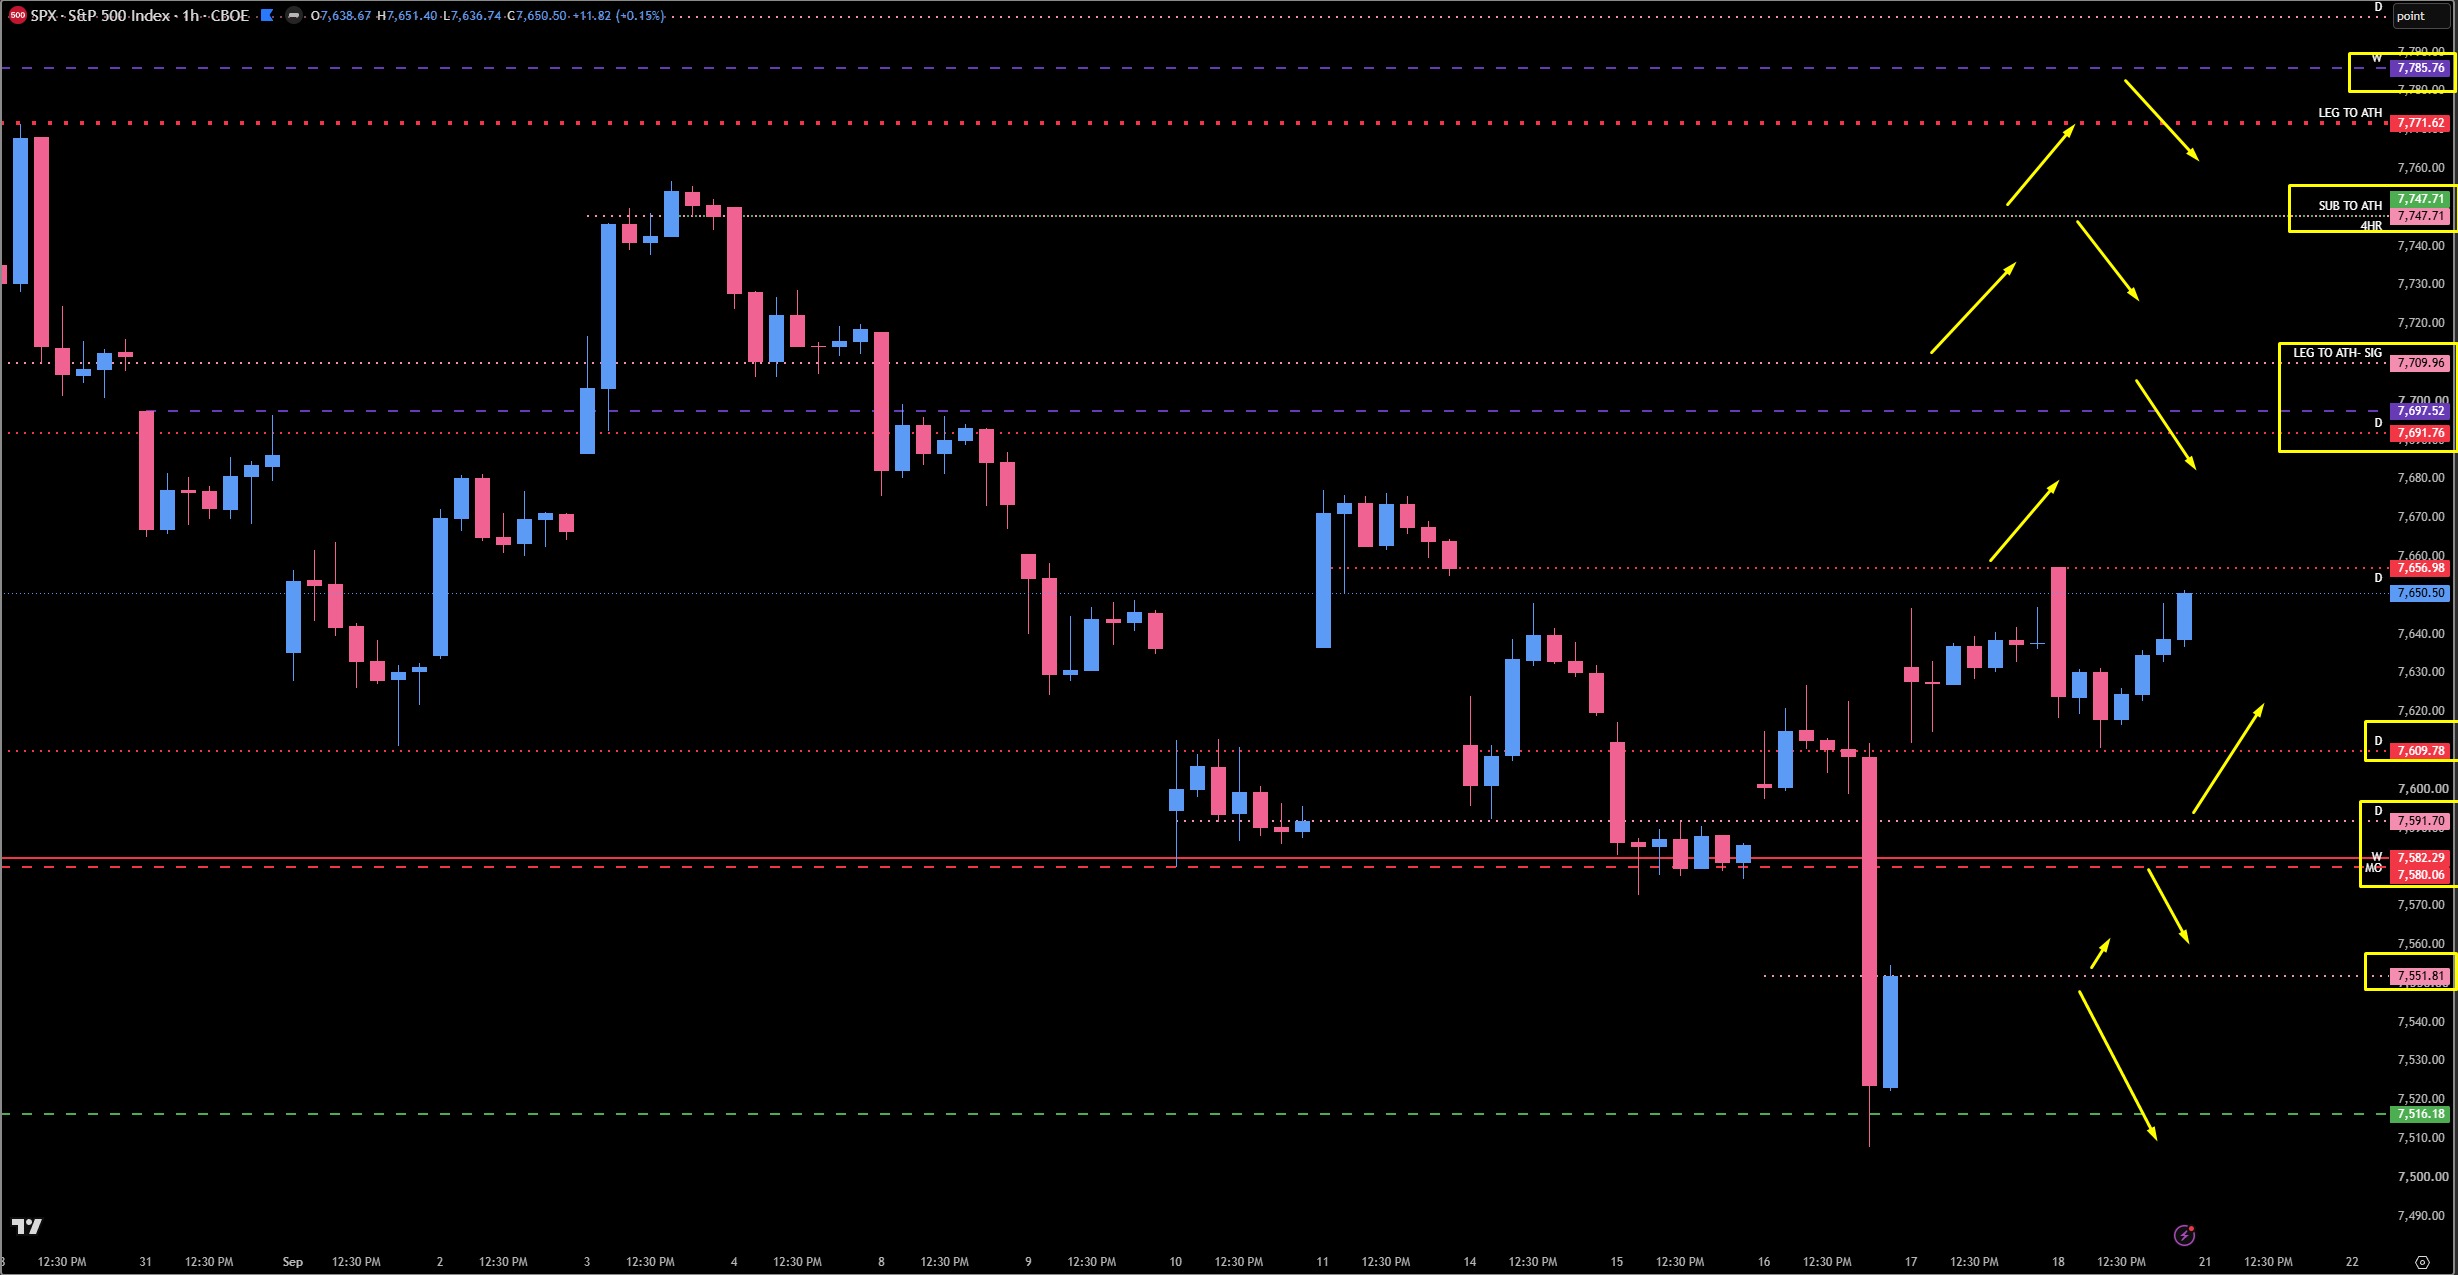
Below that, 7609 has been absolutely enormous time and time again, both above and below. If we move below 7609, the momentum does shift and it concerns me a little bit — I am just going to be frank with you. I would normally not be concerned if we were pointed up on the daily, but we are not on SPX, so based on my process I should still technically be looking for a little more down. Then we have a really nice daily at 7591.70, and this really has to hold if we are going to continue this move up — it is that big, massive weekly/monthly area we have played so many times and it has been so very important in the past. Now that they have remounted it, that really shows how important it is. We really want to see this daily hold and get back above 7609 if we are going to push higher. Below that we have one more daily at 7551.81, but I cannot advise buying this — we have not gained on the daily timeframe yet for SPX. Watch for a reaction, and if you are short it is a great target, but shifting below that big monthly/weekly 7580 area is really, really kind of bad for downside momentum. Above us, our first big major weekly resistance is at 7697.52, which coincides with the daily at 7709.96 — that is going to be a big resistance area. Getting above it helps us retrace this major move to the low and could ultimately bring us all the way up to 7747, and then the weekly at 7785, which you all know I have been after. That 7785 is also the 7800 in ES, and I do ultimately think we get there.
On ES, let me show you the balance so this makes sense. Undo all the merges on the profile and look at that slow drift to the downside — we had massive volume over on the left, two big weeks of overlapping volume with overlapping points of control. Put them together as one big major profile and you can see we basically kneeled right down into that area. That was the huge spot for us to hold. From a charting perspective it honestly looks like a big bullish flag, though I try not to take chart patterns too seriously — that is how you get yourself into trouble. What matters is this: the white part is our value area, where we spend 70% of our time for the week, and you can see those white parts continuing to overlap on top of each other. That is pure balance. One is literally almost to the line and then again last week. We have slow-grinded sideways with a slightly tilted downside lean, but we really have not gone anywhere. And here is the important part — this is a huge indication of another potential push higher. If the bulls grab hold of this opportunity and want to keep pushing, we could make another new all-time high in all actuality. So this is kind of a big deal.
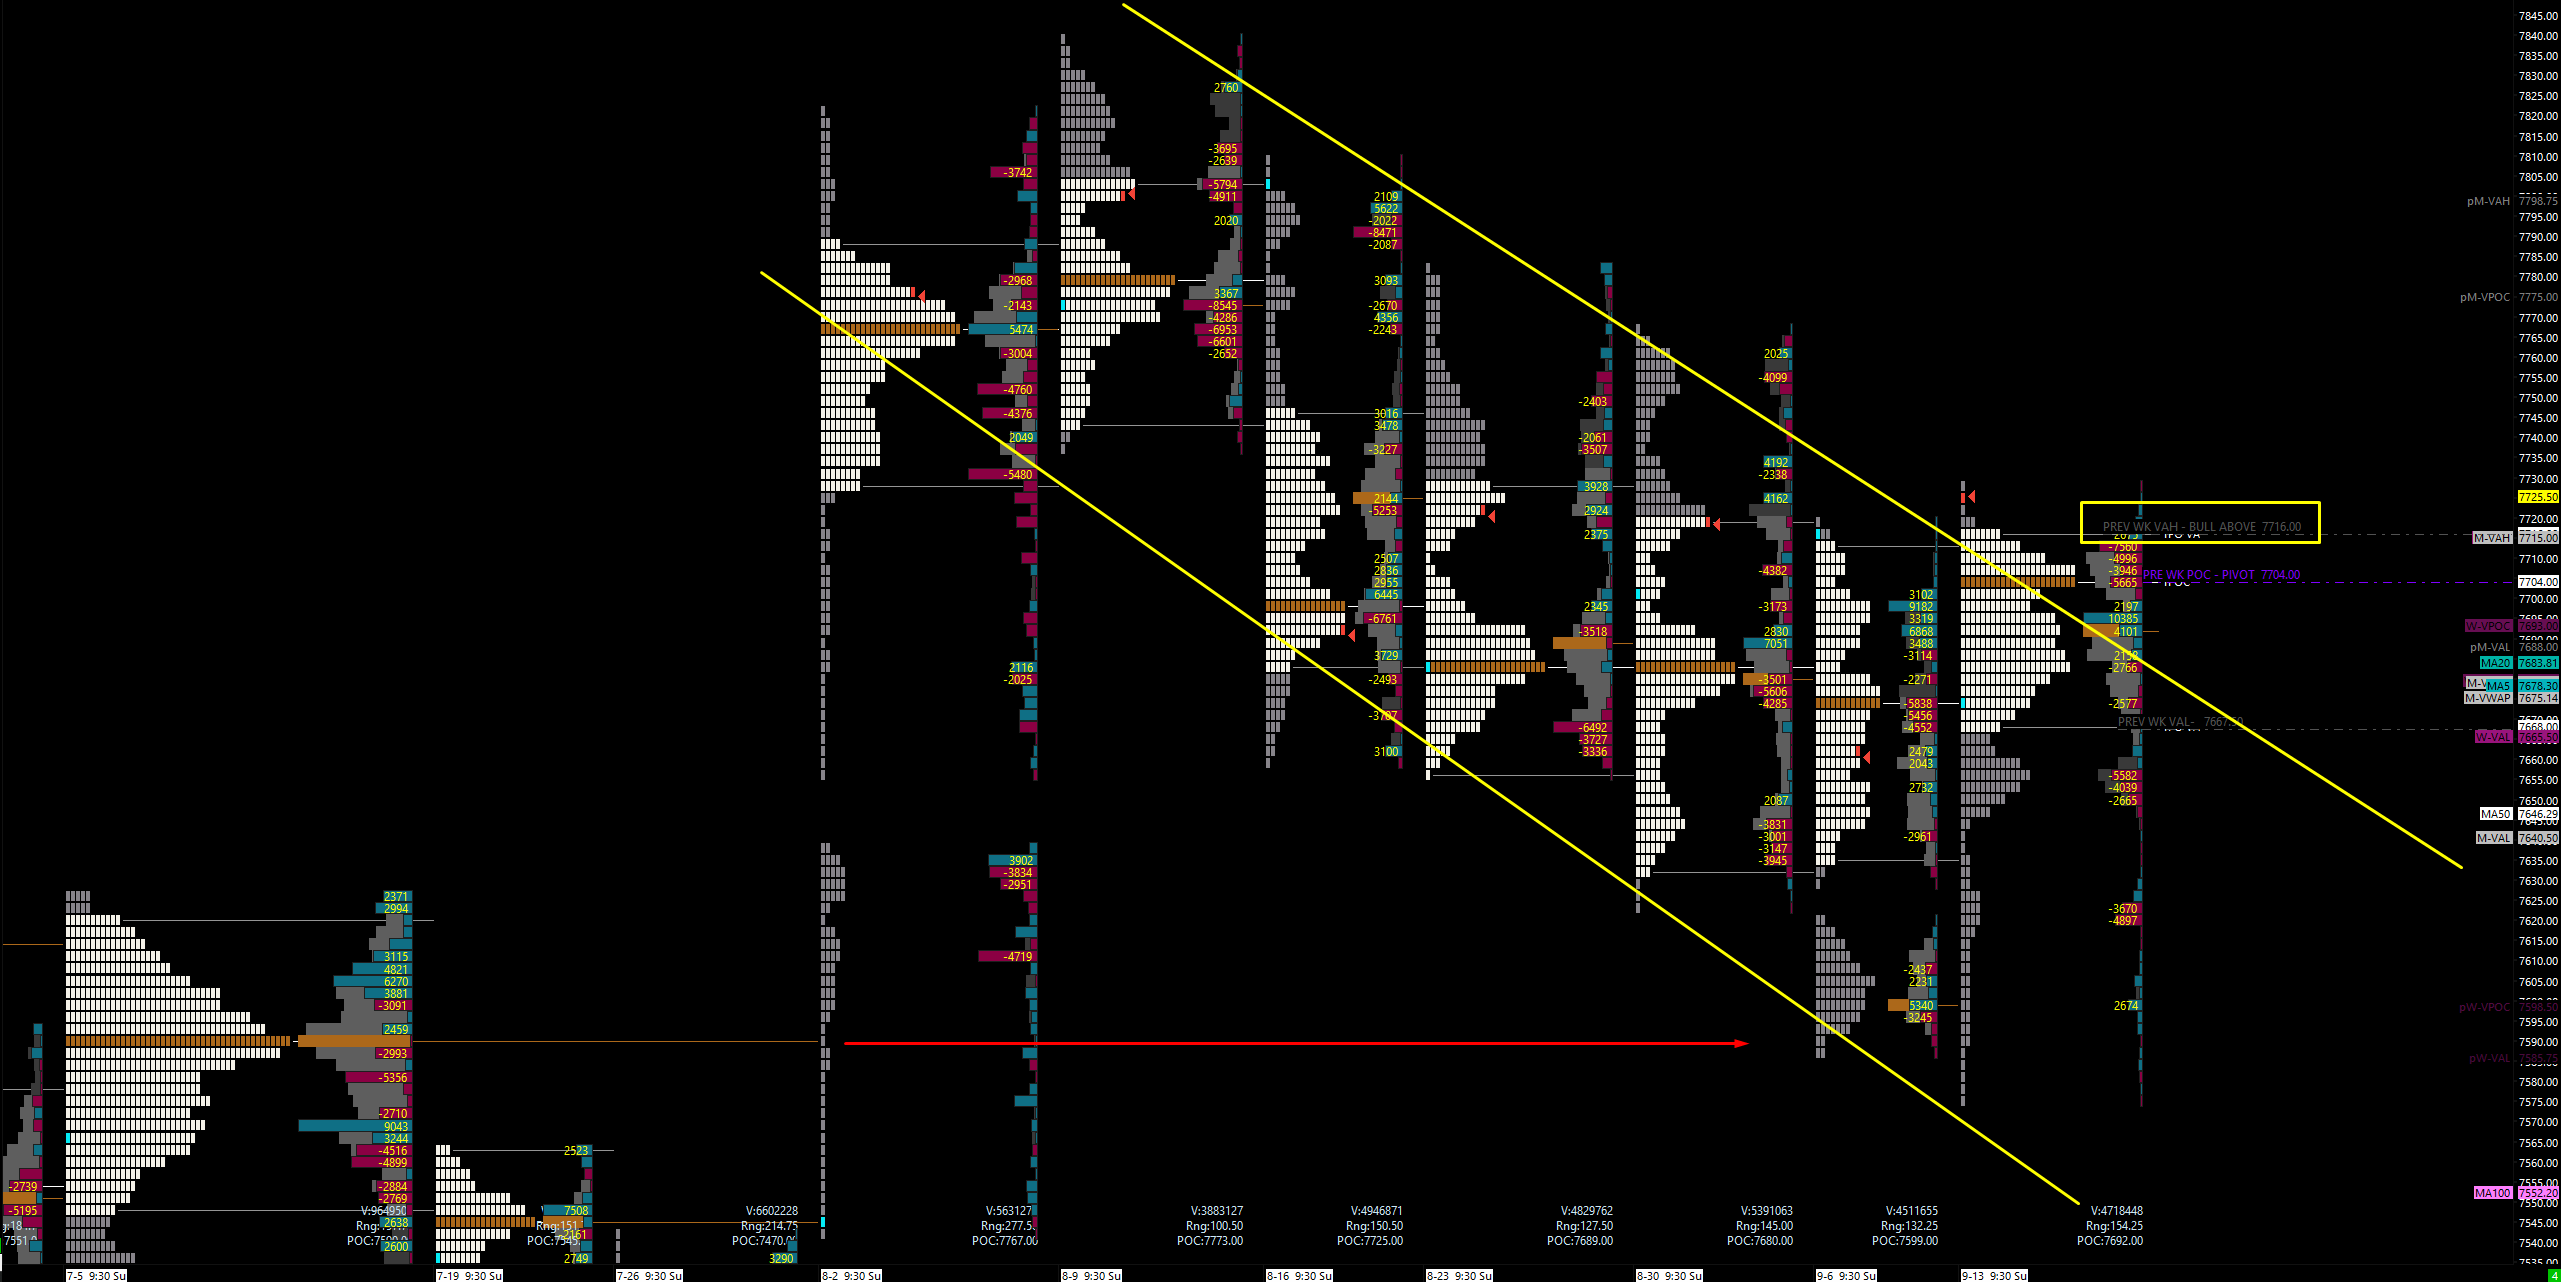
Now for the lesson, especially for course holders. On SPX, 7658.98 was the leg down I was looking to close above and we failed to do it. But on ES, that same structure is our leg to the low, and we had two days of a solid close above the 7692.50 area. That is why we are up on the daily timeframe on ES, and that is what we are trading. ES already held its area and the weekly has closed above for the past three weeks — it looks hella bullish in comparison. SPX is just now starting to come up after it dipped way down. I am not knocking SPX, but the difference is striking. If this wedge breaks out, this literally could be another push to the upside.
🚨 VIX Analysis: The 16.20 Risk-On Line
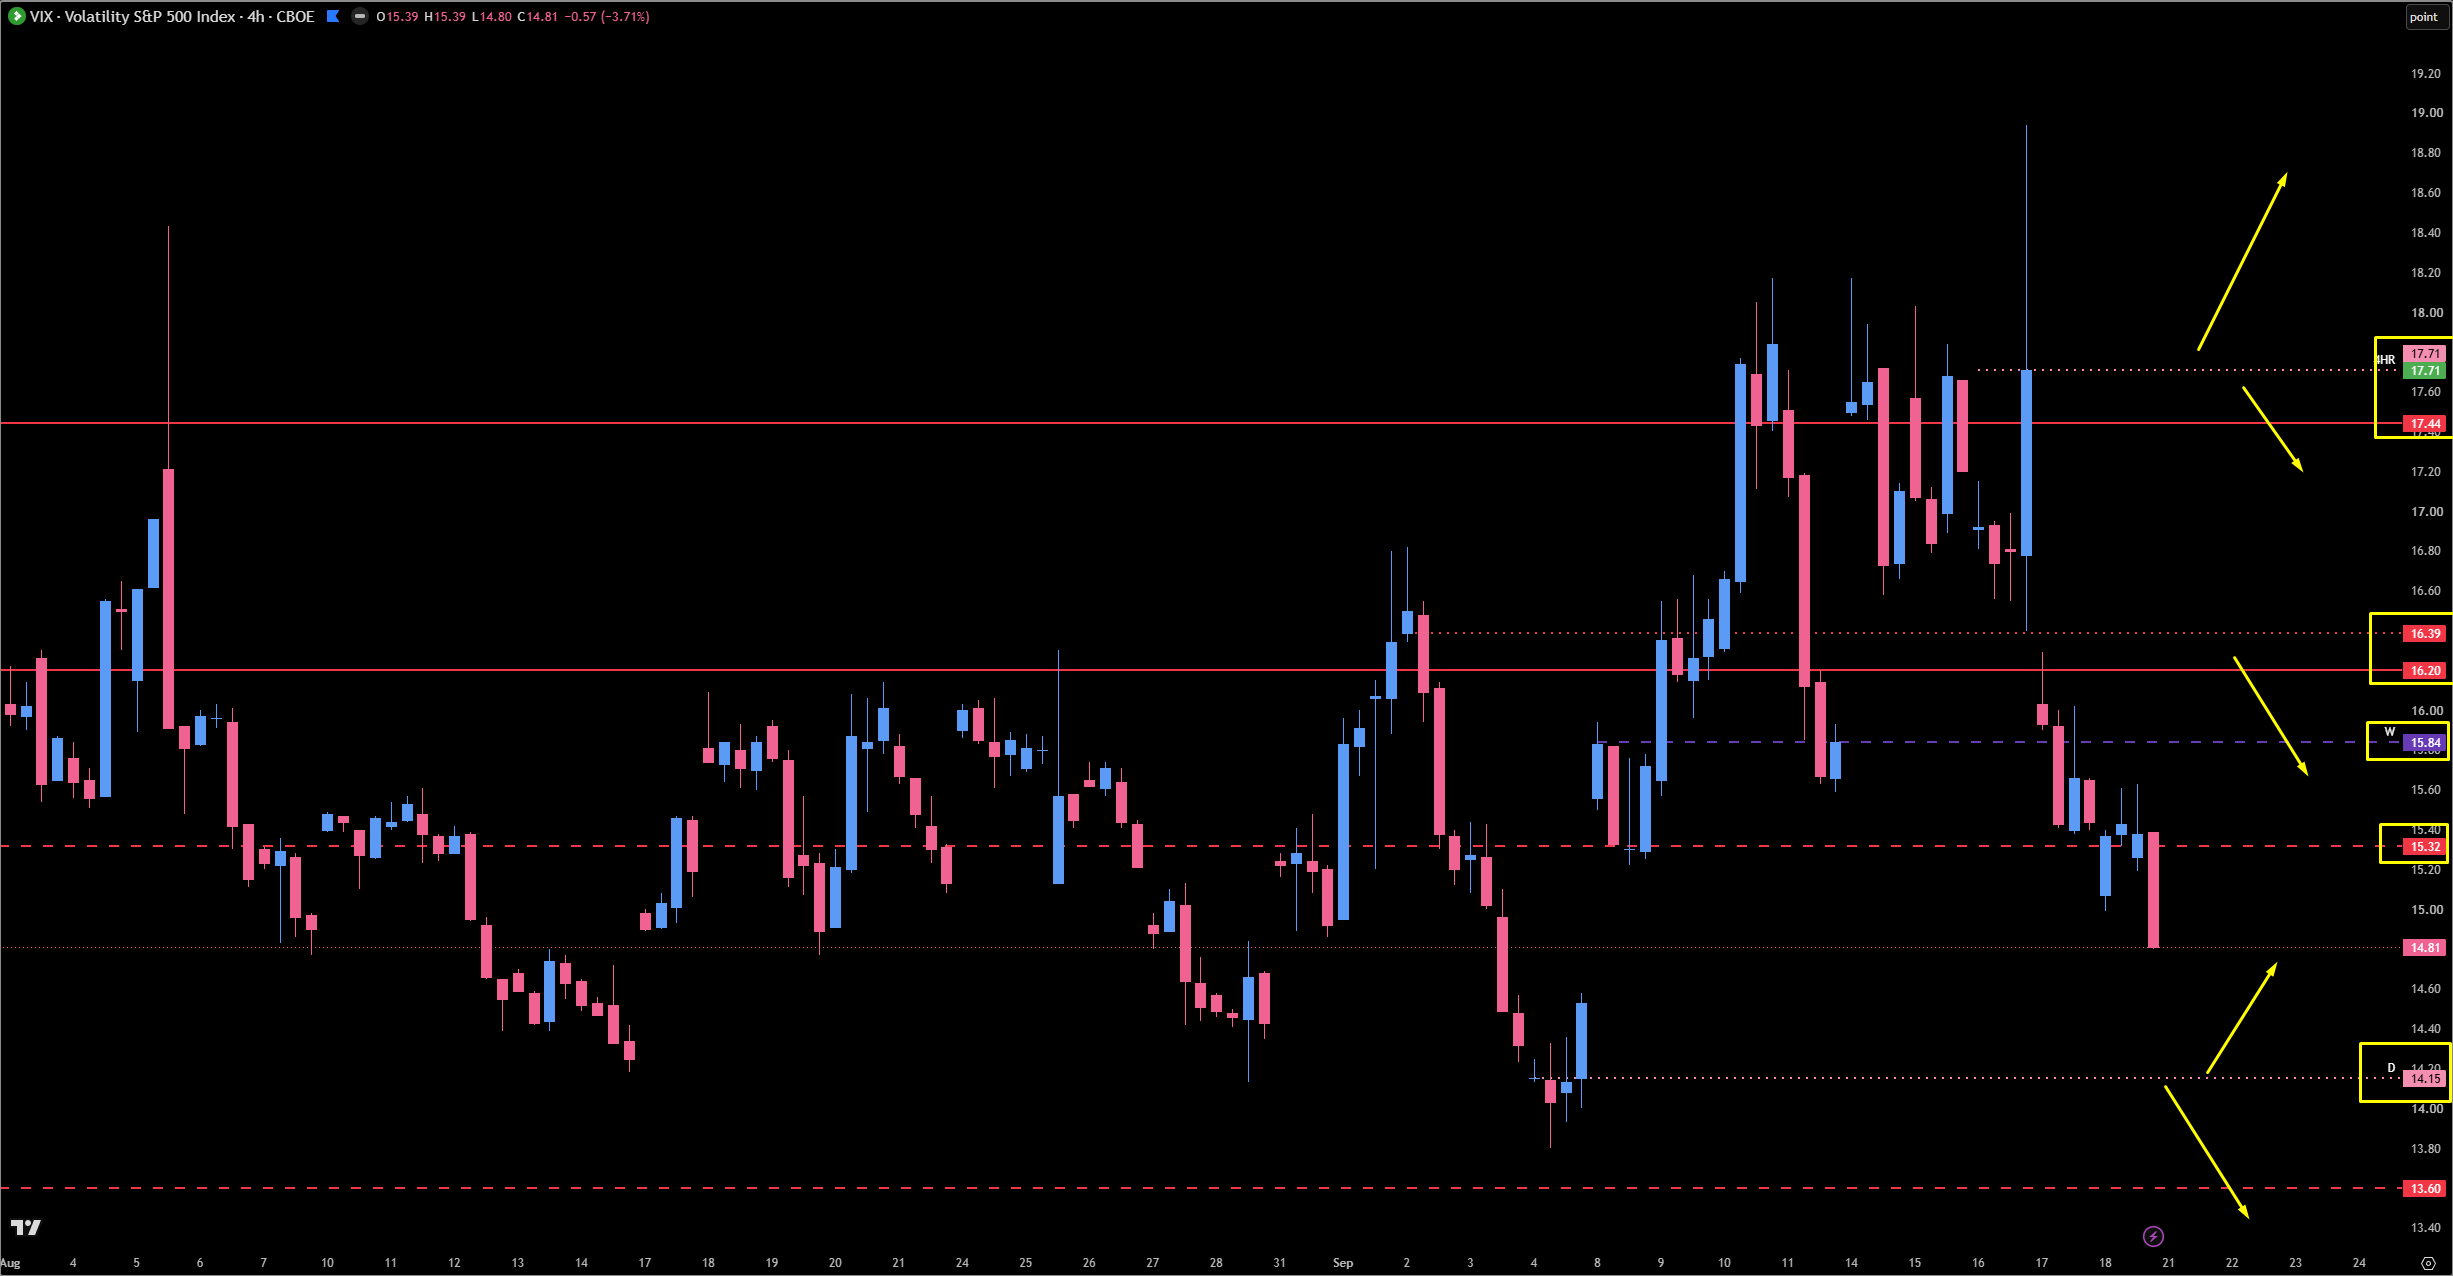
As usual, VIX is coming down. This really has been a phenomenal year to sell volatility — every single spike we get is followed by a sell-off, which is pretty incredible. They continue to use the two major pivots we have been monitoring for some time, and I want you to mark both of these on your VIX chart.
The Big Pivot — Risk Off Above: 17.44. We are inherently bearish on the indices above 17.44 and really kind of bullish below it. This remains our big pivot. Above 17.44, we have risk off.
The Risk-On Line: 16.20 (Monthly). This is where things really shift. As long as we stay below 16.20, we continue to cruise up in the indices, and the pressure keeps getting alleviated as we drift higher. Below 16.20, our risk is on and we are able to get long on the indices from a high-timeframe perspective. Keep 16.20 in mind for above or below this week.
The Low-End Reaction Spot: 14.18. This is our move to the high, it is very much a gap fill, and it is also the daily leg up. I am anticipating a reaction here, so please keep it in mind as we approach. Remember — every time we get down into this $13, $14, $15 handle, we get an adverse pop, and it always brings ES or SPX down with it. This should not be a surprise to anyone coming into the new week. More than likely they will have popped VIX up.
The First Resistance: 15.88. If we play the 14.18 spot down low, this is the first area to keep track of. I would anticipate a reaction here, and we could even get it as soon as the open on Monday — they could absolutely do one of those numbers. Watch for a potential reaction as VIX spikes, and then this becomes big resistance for VIX, which is obviously a boost for the indices.
The Reversal Watch: 17.71 (Big Four-Hour / Daily Leg Down). This is our move to the low, and more than likely this area gets a pretty fierce reaction. What we will do is wait and see if it plays and gets back below 17.44 to guide us on when we should be looking for a long, or a reversal at that point in time. If VIX pushes up here, we will more than likely be coming down in the indices — so this would be a great place to look for that potential reversal area.
🎯 Detailed Actionable Trade Plan (ES Futures)
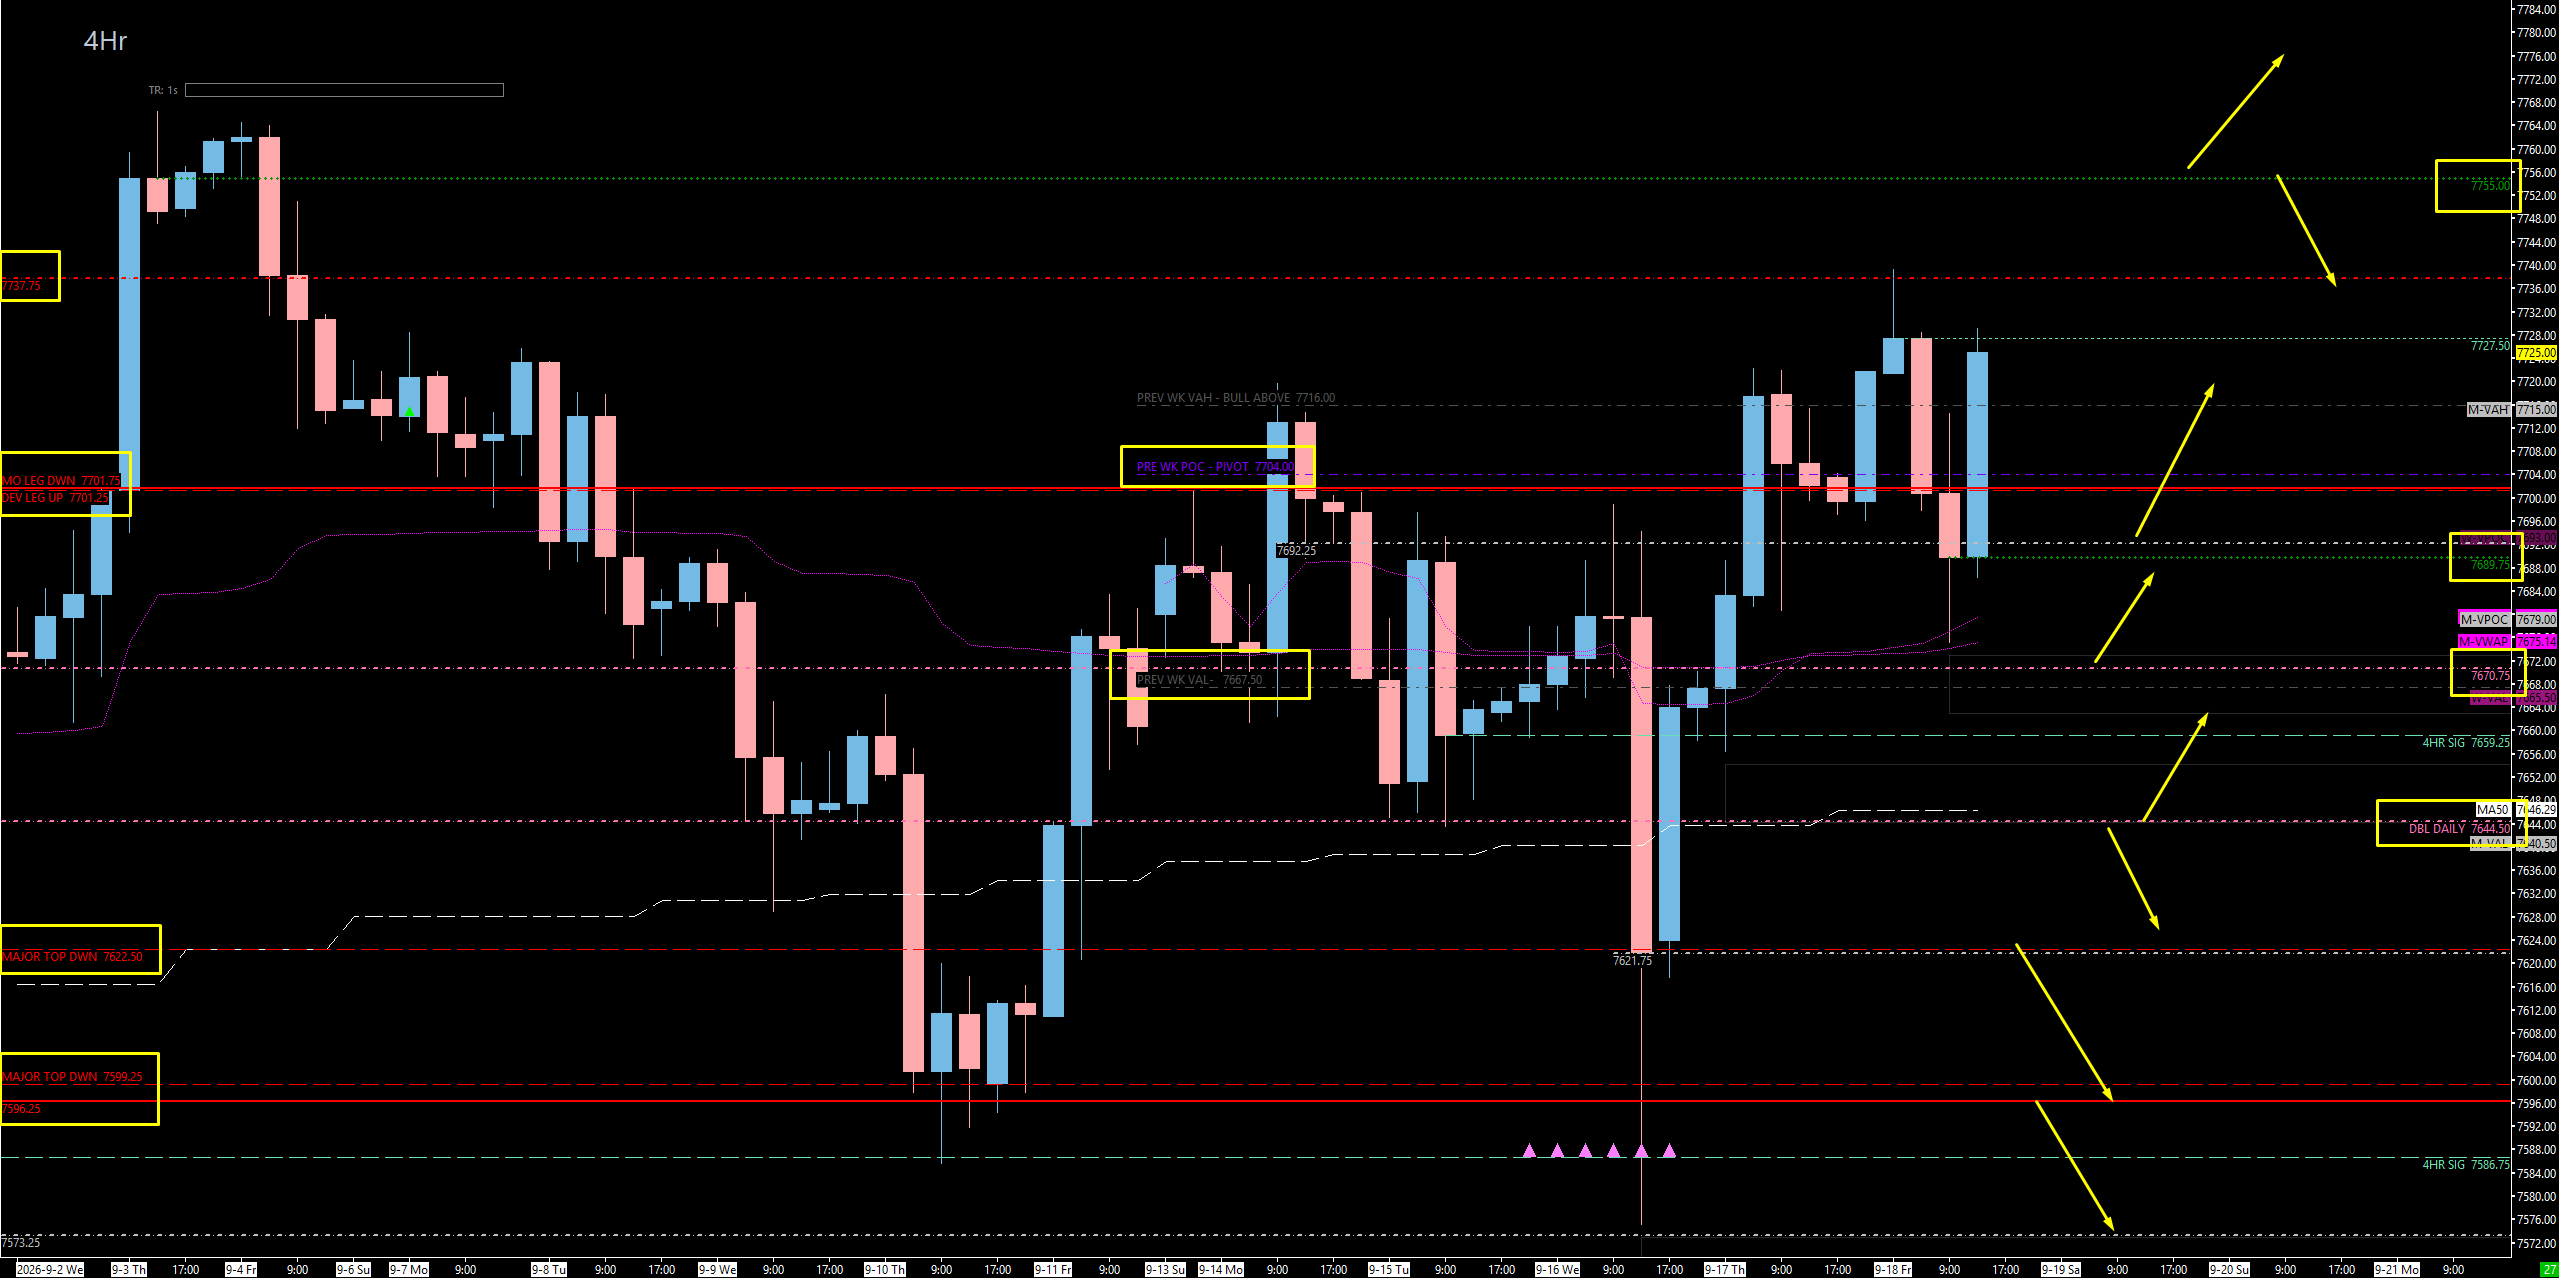
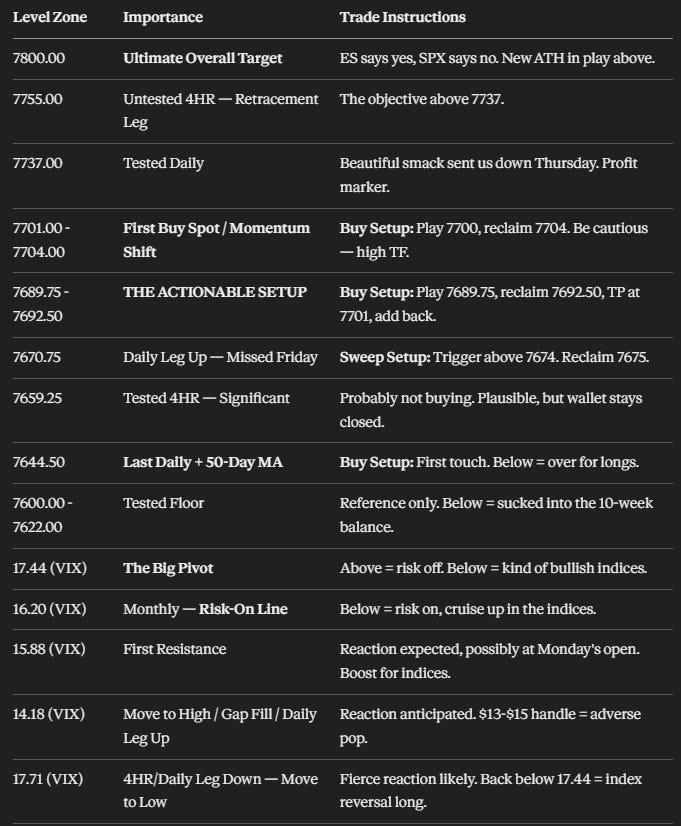
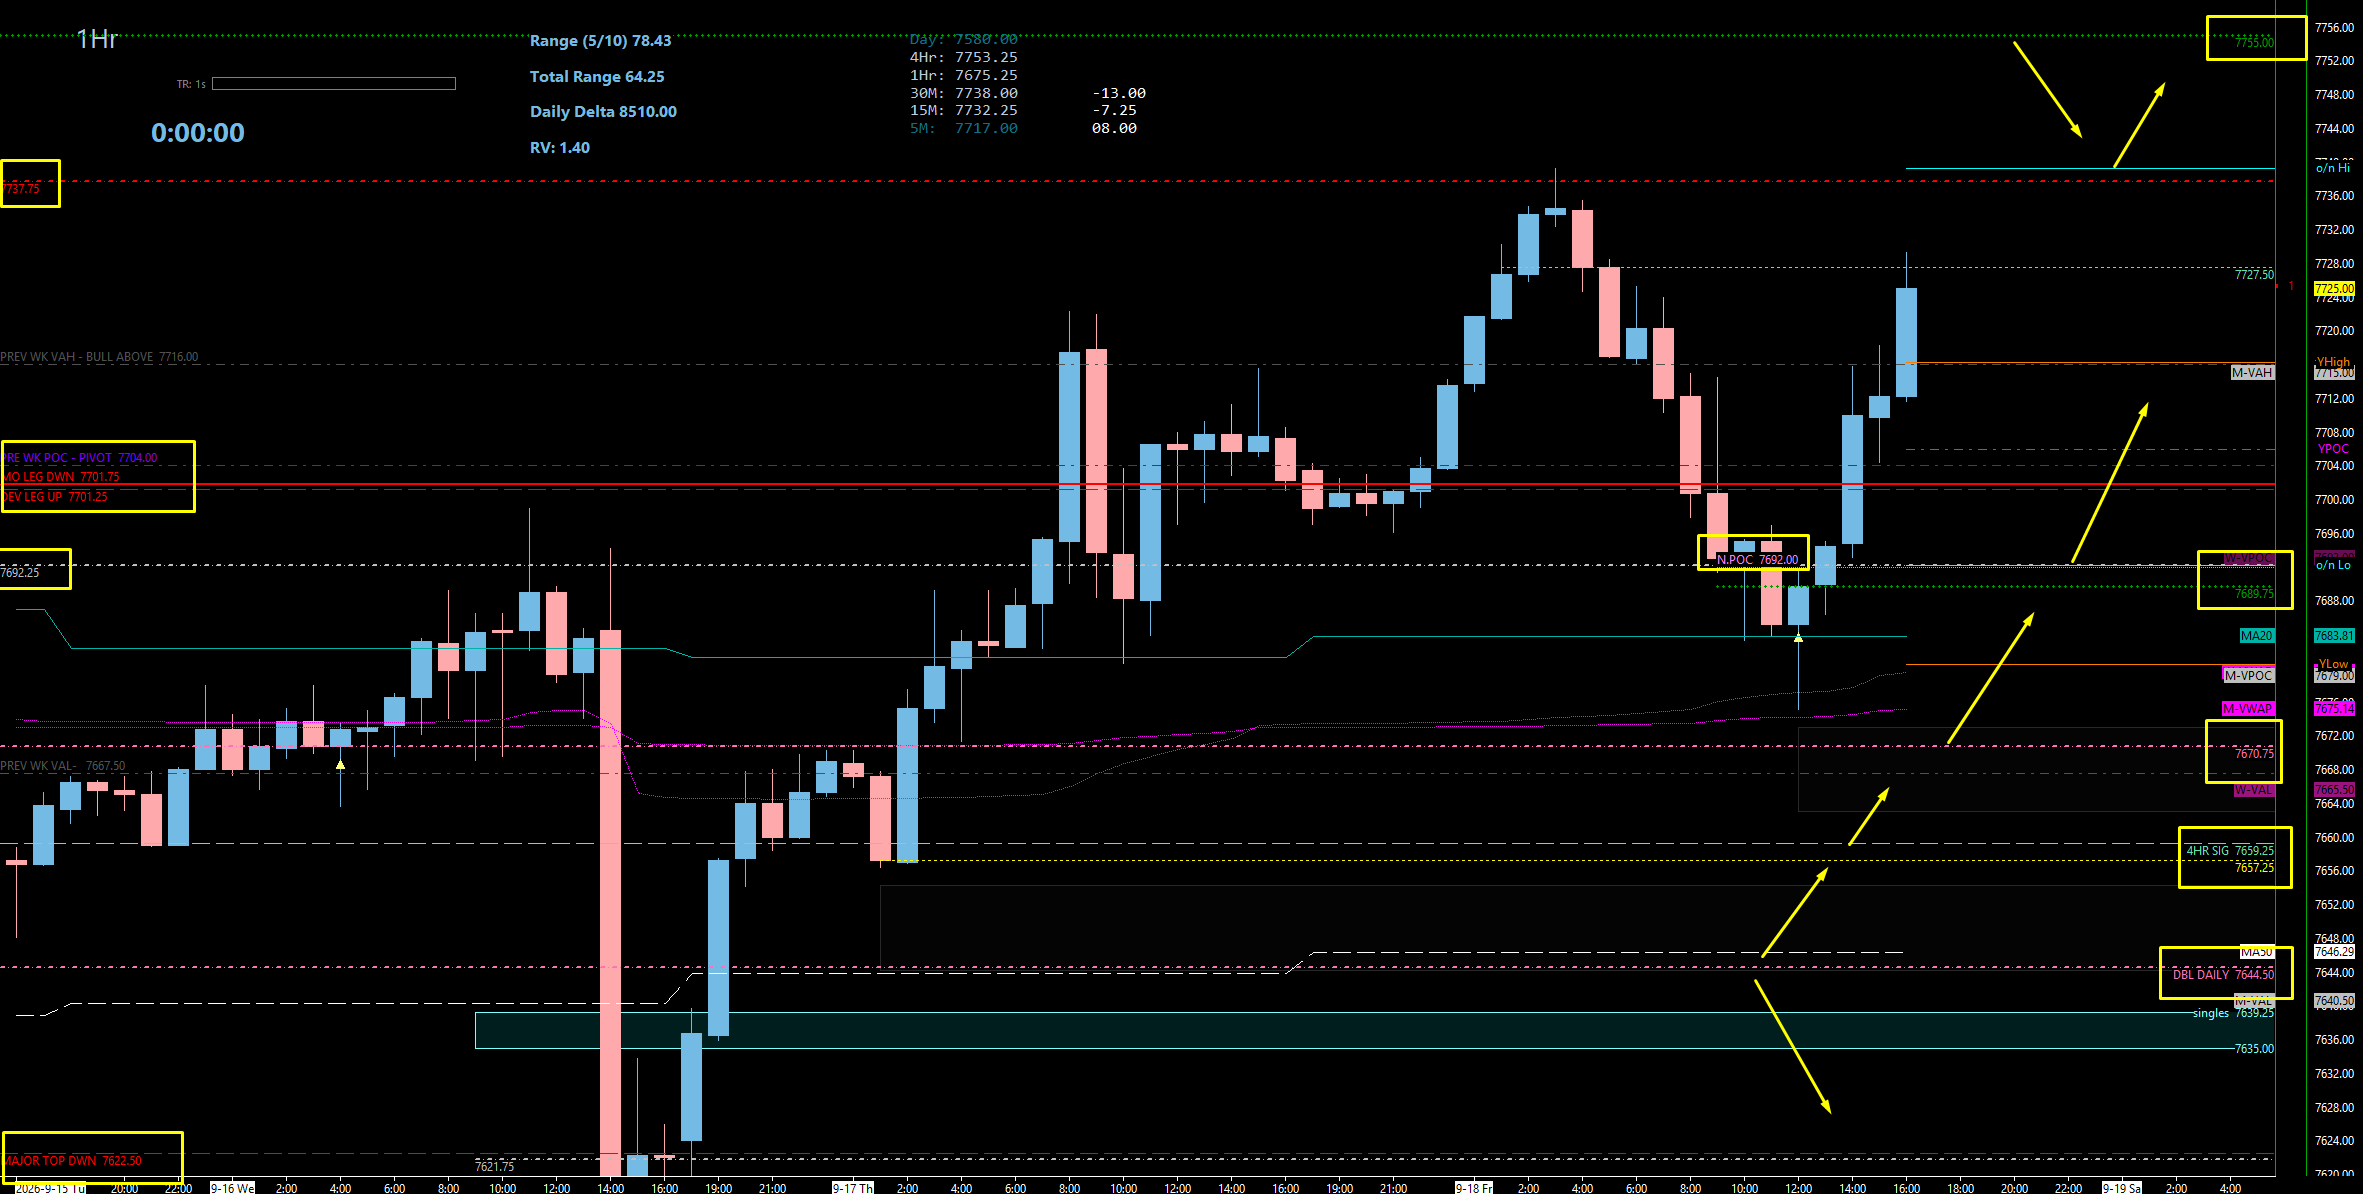
ES is up on all timeframes, so we are looking for longs off support with actionable setups to keep our risk minimal. 7800 is our ultimate overall target and has been for some time. The buy ladder is clean and short: 7701 is the first buy spot, then 7689.75 with the 7692.50 trigger, then the 7670.75 daily, and finally 7644.50. After 7644.50, it is over with for the longs — I do not have anything left untested. Above us, the 7737 daily is a big important spot on the way to the 7755 four-hour, which is our big leg down for the retracement. And the one line that governs everything: we really want to stay above 7701, because that is really where the momentum shifts.
🔴 Key Resistance Zones & Setups
The Important Daily: 7737.00
7737.00 (Tested Daily).
Context: This was a beautiful smack of the 7737 daily that actually sent us down on Thursday and in Globex Friday morning. This daily is going to be a big important spot for us.
Actionable Setup: Expect a reaction here on the way up. This is a profit-taking marker for anyone riding the long ladder from below, and a level that has already proven it can turn price.
The Retracement Leg Down: 7755.00
7755.00 (Untested Four-Hour).
Context: Ultimately we are trying to get to 7755, which is our big leg down for the retracement. This is one of only two four-hour levels I have up here, and it is untested.
Actionable Setup: This is the objective above 7737. Getting into this area is what retraces the major move down and opens the path toward the ultimate target above.
The Ultimate Target: 7800.00
7800.00 (Overall Target).
Context: Number one: 7800. This has been our ultimate overall target for some time. Can we get there? I think so. Right now ES says yes and SPX says no, so I am in a screwy spot — but the target stands, and it lines up with the 7785 weekly on SPX.
Actionable Setup: If the bulls grab hold of this balance and push, this is where we are headed — and from there, a new all-time high is genuinely in play.
🔵 Key Support Zones & Setups
The First Buy Spot — Monthly/Weekly & P.W. POC: 7701.00 - 7704.00
7704.00 (Previous Weekly Point of Control), 7701.00 (Monthly + Weekly — Very Much Untested).
Context: We talked about 7701 last week being a big major pivot, and that is exactly what it was. On the four-hour it is obvious: every time we have been below it, price comes down — and as soon as they get above it, they punch up. We have a monthly and a weekly aligning here perfectly, with the previous weekly point of control at 7704 right on top. Can they come down and play 7701? Absolutely they can, and this is potentially a really good buy spot.
Actionable Setup: Buy Setup: If they come down and play 7700, we look to get back above the previous weekly point of control at 7704 and ultimately back above yesterday’s point of control — and then we could potentially squeeze much higher.
Warning: The only problem for me is that it is so high-timeframe and we have other levels below us that could potentially get bought, so we really need to be careful buying here and use the actionable setups rather than blindly taking it. Just be cautious — this would literally be the first buy spot. And we really want to stay above 7701 if we are going to continue our progression higher, because this is really where the momentum shifts.
THE ACTIONABLE SETUP — 4-Hour With The 7692.50 Trigger: 7689.75 - 7692.50
7692.50 (Daily + Naked Point of Control — The Trigger), 7689.75 (Four-Hour — Only Untested 4-Hour Support).
Context: I like this four-hour a lot. We are up on the four-hour and they did not technically lose it on this close, so it still looks pretty decent to me. Plus we have a beautiful actionable setup here. The 7689.75 is the only untested four-hour support I have until we make new lows, and sitting right above it is the daily at 7692.50 with a naked point of control that we use as our trigger. The daily 92 has been true for us — it has been good. And here is why it matters: every single time we are above or below 92, we get a squeeze. We are going to use that information to our advantage.
Actionable Setup: Buy Setup: If we come underneath 7701, we play the 7689.75, get back above 7692.50, take profits at 7701, wait for us to reclaim that, and then we go. Take big profits into the 7701 area and then add once again back above if this level is going to work — because if this plays and we get back above there, we squeeze.
The Missed Daily — Sweep Candidate: 7670.75
7670.75 (Daily Leg Up — Very Much Untested Still).
Context: This is our daily leg up and one that has been worked from both the bottom and the top side. They just missed it on Friday — instead they pulled into the monthly and weekly VWAPs and missed this daily entirely, then got a little boost there. This daily is very much untested still, and I do think it can still play on a sweep. It is also located extremely close to the previous weekly value area low, so holding this area would keep us inside the weekly balance and potentially rotate us back higher.
Actionable Setup: Sweep Setup: Let us say they come down and do one of those sweeps — we play this, and I want to get above roughly 7674 to trigger my long. Then we take profits at the levels above and ride the runners. On a sweep of the low, call it 7675 for the reclaim, and then we could potentially squeeze back up, taking big profits along the way.
The In-Between Four-Hour: 7659.25
7659.25 (Tested Four-Hour — Significant).
Context: In between the levels above and the last daily below, we do have this four-hour at 7659.25. Full transparency: I cannot decide if this is tested or not, honestly. So I marked it as significant and I am going to call it tested — because if I am not sure, then I am not getting my wallet out. I know for sure the one hour is untested; I am not so confident on the four-hour.
Actionable Setup: I will probably not buy this. I will wait for the reclaim of the daily, or I will wait for the play down below. But I certainly want you to know it is here, and it is a plausible play.
The Last Daily — Best Shoulder On The Board: 7644.50
7644.50 (Daily + 50-Day Moving Average).
Context: This is the last daily — I have only got two. And I actually like this daily quite a bit. It has a very nice shoulder, it is very attractive, and there are a lot of reasons to like this level. The 50-day moving average is right there with it. I like this area a lot and I will probably take it on first touch.
Actionable Setup: Buy Setup: This is my favorite of the deeper buys — a clean shoulder with moving-average confluence and a very nice spot to look for a potential long.
Warning: Underneath 7644.50, it all goes bad. I do not have anything left untested. After that, it is over with for the longs.
The Tested Floor: 7600.00 - 7622.00
7622.00 (Tested Weekly), 7600.00 (Tested Area — Bought Before Rollover & Flushed Wednesday).
Context: Everything down here is tested. The weekly at 7622 is tested. And the 7600 area, as you all know, was tested before rollover — we all bought this — and then they just did it again on Wednesday when they came down and flushed it with FOMC and went higher.
Actionable Setup: These are reference levels only, not fresh buys. If they push below the 7600 area, we get sucked into that massive 10-week balance and we may not come out of it for some time.
📌 Cheat Sheet – Key Levels Recap
🧠 Final Thoughts
That is what I have got for you — laid it all out. Here is the honest bottom line: we have conflicting information. ES is up on all timeframes. SPX is down. I am still looking for longs at this point in time, but that is because of ES. Be careful, because ultimately SPX is the indices — it is the true lead, and they barely missed that daily close on Friday. Barely. So I am very interested to see what happens on Monday, because it will really set the tone for the week and tell us what we can expect in terms of moving higher or potentially lower.
The plan itself is clean. We are keeping an eye on those first major levels: 7701 and ultimately 7689.75, the daily at 7670.75, and then 7644.50. After that, it is over with for the longs. Use the actionable setups to get in with minimal risk — play 7689.75, reclaim 7692.50, take profits into 7701, wait for the reclaim and add back, because every time we are above or below 7692.50 we get a squeeze. On the sweep play at 7670.75, trigger above 7674. And 7644.50 with that beautiful shoulder and the 50-day moving average is the one I will probably take on first touch. We really want to stay above 7701, because that is where the momentum shifts — and below 7644.50 it all goes bad, with nothing left untested and the risk of getting sucked back into that massive 10-week balance.
VIX is the tiebreaker and it is extremely suppressed. Below 16.20 our risk is on and we can get long the indices from a high-timeframe perspective; above 17.44 we are risk off. Watch the 15.88 for a reaction that could come as early as Monday’s open, keep the 14.18 gap fill and daily leg up in mind for the adverse pop we always get in this handle, and if VIX ever runs up into that 17.71 four-hour/daily leg down, that is our reversal spot to look for the long on the indices. I would love to see SPX grind a little higher and close the daily above 7658.98 — then we continue our progression up to 7800. If not, it all goes bad and we start to come down, because we have very limited support.
I am so excited to get back this week. I do not think I have ever been so excited to do a post-market breakdown — I cannot wait to get into the room and make some money. It is going to be a phenomenal week, so hang out with me and come chill. If you are a Trade Plan subscriber, hit me up and come check out the room — I will throw you a bone, you can play with us for a week or two, see what you think, and watch how we conquer the markets. Now enjoy the rest of your Sunday; it is a beautiful day outside and I am off to do family pictures with my parents and my kids. I will see you first thing in the morning.
Until next time—trade smart, stay prepared, and together we will conquer these markets!
Ryan Bailey, VICI Trading Solutions.
📊 Indicator String
Copy and paste the levels below into your S&P Edge Levels indicator to automatically plot today’s key levels on your chart:
7755.00|4HR|4H
7737.00|Tested D|TD
7701.00|MO|M
7692.50|D|D
7689.75|4HR|4H
7670.75|D|D
7659.25|Tested 4HR|T4
7644.50|D|D
7622.00|Tested WK|TW


