

Howdy partners, and welcome back. It is time for the Weekend Review, and we come off another amazing week in the trade plan — it seems like it gets better and better and never fails to deliver. On Monday we had the 7753 pivot, our big monster to get above. As many of you know, we gapped up above it on Monday and shot straight to the all-time highs with a swift 130-point squeeze. Unbelievable. Then we balanced for two days, and on Wednesday VIX came directly down into our pocket — the 14.15 daily. It played with precision and squeezed hard, giving us the indication that an obvious move down was coming, which let us capitalize and avoid getting stuck on the wrong side of the trade like so many other people did that day. Then we came down to our sweet spot on Thursday morning and played the longs there — and once again we had the low of the day on Friday. An unbelievable week for the trade plan as we head into the end of September.
So let’s bring it all back and show you what’s up with VIX, SPX, and of course our fan favorite, ES. You ready? Let’s get into it.
📧 Check Your Spam Folder Follow-ups and SPX Brief emails are landing in spam. Look for rbailey@vicitradingsolutions.com and info@vicitradingsolutions.com, mark them “Not Spam,” and add them to your contacts so you keep getting them.
☕ FREE — The New & Improved SPX Morning Brief SPX value levels, 150+ indicator prediction assessments, and the day’s top news — in your inbox before the bell. Completely rebuilt and completely free. Seats are limited and they fill up fast. Get your seat now → https://go.vicitradingsolutions.com/spx-brief
A Note on This Week’s Market:
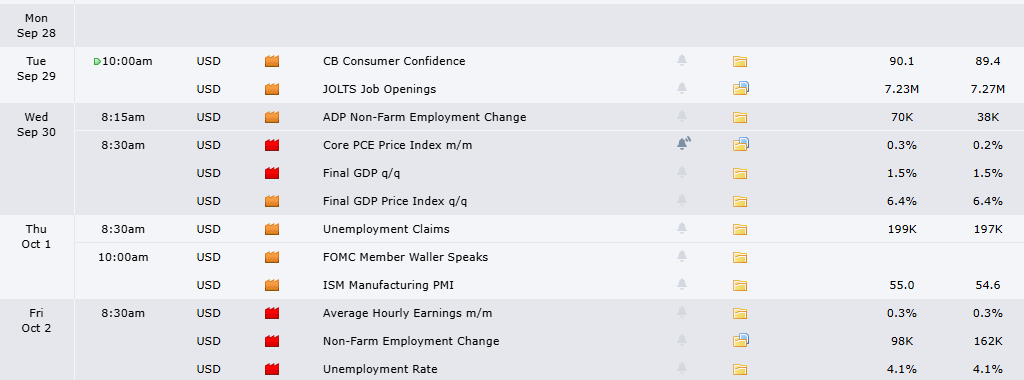
News:
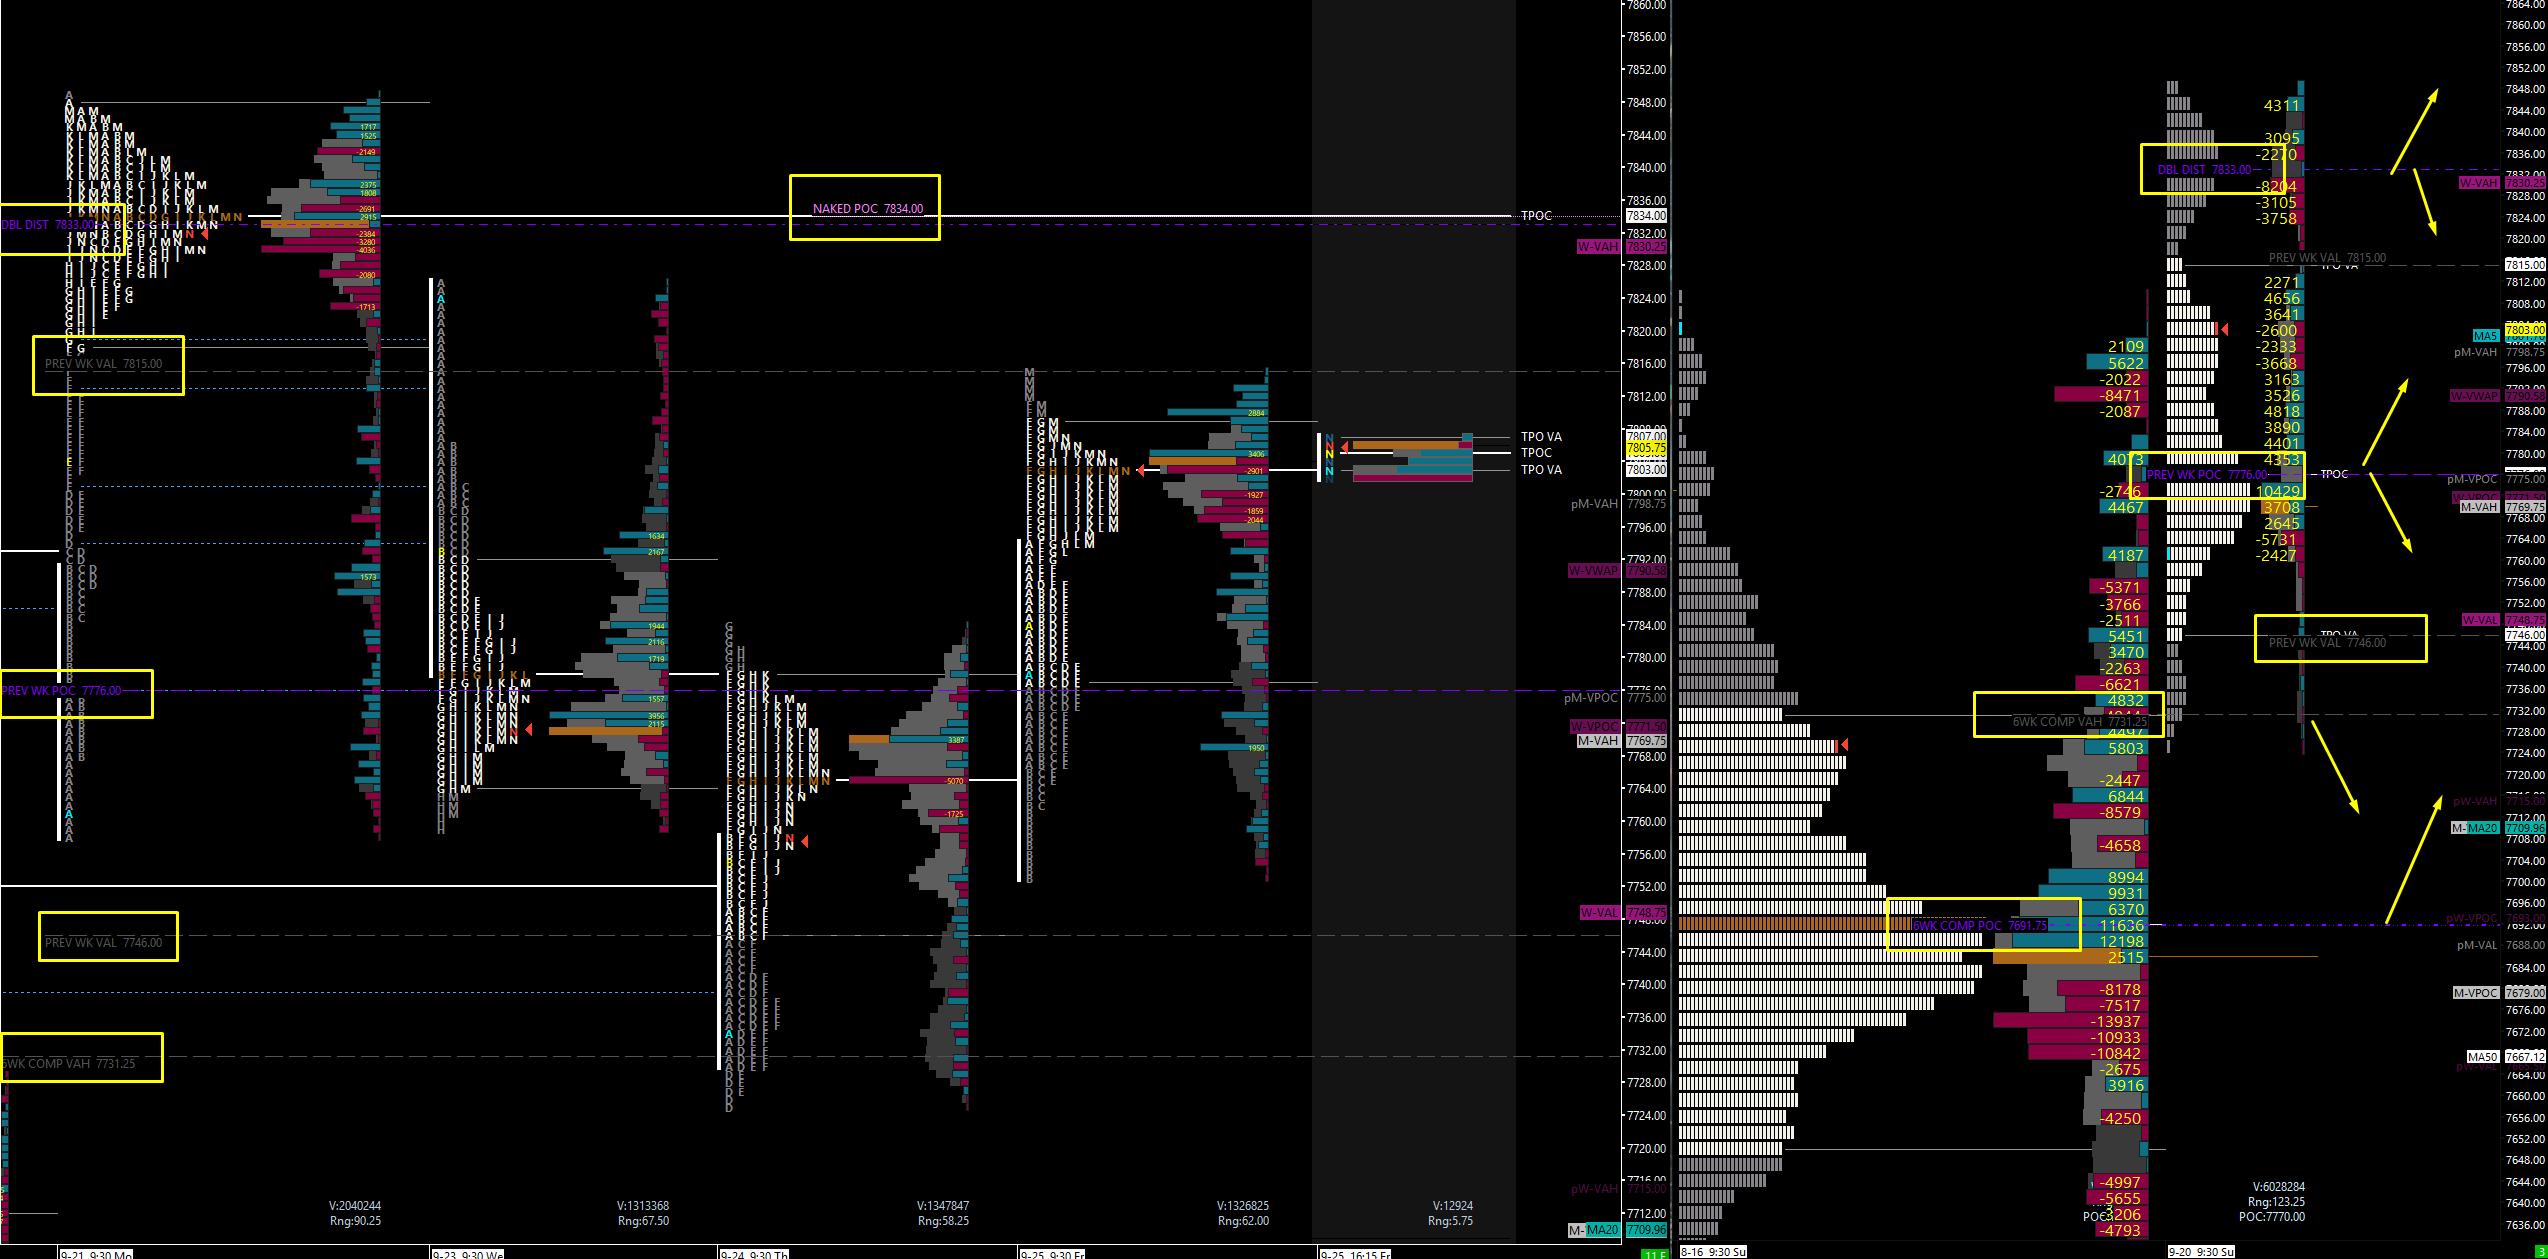
Volume: On the ES profile there is a massive volume node sticking through, with over 14,000 buyers between roughly 7768 and 7775. That is an absolutely massive spot with some inefficiencies and a large amount of volume that really needs to balance — and it sits right on top of last week’s point of control.
Range: We balanced for six or seven weeks with every value area overlapping, so I combined them into one six-week composite profile for above/below context. Our edge is in the edges — outside or right at the edge of value. The composite value area high at 7731.75 is one edge, and it is exactly where they held. Below it, we easily come down to the composite point of control at 7691.
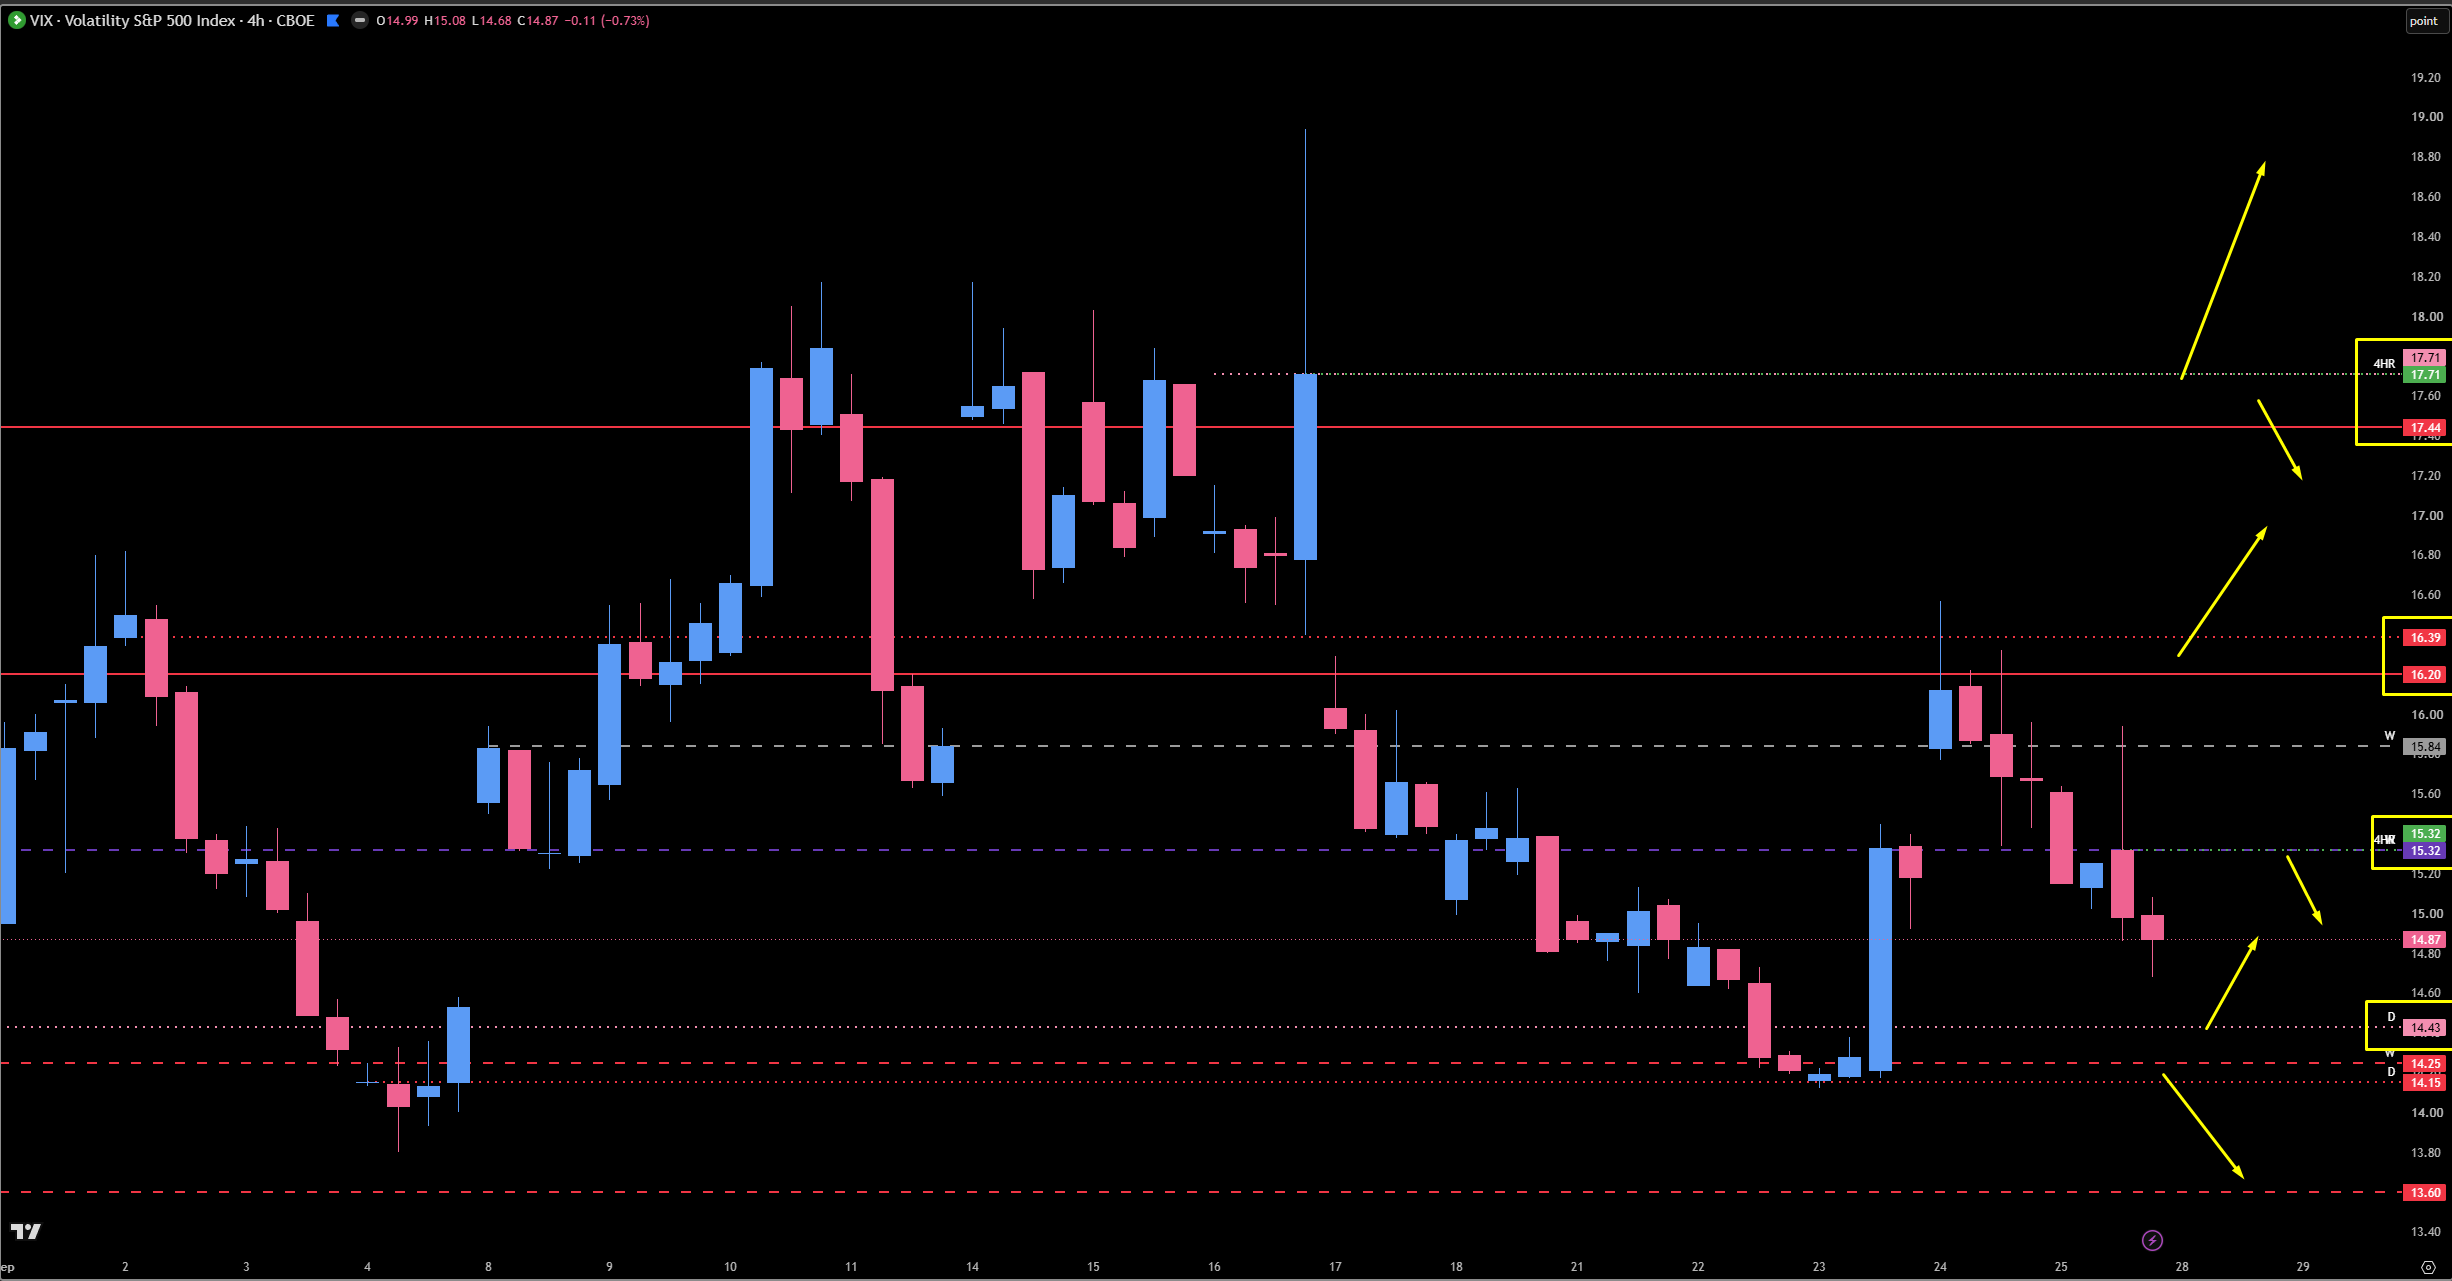
VIX: VIX is drifting back and forth in its own balance area and we really have one spot holding it all up: the 14.43 daily. If it fails, that is the green light for the indices to push higher.
Trend: Up on all timeframes on ES — and the weekly just gained. SPX is up on all timeframes except the weekly. We have every reason to believe we continue higher, so we are still looking to the upside — and we know exactly where things go south.
🧠 Current Market Context
A Very Defined Plan: Two Reaction Zones, One Pivot, And Clean Buys Below
I told you at the top that we have a very defined trade plan, and it truly is. The weekly just gained on ES and we are up on all timeframes, so the default is up. But we have a stack of confluence overhead that deserves respect, a single four-hour holding the near-term structure together, and beautiful, well-defined buy zones below if the market pulls back. Everything lines up across SPX, ES, and VIX — and the weekly TPO and our structure are generating the exact same pivots.
The ES six-week composite is the backbone. We want to stay above the six-week composite value area high at 7731.75 to stay ultimately bullish — and that was essentially the low of last week, exactly where they held. The previous weekly value area low sits at 7746, and together those two are where things go south, at least temporarily. Underneath 7731.75, we will easily come down to the six-week composite POC at 7691. And look at that huge dividing line on the composite — all these buyers and all these sellers. If we slip below, from a TPO and market profile perspective there is a ton of support in there. That was value for six weeks, with a clear definition of buyers and sellers, so if for whatever reason the market comes down, it is a fantastic spot to look for a long. On last week’s profile, the previous week’s point of control is at 7776, and it is a double distribution — a big node up top that I am counting as a spot of interest, and it just so happens to line up with another point of control from a profile that is still untested, sitting all by itself at 7834. That is a highly reactionary spot that matches up perfectly with the SPX area I am about to show you. On the lower side, the previous week’s POC lines up with that massive volume node, Wednesday’s point of control, Thursday’s value area high, and Friday’s value area low — a big spot for us that lines up perfectly with the previous weekly point of control. That is our above/below pivot coming into the week.
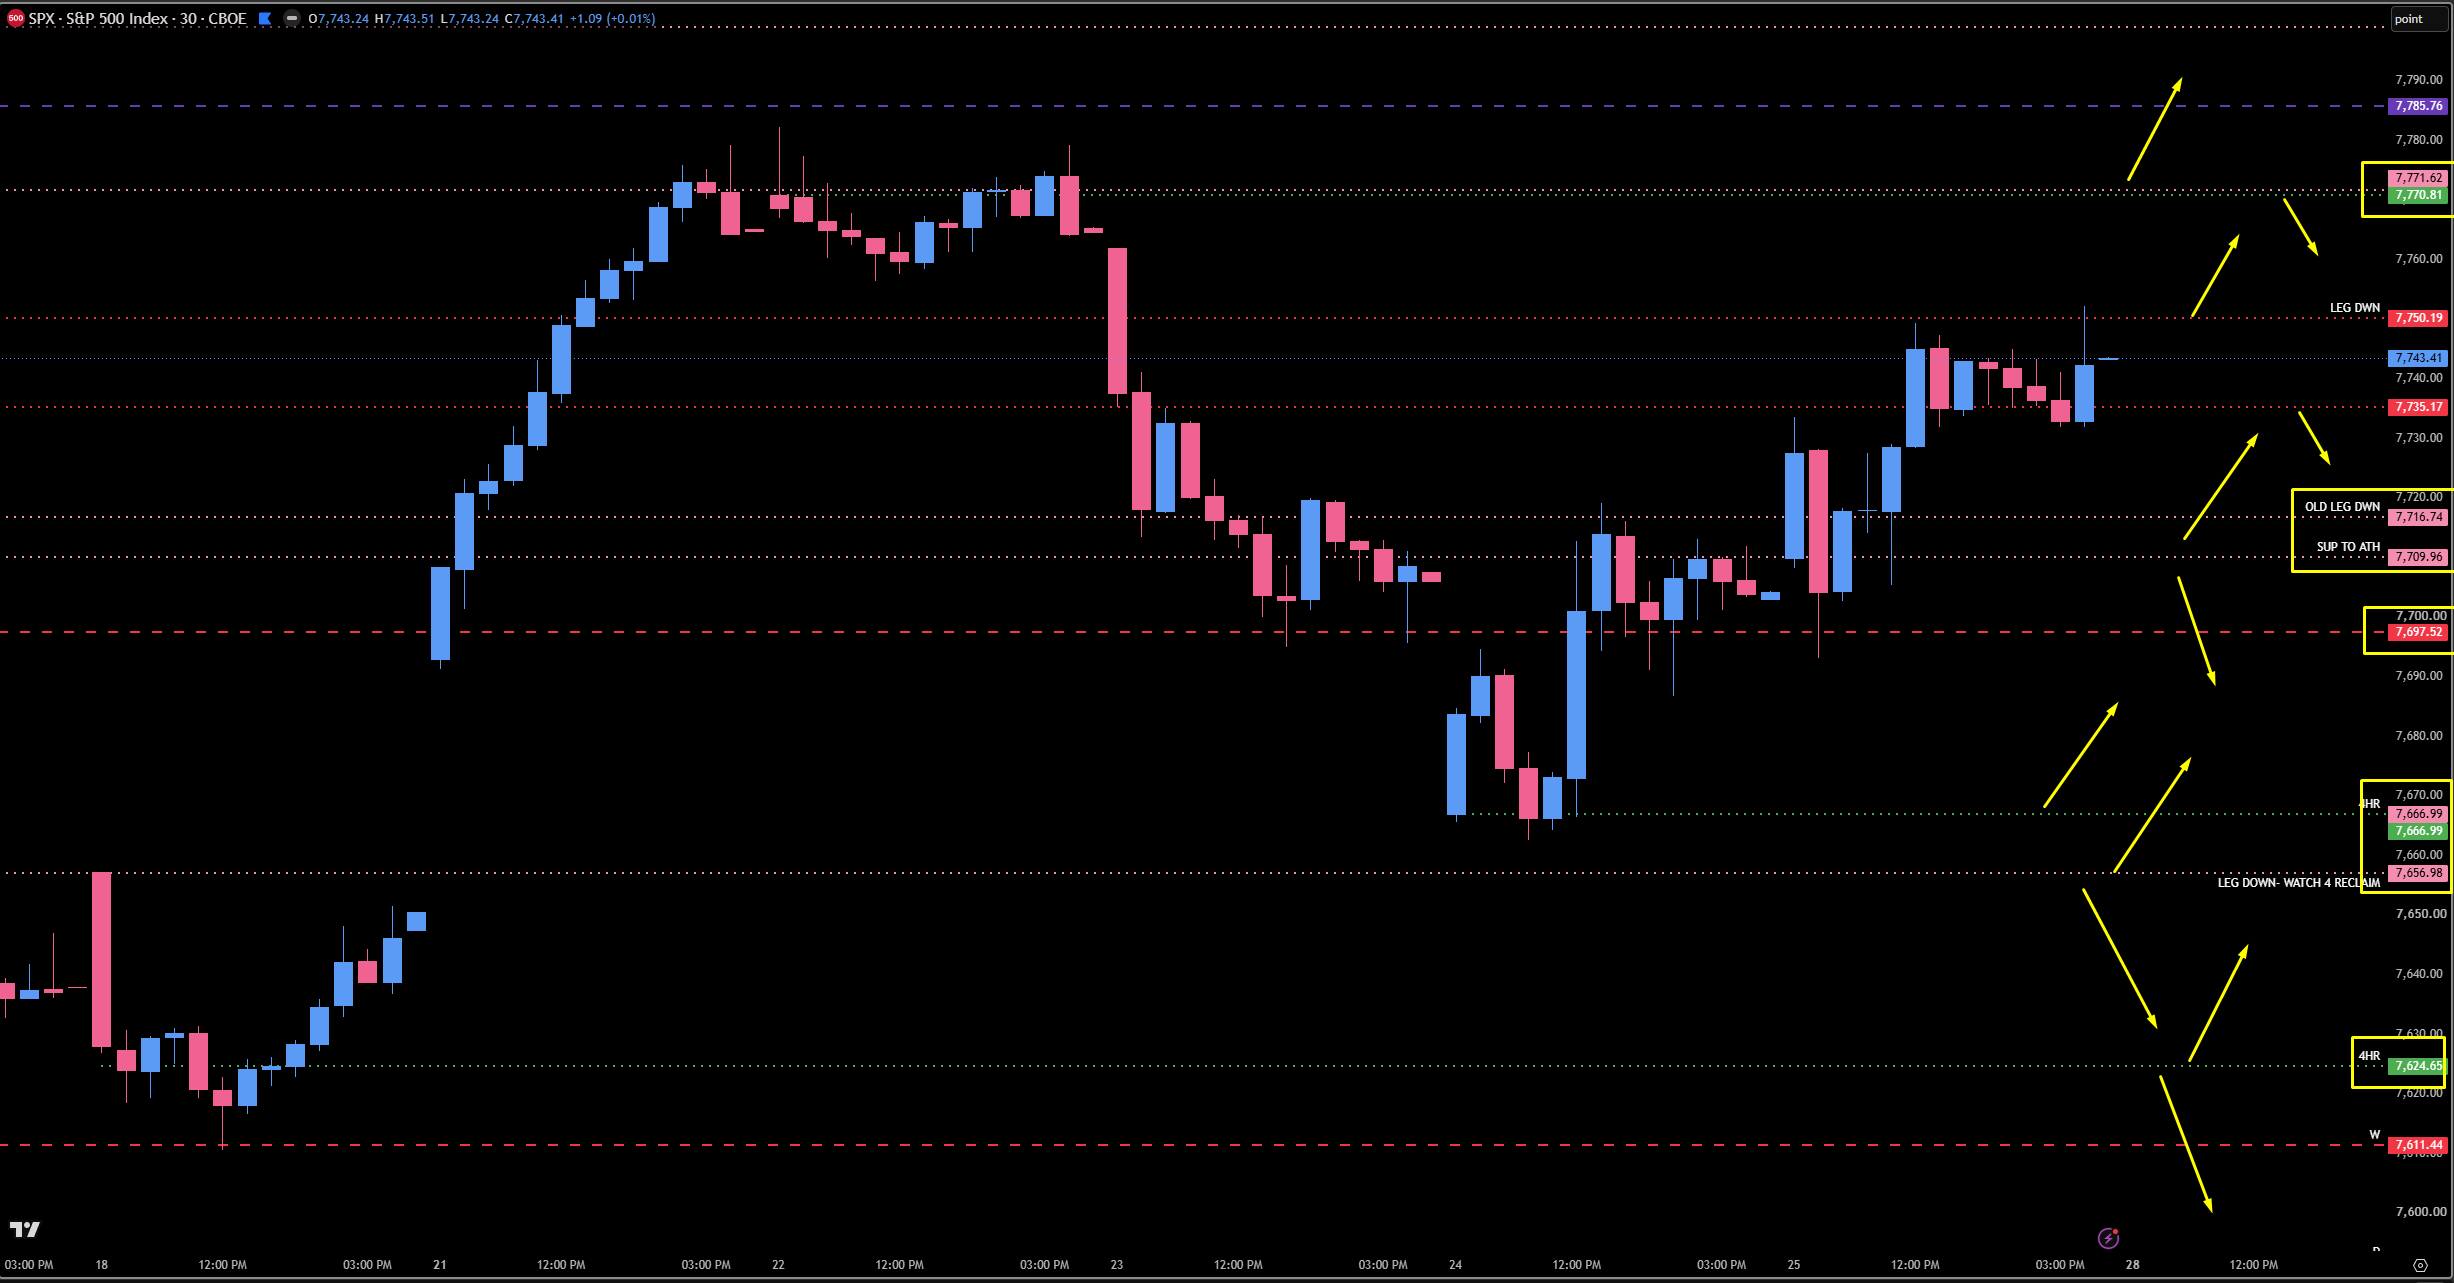
On SPX, pay very close attention, because the structure on our levels coincides almost perfectly with ES. We are up on all timeframes except the weekly, so we have reason to believe we continue higher — but we never truly know. The highest untested spot is the 7771 daily/four-hour, and this really is the best place to short. It is a very sensitive spot: it is the support that was lost on Wednesday, and it will more than likely get a pretty decent reaction. The 7750 is our big breakout pivot — we played it not once but twice — and a push above it will more than likely bring us up to 7771. Below, the 7735 daily is beautiful; you can see how it respected our levels perfectly, once from the bottom up and again as resistance up top. If we push below 7735, we come into two dailies I like very well: 7709, my favorite of the two because of what it represents — the support to the all-time high — and another leg I found at 7716. We have both of those levels in ES as well, plus the short at the highs, so the structure looks perfect. That area is our first major spot that truly needs to hold if we are going to continue our progression up. Underneath 7697, we can come all the way down to 7666, which is both a daily and a four-hour and the lowest untested spot. If they want to sweep the low, we have the next daily at 7656.98 — come down, reclaim, and go. But under 7656.98 we would be in serious trouble, with a big-time momentum shift. The 7697 is the area we gapped above last week, used as resistance, and then used as support — we shorted it, came back above, and now we are holding it. Once again it has proven true that momentum shifts greatly underneath 7697. So we want to stay above that and keep coming — and keep your eye on 7771. Push through it and we go make some all-time highs.
🚨 VIX Analysis: The 14.43 Daily Support
On Wednesday VIX came off the beautiful 14.15 daily, which shot us up. However, we came right into the major resistance spot at 16.20 and 16.39. Now we continue to drift back and forth in this balance area for VIX.
The One Spot Holding It Up: 14.43 (Daily). This is the next daily support and really the one more location we are looking at for a potential buy on VIX. The rest of this is untested. I have to believe that this area will more than likely get a reaction — but ultimately, in my opinion, it looks set up to fail. We never know, so keep an eye on 14.43 for big above/below context.
The Green Light: 14.15 (Daily). If we do not hold 14.43 and we push below 14.15, VIX comes down and sends the indices back up into all-time high territory — price discovery once again. If we push lower, we have the green light for the indices to go higher.
The Resistance: 15.32 (Four-Hour + Untested Weekly). We do have some big resistance here — a four-hour, and the weekly is untested. VIX could very much do one of those numbers and pop into it, so keep an eye on it when we come into the open.
The Ceiling: 16.20 - 16.39. The major resistance spot VIX ran right into after Wednesday’s squeeze. As we continue to get stuffed here each and every time, VIX keeps coming down.
🎯 Detailed Actionable Trade Plan (ES Futures)
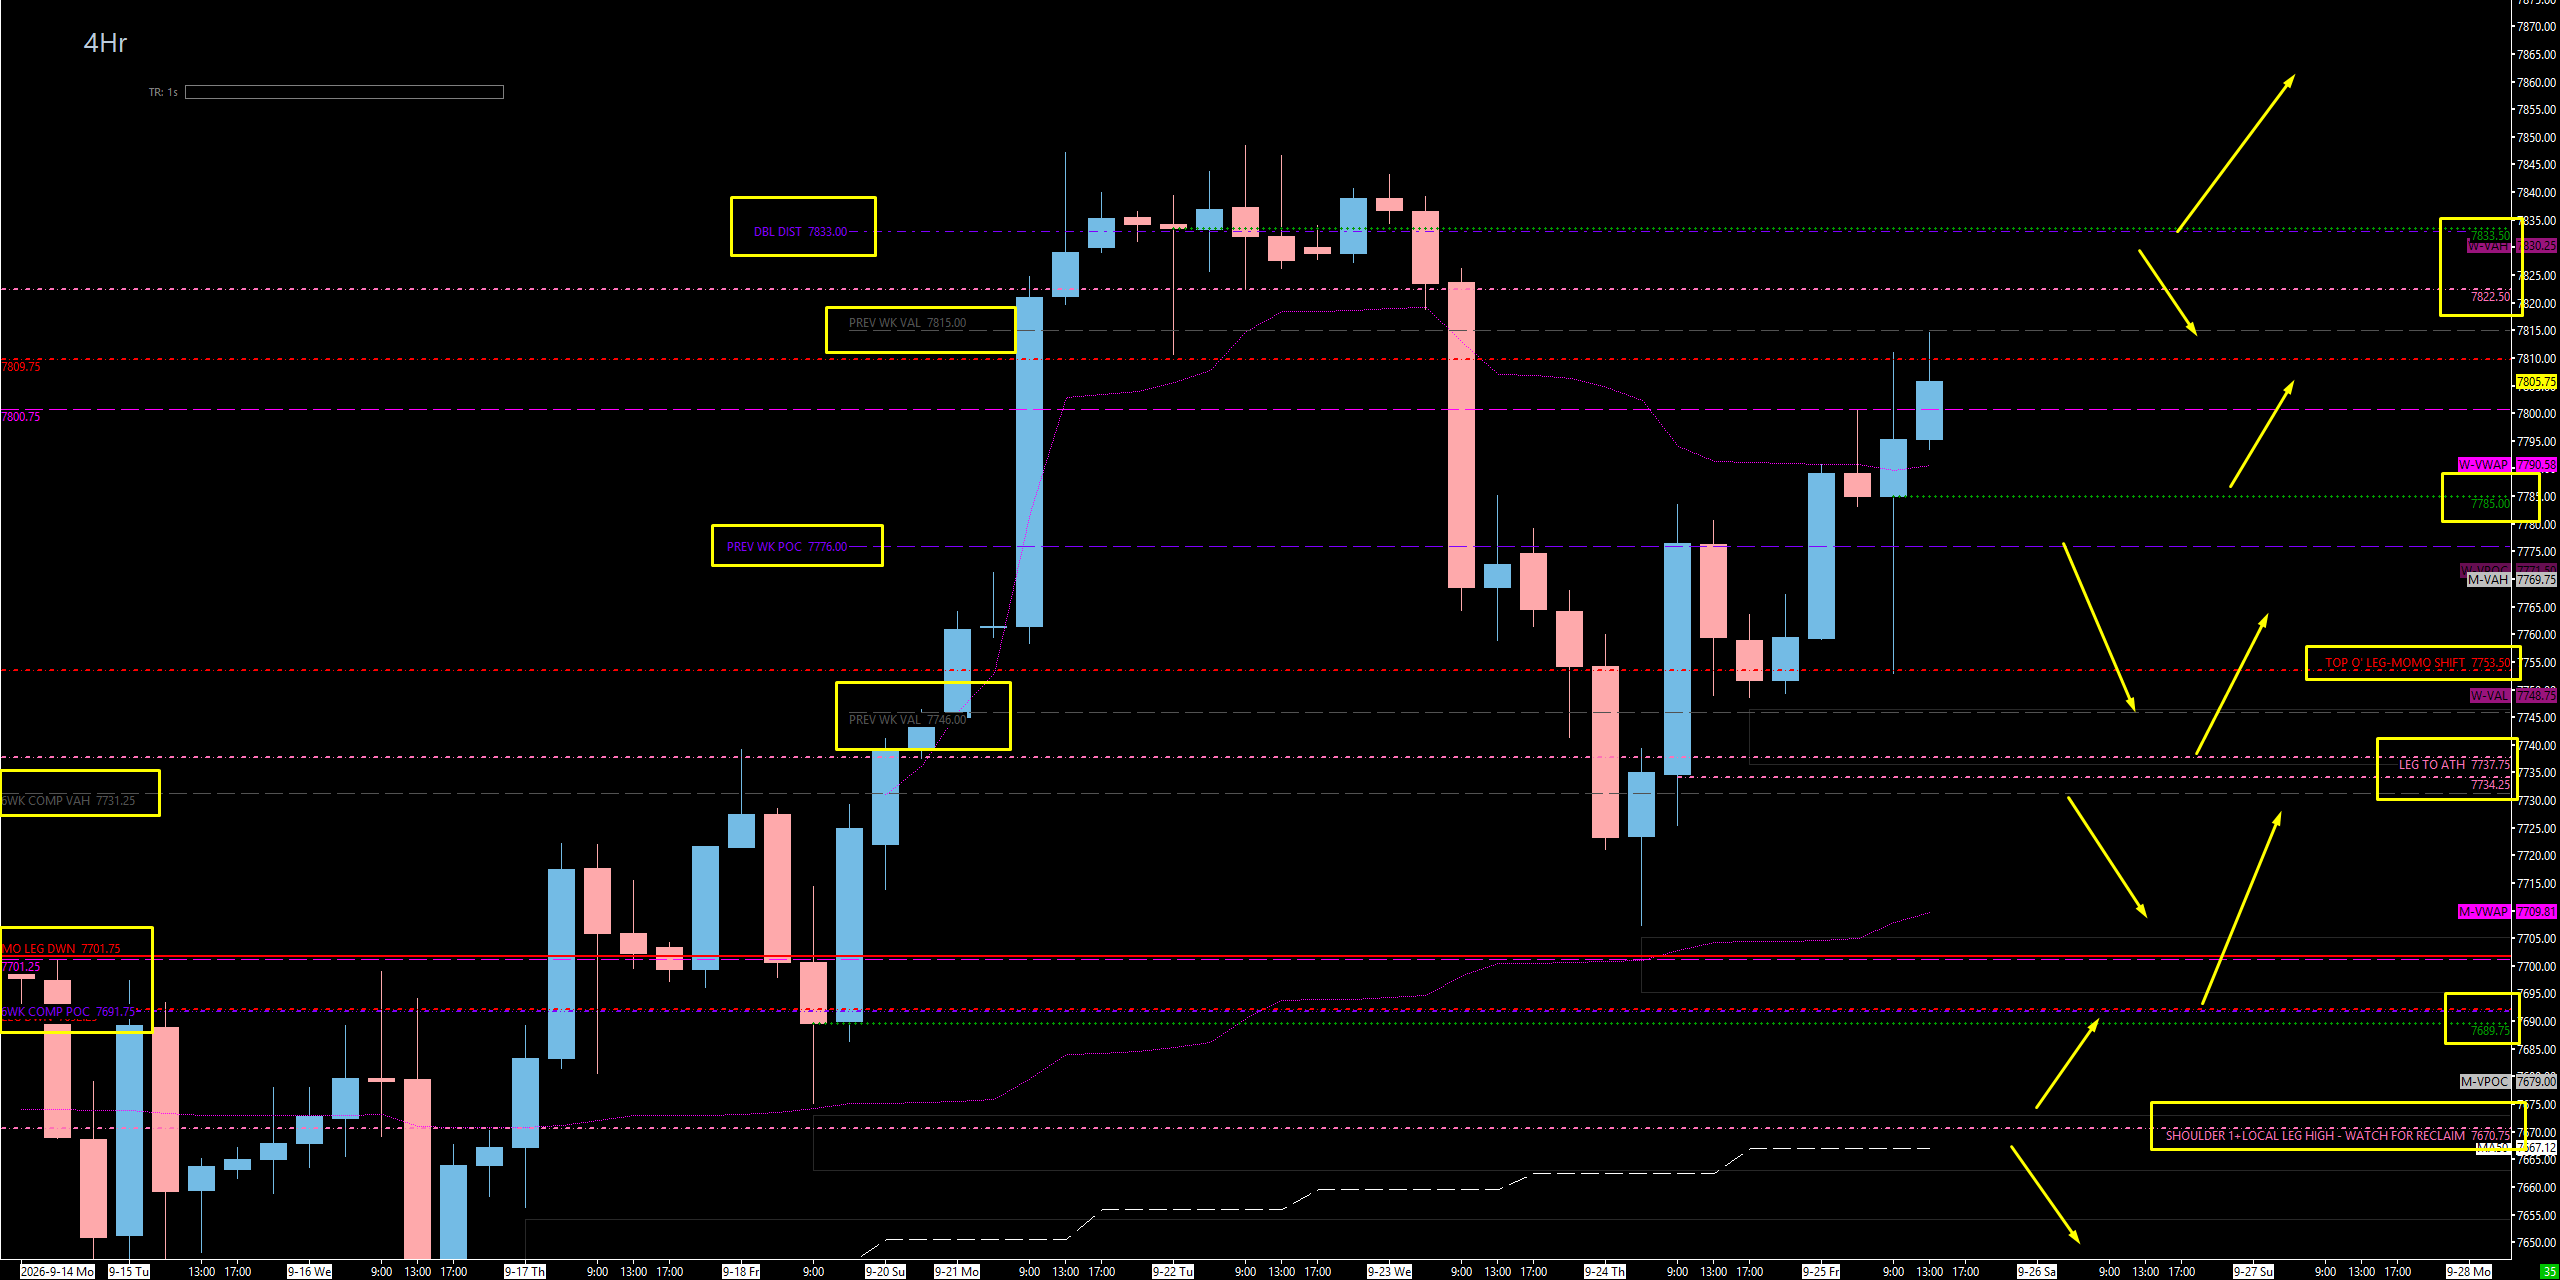
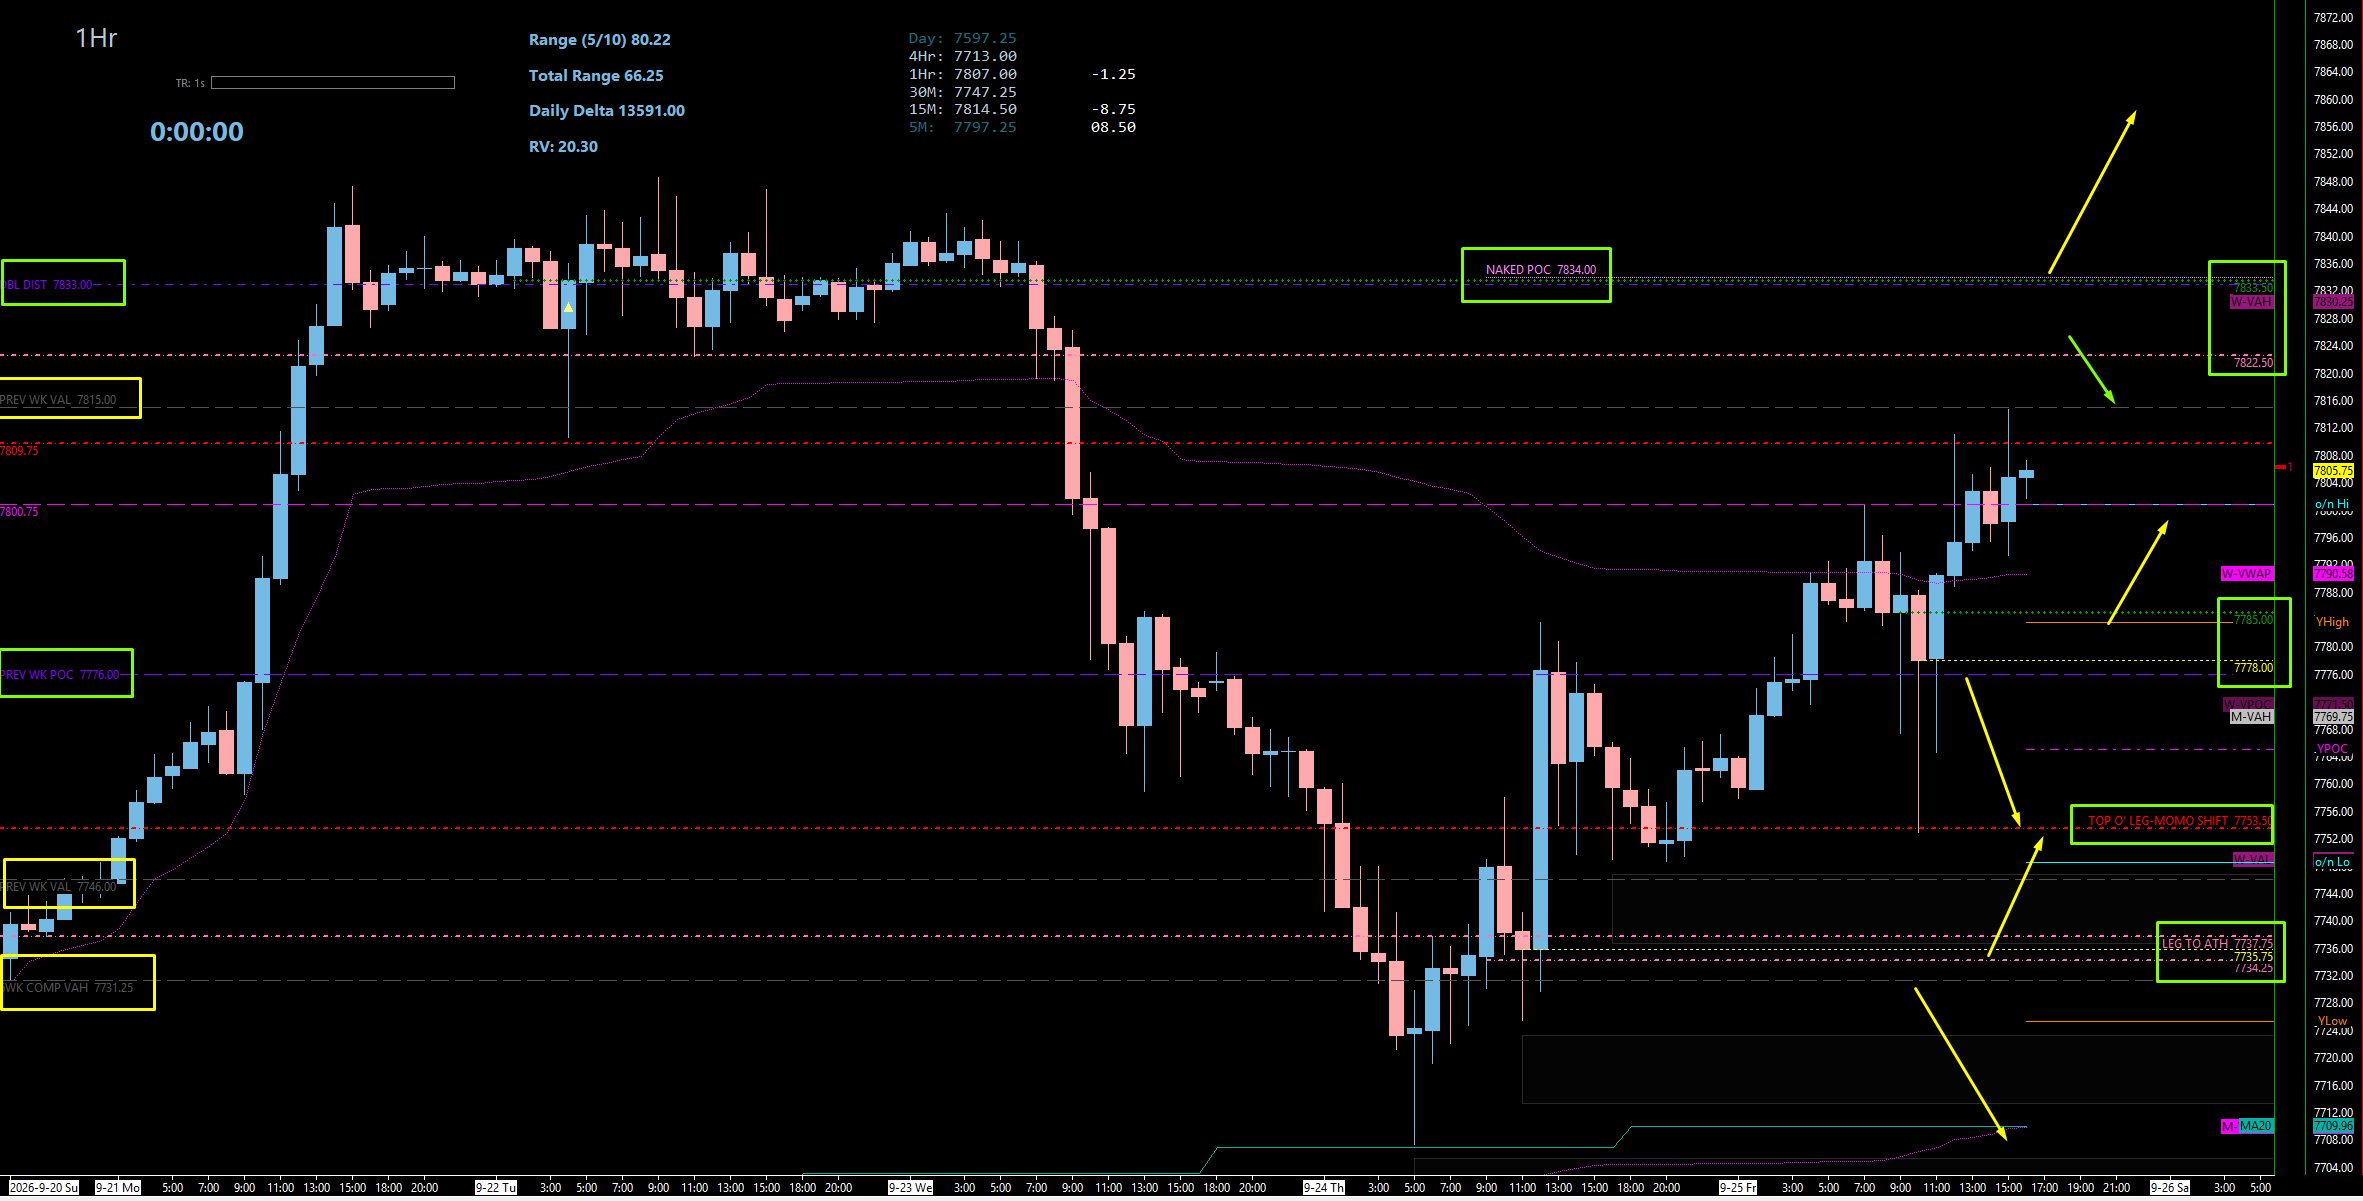
We are up on all timeframes and the weekly just gained, so the default is higher — but the 7822.50 - 7833.50 zone overhead has a lot of reasons to react, and 7785 is really our only protection to keep us pointed to the upside if it hits hard. The ideal trade: play 7785 and take it up to 7833.50. Above 7809 we get to the reaction zone; above 7822.50 we go back to all-time high price discovery. We use 7809 and 7800 as our big momentum shift levels. Below the 7778 - 7785 pivot, we come right down to the 7734 - 7737 dailies, where we want to hold and reclaim 7746 and ultimately 7753.50 to get extra long. And if that fails, we sweep down into the 7701 untested weekly and the 7691 daily and composite POC.
🔴 Key Resistance Zones & Setups
The Momentum Shift Pivots: 7800.00 - 7809.00
7809.00 (Tested Daily — Big Breakout Pivot), 7800.00 (Momentum Shift Level).
Context: 7809 has been important — this is what we played for the short on Friday, and it played for the long last Monday. It is going to be important again as a big breakout pivot above. We are using 7809 and 7800 as our big momentum shift levels.
Actionable Setup: As long as we push above 7809, we are going to get to the reaction zone above. On the way back down, if we play the upper areas and get back below 7809, we are probably coming down underneath 7800 for sure.
The Untested Daily — Serious Reaction Potential: 7822.50
7822.50 (Untested Daily — Final Untested Daily Resistance).
Context: We have one final untested daily level at 7822.50 — this is all the untested resistance from a daily timeframe that we have. Be careful here. This is an untested daily and it has the potential to get a serious reaction. It is a reactionary level and it should be an upside target.
Actionable Setup: If they push above 7822.50, we go back to all-time high price discovery. Treat it as a target on the way up and a spot to watch for the inverse reaction.
The Highest Spot — Four-Hour, Untested POC & Double Distro: 7833.50 - 7834.00
7834.00 (Untested Point of Control — Sitting By Itself), 7833.50 (Four-Hour).
Context: From a four-hour perspective, 7833.50 is a beautiful spot, and in my opinion it will get a reaction. How large, I am not sure — it has the potential to really smack hard. Look at what is up here: the double distribution I drew on the weekly profile, and the point of control sitting all by itself at 7834. There is a lot of confluence in this particular area, and it matches the SPX 7771 spot perfectly. I do not know where the juice is coming from, but this is the highest spot.
Actionable Setup: Take Profits / Watch For Reaction: This is the target for the 7785 long. We have a lot of reasons to believe the 7822.50 - 7833.50 area gets a reaction — it could be a very inverse reaction, or just a little head bump and a pullback before we continue to drift higher.
Warning: We are pointed up, the weekly just gained, and we are up on all timeframes — so I have to assume this plays for a small reaction, 10 to 20 points, and then we continue our move to the all-time high. But if it smacks hard, 7785 is the only thing holding us up.
🔵 Key Support Zones & Setups
THE ABOVE/BELOW PIVOT — Four-Hour, One-Hour & P.W. POC: 7776.00 - 7785.00
7785.00 (Four-Hour — Only Four-Hour Support), 7778.00 (One-Hour), 7776.00 (Previous Weekly Point of Control), plus the massive volume node below it.
Context: 7785 is our only four-hour support right here, and I actually like this level pretty well as we try to retrace up to the leg to the high. On the one-hour we have a beautiful level at 7778, so it is really 7785 through 7778 — this is the spot. And look what is right there: the previous weekly point of control, the one I told you is our big above/below pivot, plus that massive volume node with over 14,000 buyers underneath it.
Actionable Setup: Buy Setup: I would love to play 7785 and take us up to 7833.50, if we are so blessed to get that trade. We will see where we open.
Warning: If we get a smack off 7833.50, this is the only level holding us up for some time unless we come much farther — and much farther means well down into the 7730 area, a 100-point smack. Below this pivot on the one-hour, we are not going to hold — we come all the way down to the dailies below. And note the sequence: if they wipe 7785 first and then play the upper zone, 7785 is tested on the way back down. If they hit the upper zone first, 7785 is still untested on the way down and could prop us up.
The Reclaim Ladder — P.W. VAL & Friday’s Low: 7746.00 - 7753.50
7753.50 (Tested Daily — Monday’s Pivot / Friday’s Low), 7746.00 (Previous Weekly Value Area Low).
Context: 7753.50 is our previous leg down — a huge area we needed to close above for many days to gain on the daily. We shot well above it and gained, and then we played the top of it on Friday — Friday’s pop, the perfect low of the day that we called in the plan. Just beneath it is the previous weekly value area low at 7746.
Actionable Setup: These are the reclaim triggers for the buy zone below. Get back above 7746 and ultimately 7753.50 to get extra long and ride back higher.
THE BUY ZONE — Untested Dailies & The Composite Edge: 7731.75 - 7737.00
7737.00 (Untested Daily), 7734.00 (Untested Daily), 7731.75 (Six-Week Composite Value Area High).
Context: I really like this area. These two dailies at 7737 and 7734 are all we have in this current move to the high that is untested. Stacked with them is the six-week composite value area high at 7731.75 — the edge they held last week. This is our edge. And we really want to stay above 7734 from a momentum standpoint.
Actionable Setup: Buy Setup: If we get below the 7778 - 7785 pivot, we come right down into these dailies. We want to see them hold, and we want to get back above the previous weekly value area low at 7746 and ultimately 7753.50 to get extra long and ride back higher. Play 34 / 37, come back up, and make new highs.
Warning: If not, we have no choice but to move back lower, and it could come much, much lower into our first real big spot below. Underneath 7731.75, things go south, at least temporarily.
The Sweep Zone — Untested Weekly & Composite POC: 7691.00 - 7701.00
7701.00 (Untested Weekly — Leg Up), 7691.00 (Daily + Six-Week Composite POC), plus our untested four-hour leg to the high in this area.
Context: The big weekly at 7701 was our huge trigger to have confidence that we were going to jet this week, and it is going to be important again, as this is truly our leg up. We really want to be above 7701 from a momentum standpoint to keep our massive bullish lean. Below it, we have the daily and the six-week composite POC at 7691 — remember that huge dividing line of buyers and sellers. And let’s not forget our four-hour leg to the high right here — very much untested. We waited on this level last week and they never played it. It is still wide open.
Actionable Setup: Sweep Setup: If the buy zone fails, we will more than likely sweep the low — and the 7701 untested weekly would make a beautiful sweep. With the 7691 daily and composite POC and that untested four-hour leg to the high all in here, we still have a couple of really nice, really defined areas to play for longs.
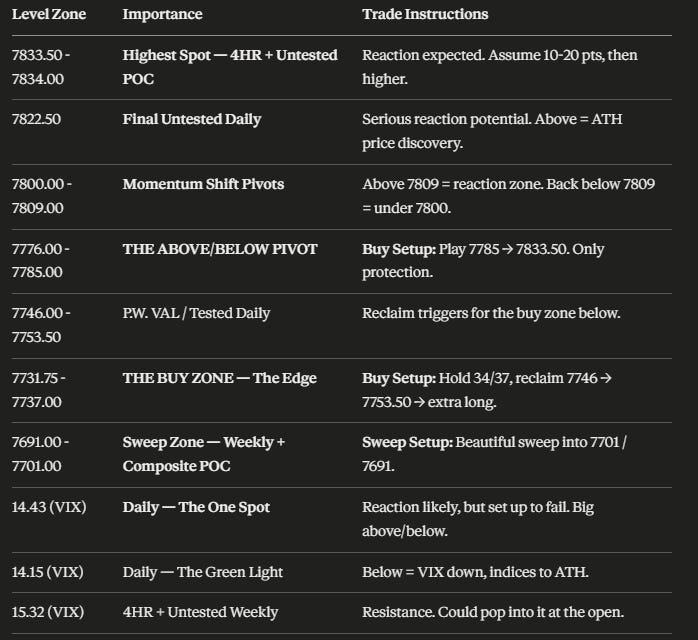
📌 Cheat Sheet – Key Levels Recap
🧠 Final Thoughts
I think the plan is extremely defined — I think it is gorgeous, and these charts really came out well. We have a lot of confluence: SPX looks just like ES, and VIX has essentially one spot holding it all up at 14.43 — and if that fails, it tells us the indices continue to push higher. We are up on all timeframes, we are still looking to the upside, and we know exactly where things go south. Our pivots are generated both by the weekly TPO and by our structure and process.
Here is the whole map. Overhead, 7809 is the breakout pivot that gets us into the 7822.50 - 7833.50 reaction zone — an untested daily, a four-hour, a double distribution, and an untested POC at 7834 all stacked together. I have to assume it plays for a small reaction and then we continue to the all-time high, but it has the potential to smack hard. 7785 is really our only protection if it does — play 7785 and take it up to 7833.50 is the trade I want. Below that pivot, we come down to the 7734 - 7737 dailies at the six-week composite edge; hold them and reclaim 7746 and 7753.50 to get extra long. If not, we sweep into the 7701 untested weekly and the 7691 daily and composite POC, with that untested four-hour leg to the high still wide open down there. On SPX, keep your eye on 7771 — push through it and we make all-time highs — and remember that momentum shifts greatly underneath 7697, with serious trouble below 7656.98.
Thank you so much for joining me. I cannot wait to see you tomorrow for the post-market breakdown at five, and of course my homies in the Inner Circle first thing in the room. If you are a Trade Plan subscriber and you are not in the Inner Circle, shoot me a DM and I will get you in there. Have a fantastic rest of your Sunday, and I will see you tomorrow as we conquer the markets. Cheers.
Until next time—trade smart, stay prepared, and together we will conquer these markets!
Ryan Bailey, VICI Trading Solutions.
📊 Indicator String
Copy and paste the levels below into your S&P Edge Levels indicator to automatically plot today’s key levels on your chart:
7833.50|4HR|4H
7822.50|D|D
7809.00|Tested D|TD
7785.00|4HR|4H
7778.00|1HR|1H
7753.50|Tested D|TD
7746.00|P.W. VAL|GD
7737.00|D|D
7734.00|D|D
7701.00|WK|W
7691.00|D|D
4hr
1hr
wk tpo
SPX
VIX


