

Welcome back, everybody. It is time for the Weekend Review, and I hope everyone had an awesome weekend — I am personally fresh and recharged. We had a stellar week last week: we essentially had the top, the bottom, and everything in between. Between SPX, ES, and VIX, it was a nonstop hit show. The price action was rough — most of the action happened in the afternoon while the mornings were really slow — but the plan still played true. And here is one of the real positives from last week: we are starting to get bigger ranges, not only in the Globex session but in the cash session as well.
So instead of highlighting all the amazing trades, let’s get right into this week. We have a beautiful-looking chart across both the indices and VIX, and it is a really defined plan. Laser focused and ready to bring the hits. I am thirsty for this one. As usual, we start with VIX.
📧 Check Your Spam Folder Follow-ups and SPX Brief emails are landing in spam. Look for rbailey@vicitradingsolutions.com and info@vicitradingsolutions.com, mark them “Not Spam,” and add them to your contacts so you keep getting them.
☕ FREE — The New & Improved SPX Morning Brief SPX value levels, 150+ indicator prediction assessments, and the day’s top news — in your inbox before the bell. Completely rebuilt and completely free. Seats are limited and they fill up fast. Get your seat now → https://go.vicitradingsolutions.com/spx-brief
A Note on This Week’s Market:
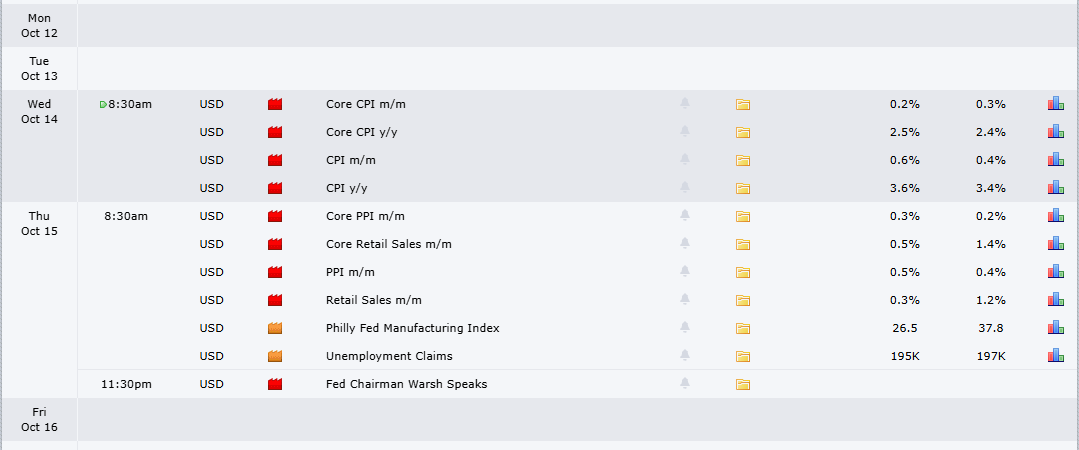
Scheduled News:
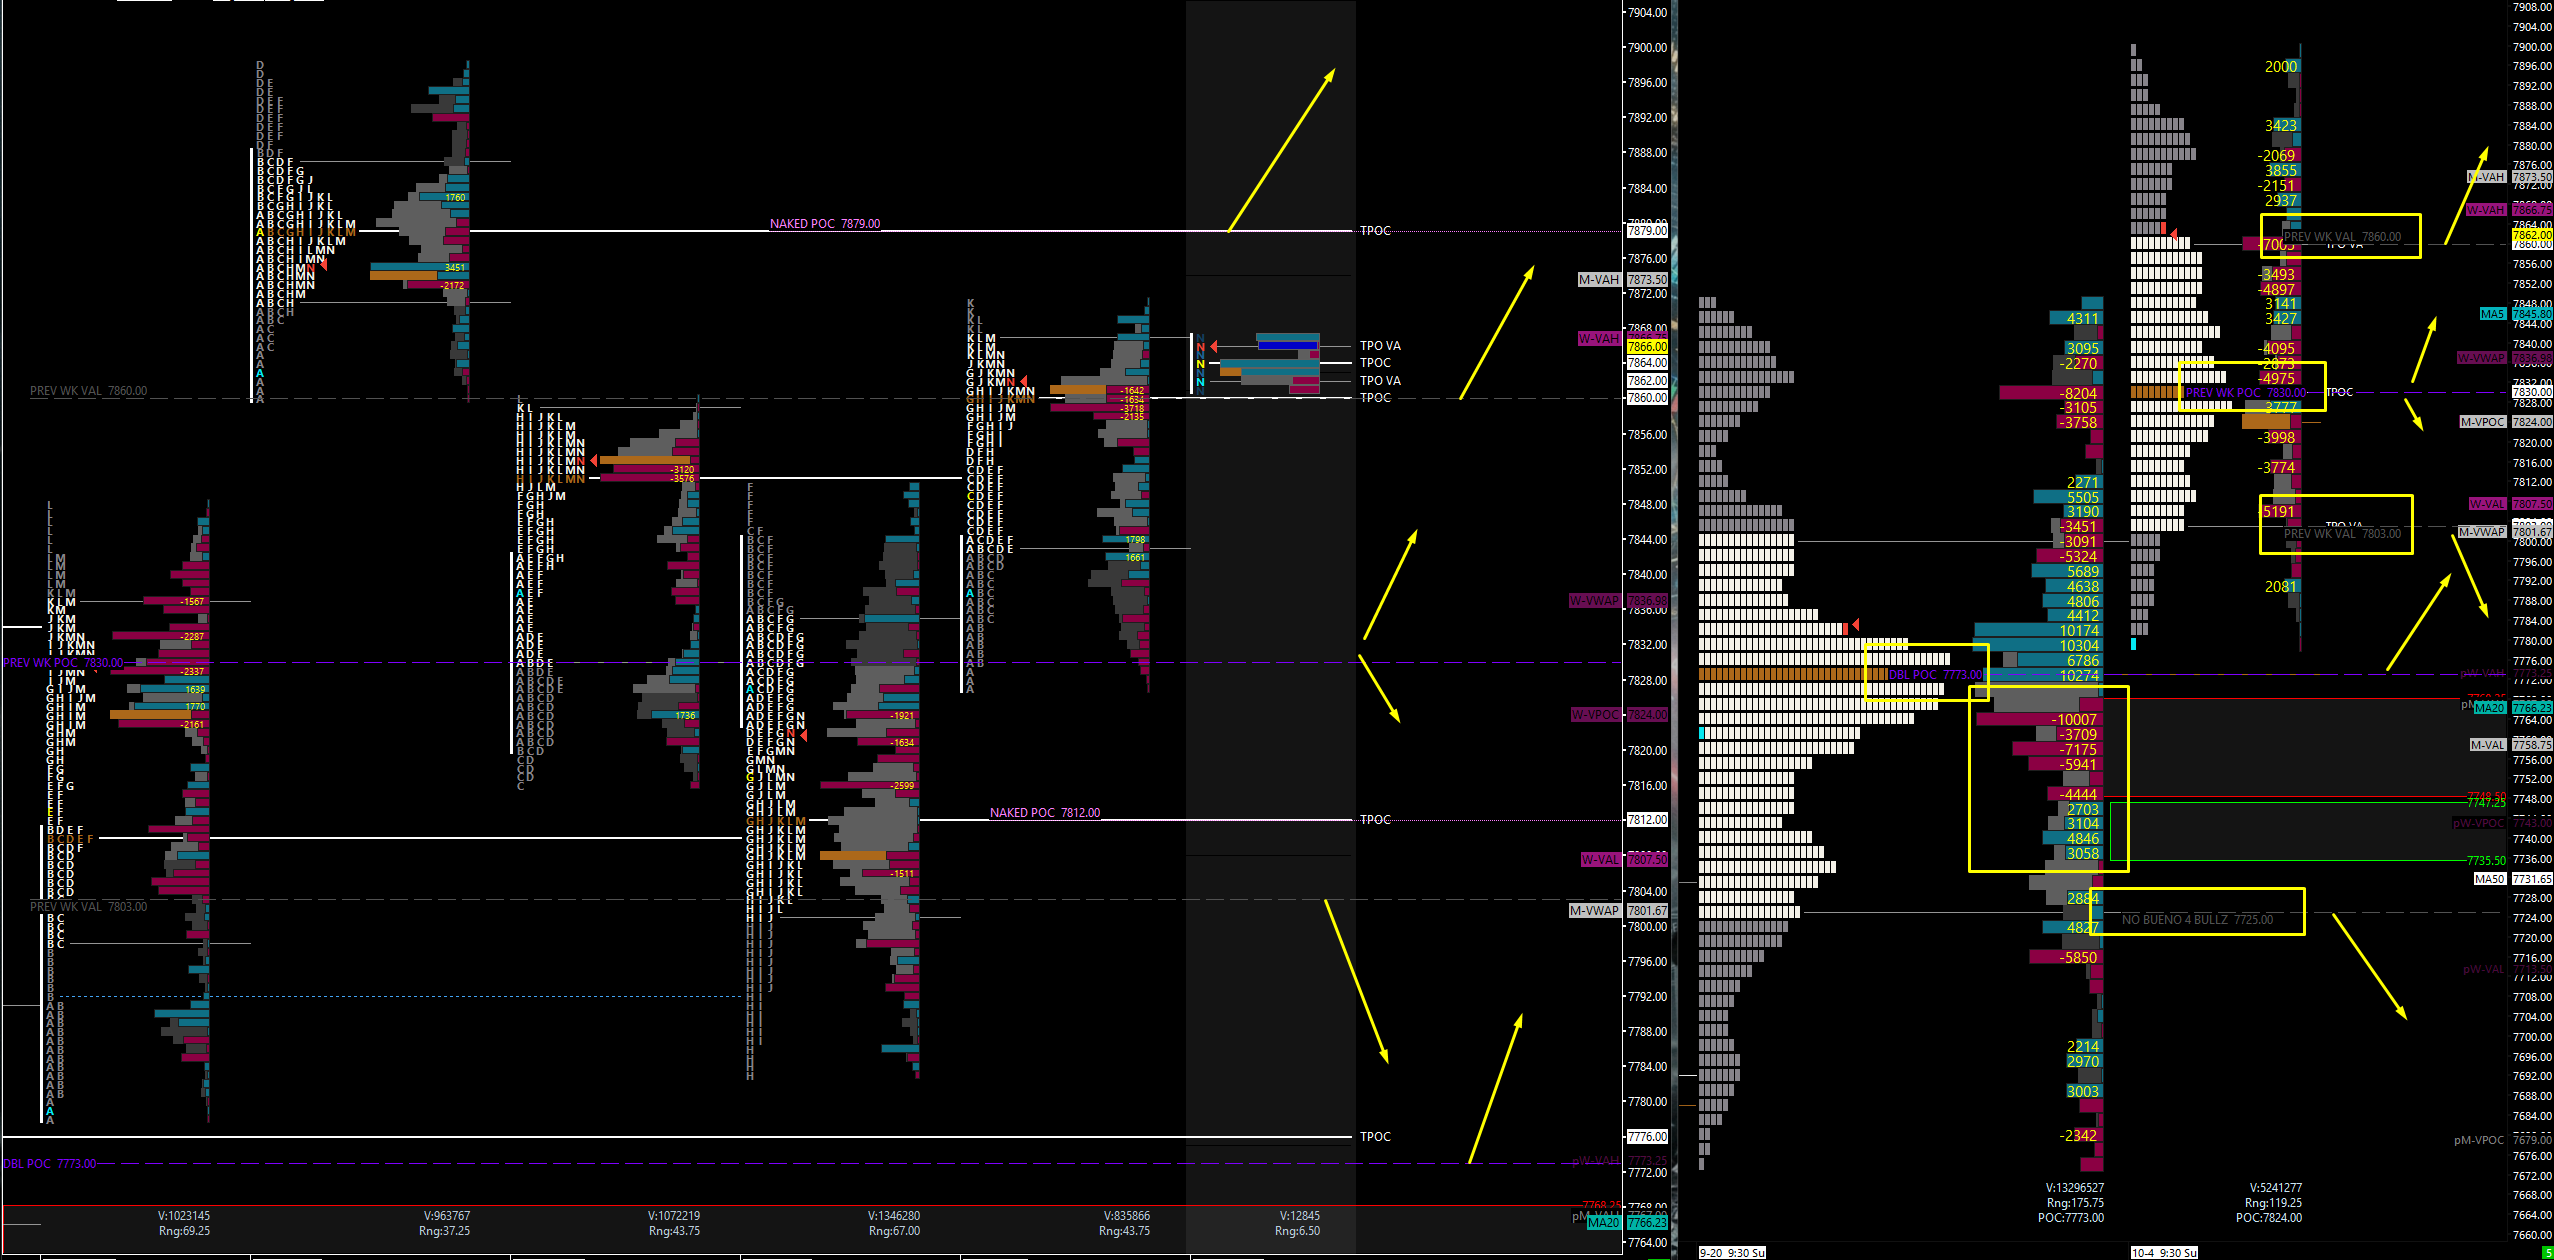
Volume: Ranges are expanding in both the Globex and cash sessions. Last week the mornings were slow and the action came in the afternoon, but bigger ranges are exactly what we want.
Range: On the ES weekly TPO, the previous two weeks overlapped beautifully with double overlapping points of control. We lean very bullish above 7860, and below the previous weekly value area low at 7803 we start pushing out of the previous value.
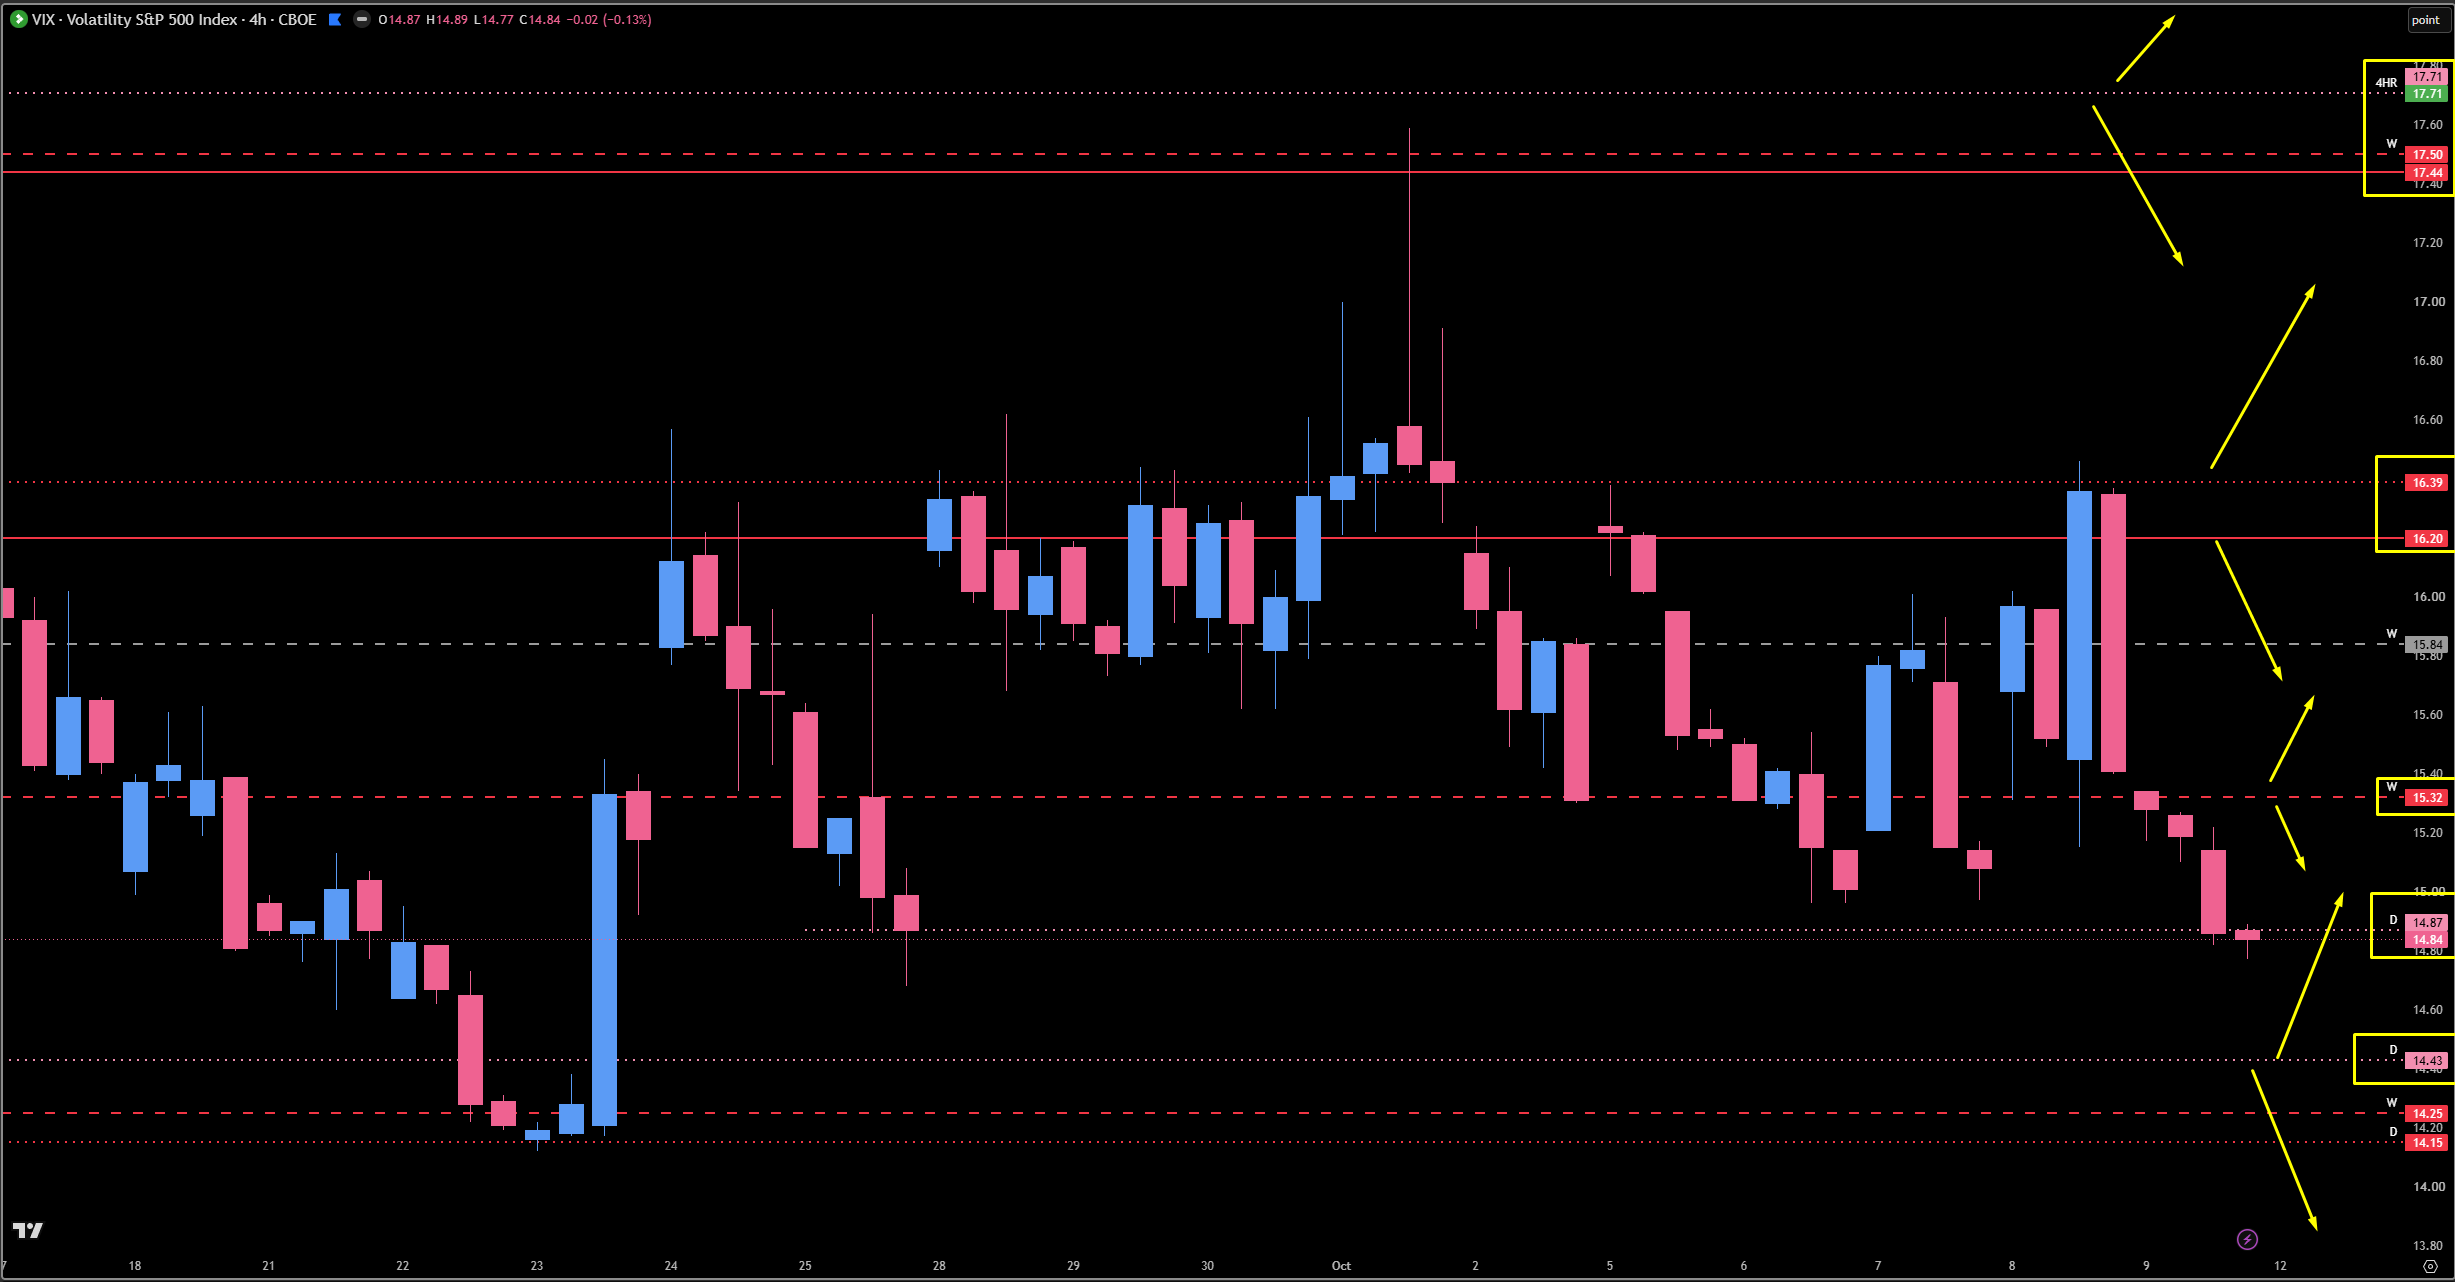
VIX: VIX got smacked from the 16.39 / 16.20 pivot once again and is drifting lower. As long as it stays below that pivot, VIX stays heavily suppressed and the indices push higher. The 14.43 final untested daily is the spot to watch for a pop.
Trend: Up on all timeframes. No reason to be bearish — I am looking for all possible outcomes. The catch: we have limited buy spots, but they are high quality. That means a few real opportunities this week to make some money.
🧠 Current Market Context
Up On All Timeframes, But One Line Decides Everything
We are pointed up across the board, but the bulls did not get the close I wanted on Friday. On SPX, I really would have loved to see the close above 7818 — it would have given me massive confidence — and they did not get it; we actually played it. On ES, I would have preferred a nice solid close above the 7875 daily, and then I would have been buying it hand over fist. That did not happen either, so now I am being careful. The buy spots are clean, the structure lines up perfectly between SPX and ES, and we know exactly where things start to shift.
On the ES weekly TPO, last week’s profile and the previous two weeks combined overlapped beautifully with double points of control. We are bullish above 7860 — in truth it is a tad higher, but we start to lean very bullish above it — and the weekly point of control is a fantastic pivot. Below the previous weekly value area low at 7803, we push out of the previous value — and that number should ring a bell, because 7800 is also our big weekly and a big momentum shift pivot. Even better, the two-week composite value area high lines up within three points of it — 7800 exactly. We will use that for above/below. If we rotate lower, we have that big double point of control, and just like last week we had a massive area of volume on the buy side and a beautiful split on the sell side. Remember the other big composite point of control we talked about in the post-market breakdowns? They dipped right into that massive selling area and took off like a shot. History does not repeat, but it sure does rhyme.
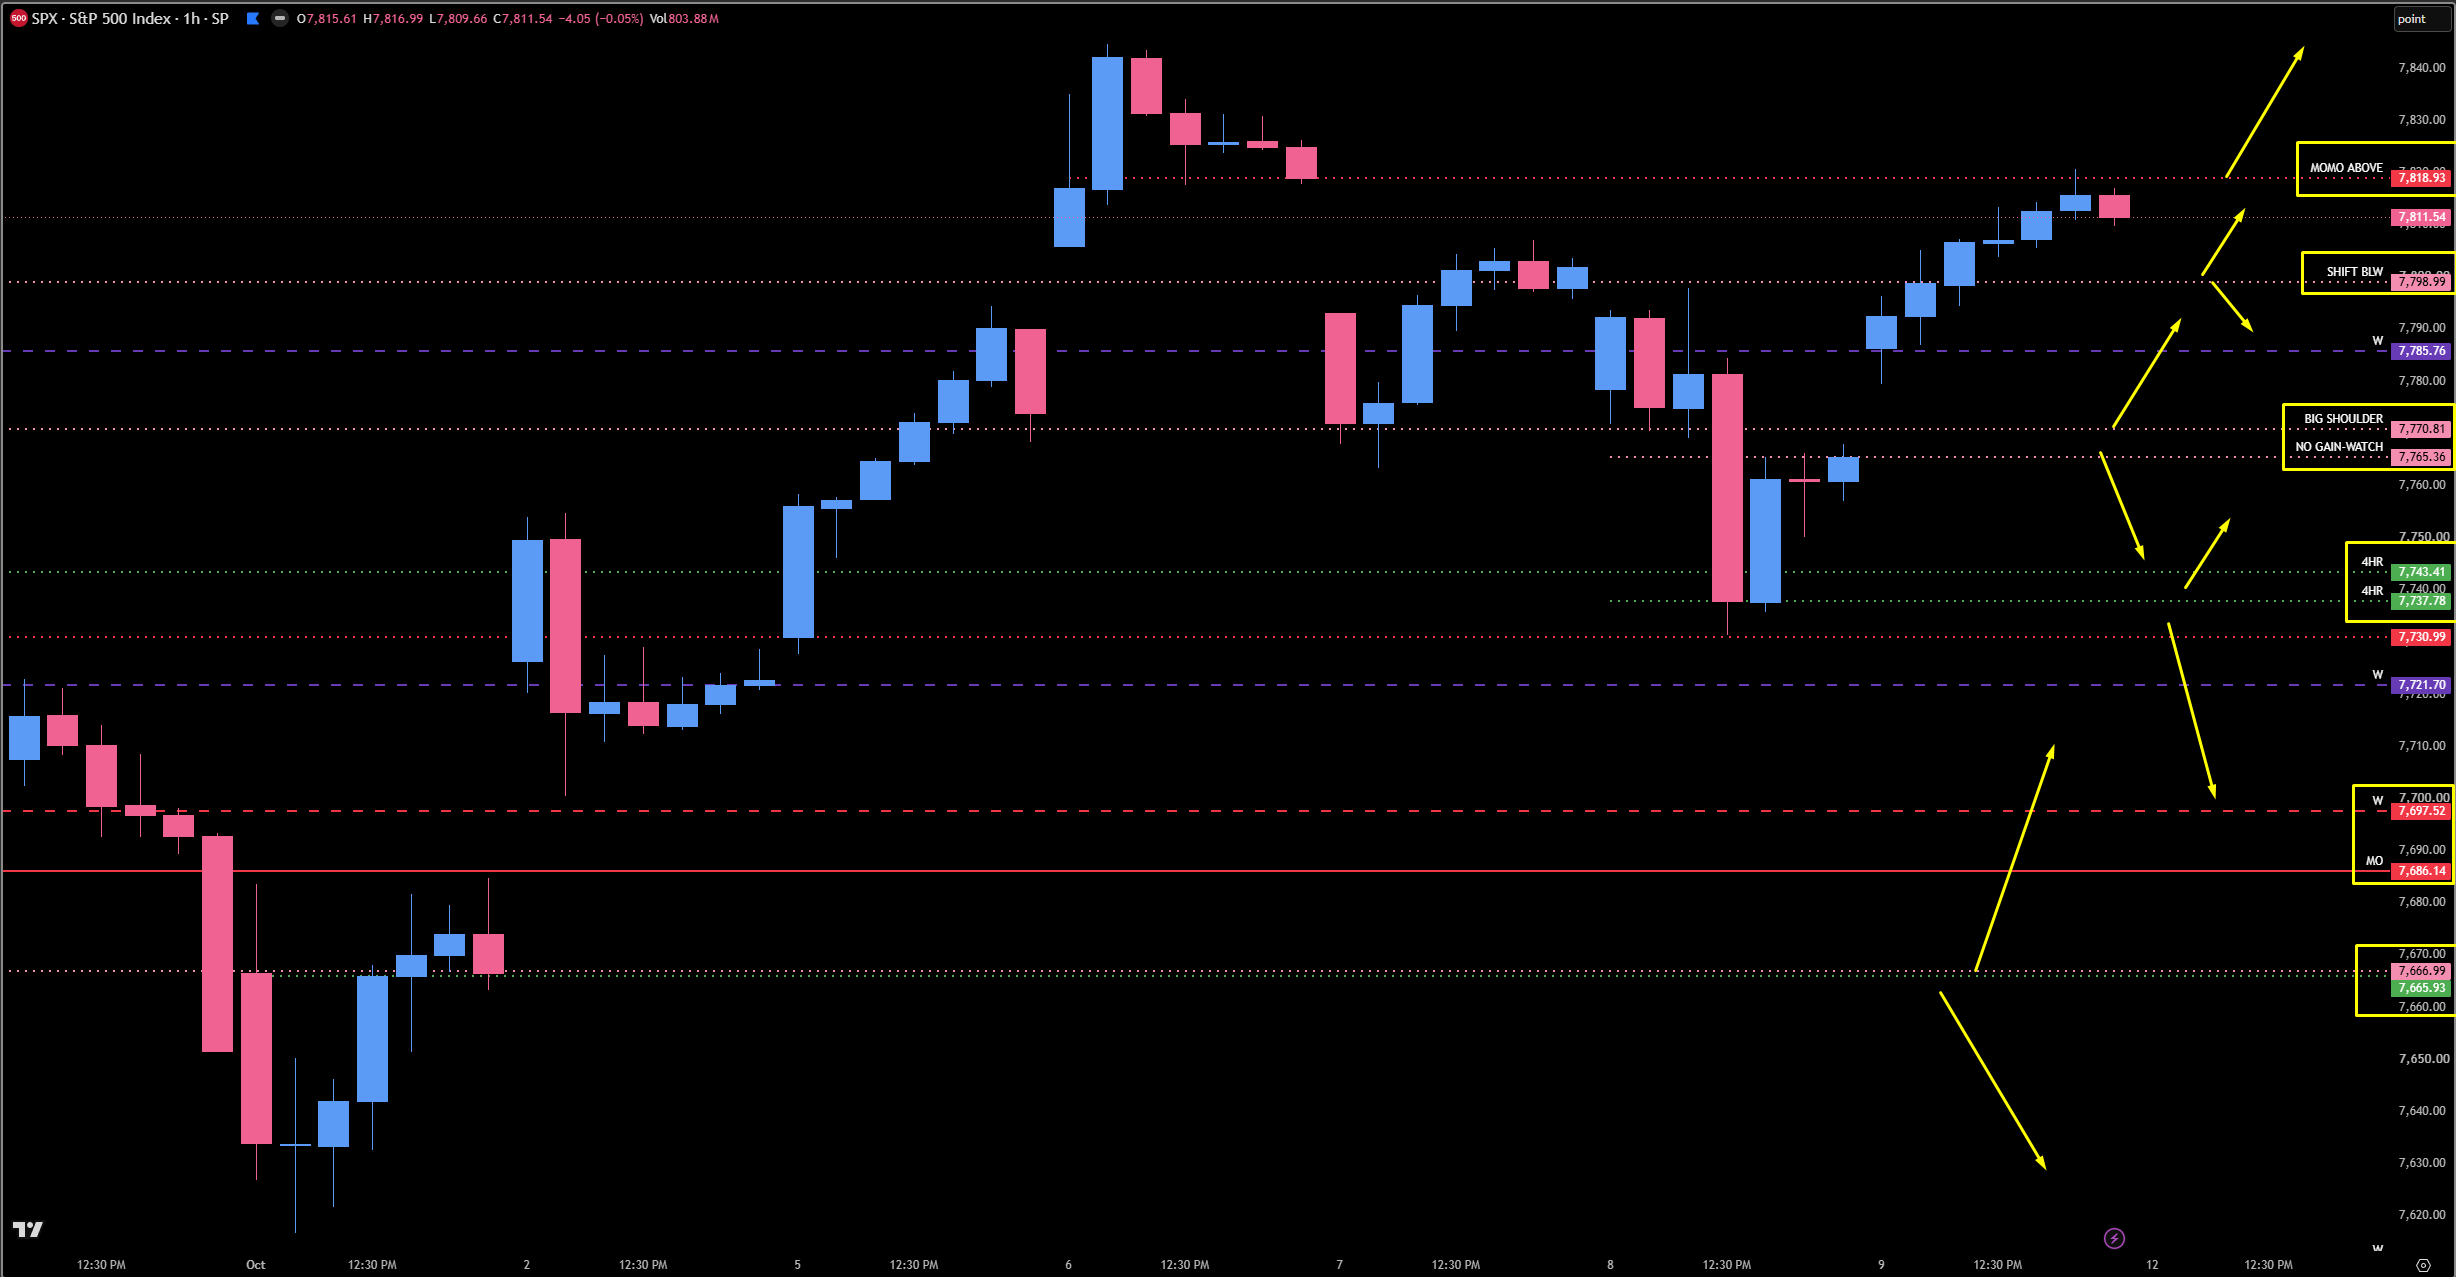
On SPX, this thing has been absolutely beautiful. We knew coming off the 7730 last week that it was the big must-hold spot — it was truly the move up — and they pulled right back into that pocket of support and launched. We have absolutely knelt down on it multiple times, and in the plan we called the beautiful flag that worked out the day we called it. Now we have some very nice buy spots, but they are limited. 7818 was our highest untested spot, the gap fill, and the big daily — we pushed up there Friday for a little pause and played it. Above 7818, we get momentum to the upside and look for new all-time-high price discovery. Directly below is 7798, a big untested daily — our first buy spot — and in my opinion things start to shift heavily underneath it. ES has a perfect spot that aligns with it beautifully. If we push below 7798, I am not screaming bearish — I am screaming be careful, because we are moving below this leg and back into that major resistance area from the Trump / Iran news that sent us lower. Our number two buy spot is 7765 - 7770: the 7770 daily was super important on the 7th — they held it and pushed us up — and we have a big shoulder there. The 7766.99 is the last do-or-die spot and our ultimate main pivot. It is prime for a buy per my process, but below it, things get shifty and they get shifty fast. We do have two untested four-hours at 7743 and 7737, and if you are looking for a scalp you could probably pull one there — but watch out, because you will more than likely not get back above 7765 - 7770. That tap at the highs was very significant. We are up on all timeframes and I have no reason to be bearish, but the main shift starts right at 7798.
🚨 VIX Analysis: The 14.43 Final Untested
We started last week with a super impressive call: the 16.39 / 16.20 monthly area was clearly untested and preparing us for a potential smackdown on VIX. We gapped up at 15.32 on the open and slowly worked down, got a big pop from the 14.87 untested daily leg, and went right back to the big 16.39 / 16.20 above/below pivot — and once again it acted as resistance and brought VIX down. That was a phenomenal call that gave us the inverse correlation to get long. VIX has truly been our guiding light.
The Swept Daily: 14.87 (Daily — Now Tested). This area is truly tested now, but it could still provide a reaction since we swept the lows here. We will see where we open Monday — a pop here would not surprise me a lot.
The Final Untested: 14.43 (Daily). We are going to assume we drift down into 14.43 eventually — it is our final untested daily area and the last untested spot, and I do believe it could get a significant reaction. If they want to rocket VIX out of here, this very well could be the spot. Because we never know, we keep risk management first and our play second.
The Static Levels: Beyond that, all we have is static support — nothing left untested. If VIX pushes above 15.32, we could get a nice move, and we will watch 15.84.
The Pivot That Matters: 16.39 / 16.20. Nothing really happens until VIX gets above or below 16.39. As long as it stays below, VIX remains heavily suppressed, sending the indices much higher. But watch for a breakout up there — I do believe it gets another reaction if we visit it again.
🎯 Detailed Actionable Trade Plan (ES Futures)
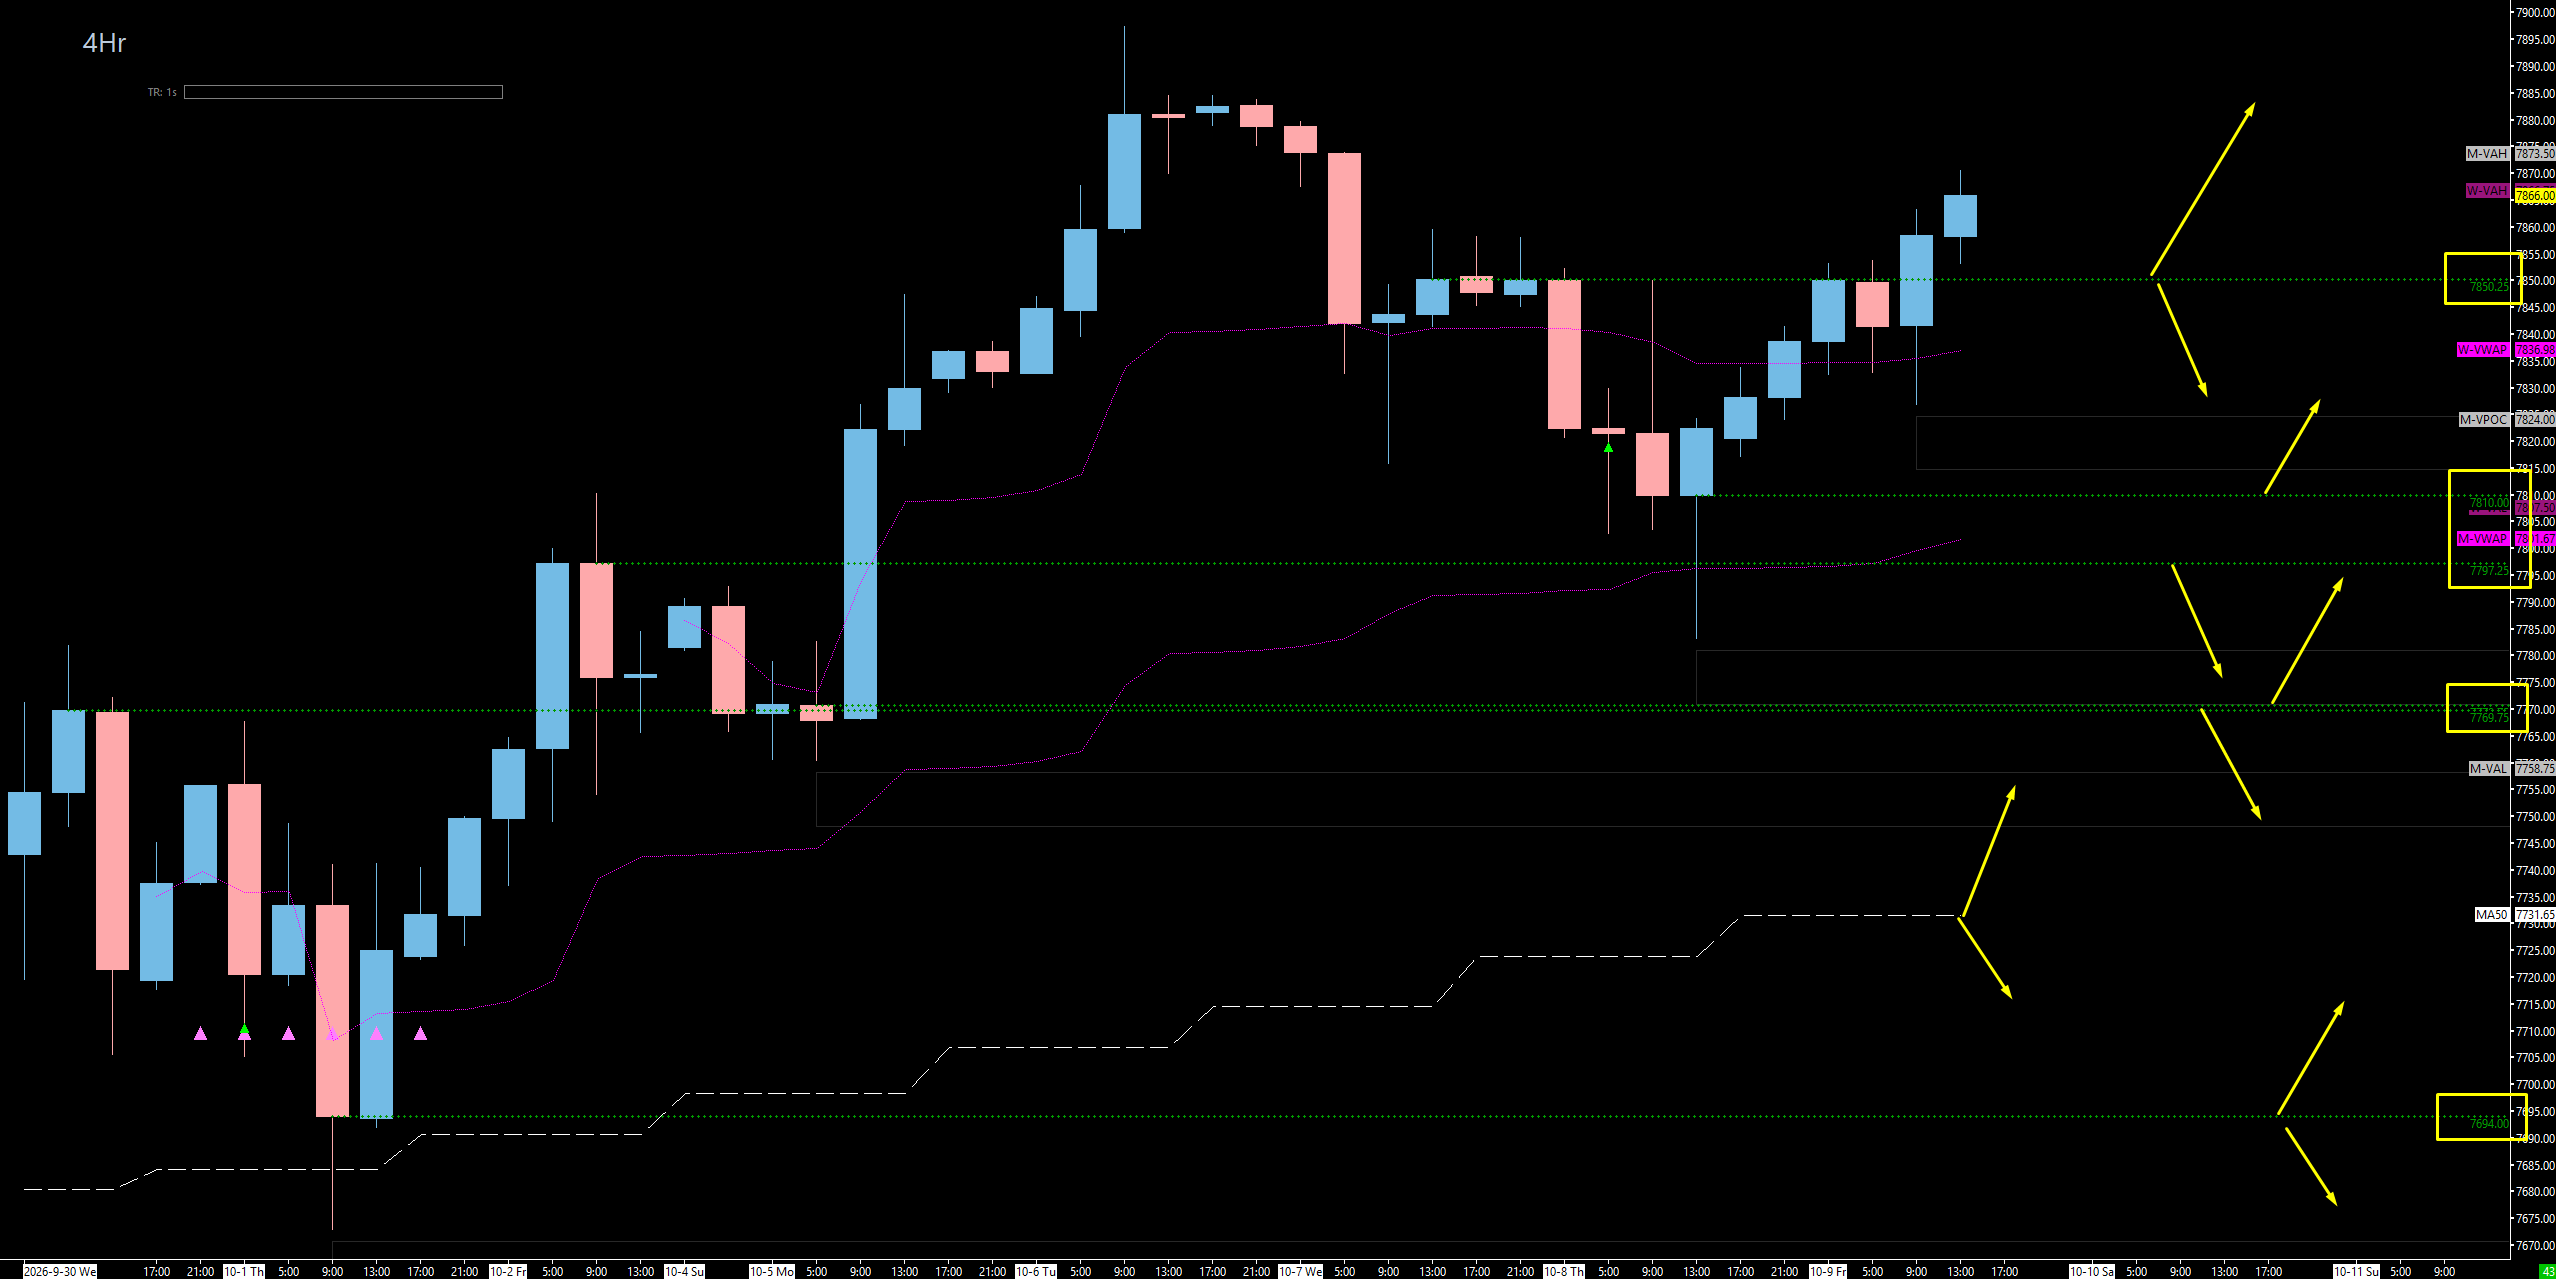
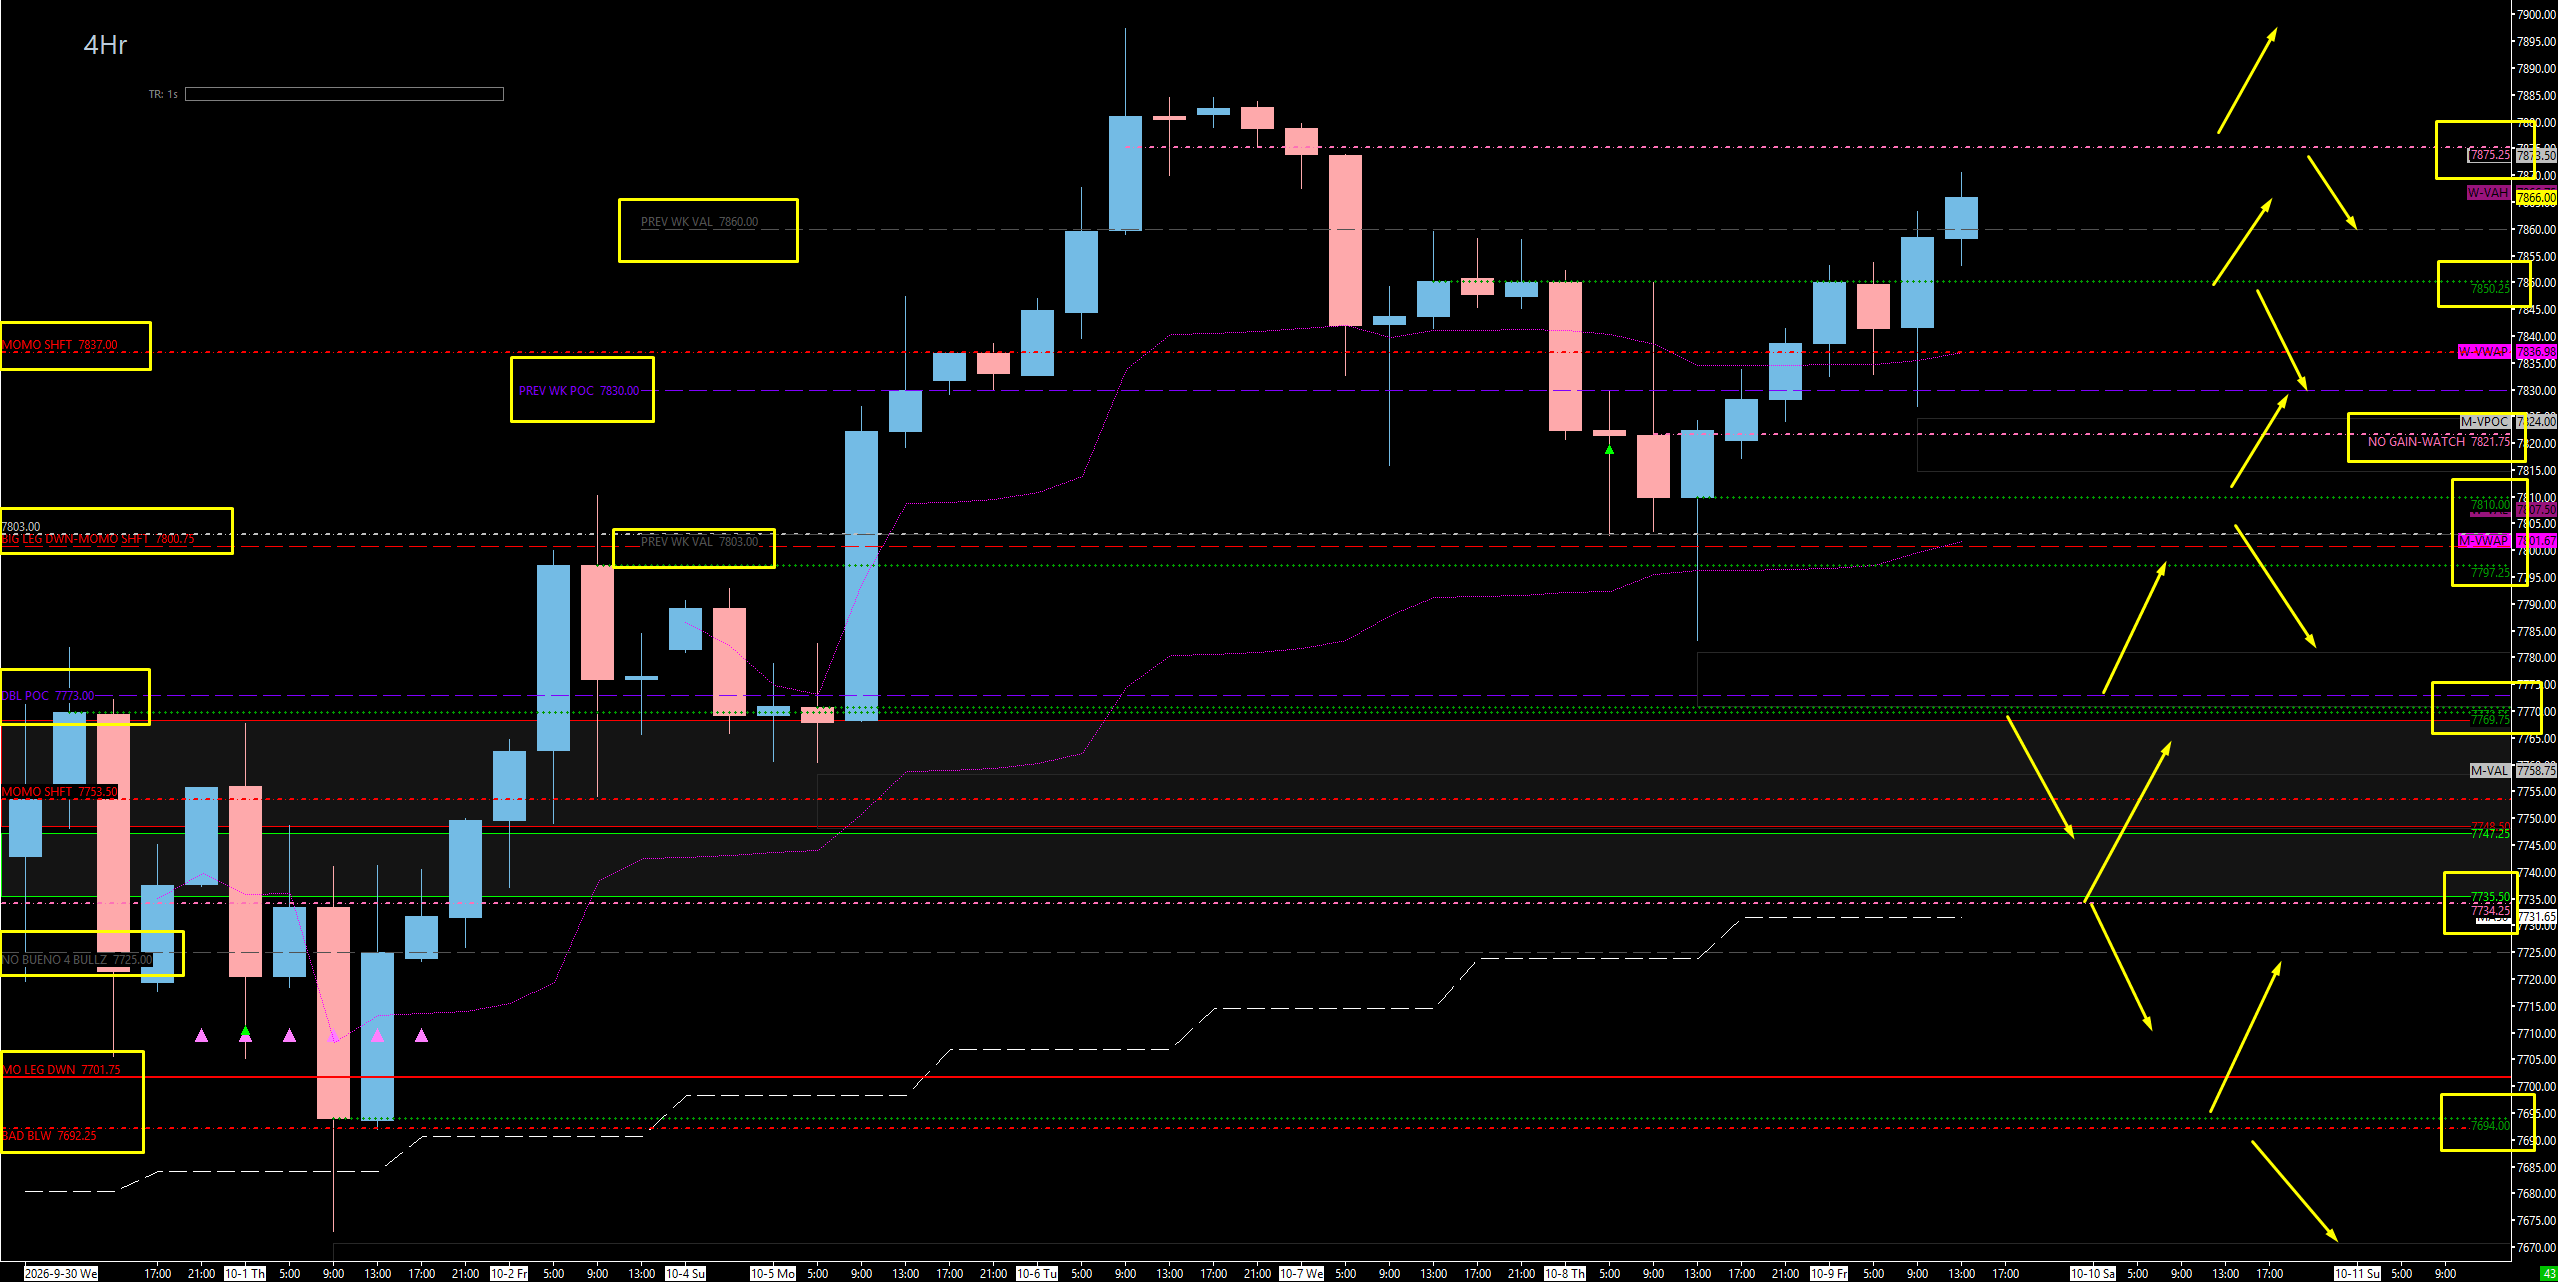
Up on all timeframes, so we are looking to buy — but the buy spots are limited. 7850.25 has to play and go. Above it we push, and above 7880 — really the 7875 daily, which is still untested resistance — we go to all-time-high price discovery. Close the four-hour below 7850, and really below 7840, and it gets pretty hairy. The big daily pivot is 7837: below it, it looks really bad. The 7810 four-hour is better than the 7821 daily, the 7797.25 is the desperation move, and 7770 is the untested four-hour leg to the high with 30,000 stuck sellers above it. Under all of that, 7734.25 with the 50-day moving average is the last big make-or-break.
🔴 Key Resistance Zones & Setups
The Go Line — Untested Daily: 7860.00 - 7880.00
7880.00 (Four-Hour Go Line), 7875.00 (Untested Daily — Same As SPX 7818), 7860.00 (Weekly TPO Bullish Lean), plus a naked point of control nearby.
Context: We have the big 7875 daily that nearly got missed on Friday — it is going to be our big pivot, and it is the same one as SPX 7818. It is very much untested. On the weekly TPO we lean very bullish above 7860, and since we do not have a four-hour up here, I am using roughly 7880 as the four-hour go line. We also have a naked point of control sitting up here.
Actionable Setup: Above 7875 — call it 7880 from the four-hour — we continue to all-time-high price discovery. But it is also big resistance for us, so watch the first touch. I would have loved a solid daily close above it; until we get one, be careful.
🔵 Key Support Zones & Setups
THE MUST-PLAY — Four-Hour & One-Hour: 7849.00 - 7850.25
7850.25 (Four-Hour), 7849.00 (Tested One-Hour).
Context: From a four-hour perspective, this is a great look. 7850.25 has got to play and go — looks familiar, right? Just like the SPX side. We also have a one-hour sitting right there, and on the one-hour chart it looks beautiful: it played perfectly as support from the left, and I love these top-downs. This one-hour is tested — we have used it multiple times. I think this is going to be a great buy, and they will more than likely do it in the overnight session. This move up did gain support. If they play the daily above and roll over, this four-hour has to hold and then we have to get back above 7850. It is also the high that got smacked when the Trump / Iran news hit, which we brought down into the deep-pocket low we had called.
Actionable Setup: Buy Setup: Play 7850.25 and go. Above 7850 we push; above 7880 we push to the highs.
Warning: If we close the four-hour underneath 7850, and really below 7840, it gets pretty hairy. Keep 7837 and 7849 front and center all week.
The Big Daily Pivot: 7830.00 - 7837.00
7837.00 (Daily — Previous All-Time-High Leg Down), 7830.00 (Daily-Close Line).
Context: 7837 is our big line — the previous all-time-high leg down. Now that we are back above it, guess what? It becomes important once again. Being above or below 37 is major context for whether we keep this progression going to the upside, especially on a daily close.
Actionable Setup: The big pivot shift is 7837. On the high timeframe, a daily below 7830 — if they play the 7821 and the 7830 and come down — means she is in trouble.
Warning: Below 7837, it looks really bad.
The Daily That Did Not Gain: 7821.00 - 7827.50
7827.50 (Reclaim Trigger — The Low), 7821.00 (Daily Leg Up — Technically Untested).
Context: 7821 is a legitimate daily — technically a daily leg up and technically untested — but I do not really like it. My chart literally says “this daily did not gain — watch.” That does not mean it is going to be huge. It means do not get in right away — watch and make sure it is going to play. I want to see us push above and get a nice daily close to play it, or this could potentially roll over.
Actionable Setup: Conditional Long: Be cautious. Let it get above the low around 7827.50 before engaging, take profits at 7837, and look for the reclaim.
The Better Four-Hour: 7810.00
7810.00 (Four-Hour).
Context: Believe it or not, the 7810 four-hour is better than the 7821 daily. I think it could pop us up, but I am not sure it saves it.
Actionable Setup: Buy Setup: I think this pays at least 12 points. Play it for the pop, take profits, and do not expect it to rescue the structure on its own.
The Desperation Move & The Big Weekly: 7797.25 - 7803.00
7803.00 (Previous Weekly Value Area Low), 7800.00 (Big Weekly + Two-Week Composite VAH), 7797.25 (Four-Hour From The Left + One-Hour — Technically Untested).
Context: 7800 is our big weekly and a big momentum shift pivot, and it lines up within three points of the previous weekly value area low at 7803 — plus the two-week composite value area high sits at 7800 exactly. Below it, we start pushing out of the previous value. Right underneath is 7797.25, technically untested — the desperation move: the one-hour, the lowest spot, and actually a four-hour from the left.
Actionable Setup: Conditional Long: It could play, it could do one of those numbers — we will see. But if we have come all the way down here, I am going to be really nervous about buying it.
The Untested Four-Hour Leg & The Red Block: 7770.00
7770.00 (Untested Four-Hour Leg To The High), plus the double point of control and the TPO red block — 30,000+ stuck sellers.
Context: 7770 is still available — we have not played it yet, and I was looking for it last week. It is definitely untested. It lines up with the double point of control, and it sits in that big red block from the weekly TPO — the same setup that played a couple of weeks back. Look at the absorption down here: over 30,000 contracts of sellers got stuck right here. You think this area is not going to get a reaction? Think again. Directly below, a massive amount of buyers — a clear division of buyers and sellers.
Actionable Setup: Buy Setup: We want to see 7770 play and get back above Thursday’s low before we get too excited, and ultimately get back above 7800 before we really get going. At a very minimum, I think 7770 to 7797 to 7800 plays for 30 points — a nice area to get long and play that scalp situation.
THE DO-OR-DIE — Green Block & 50-Day: 7725.00 - 7734.25
7734.25 (Daily — Massive Shoulder), 7725.00 (Two-Week Composite Value Area Low), plus the 50-Day Moving Average and the TPO green block.
Context: This is the big spot I showed you on SPX — the must-do. Do or die, got to hold. The 7734.25 daily with the 50-day moving average right there, a massive shoulder, sitting in the green block from the weekly TPO. This is a badass spot — I like it a lot. This is lay-into-it, make-your-month type of spot. But it is also the only spot.
Actionable Setup: Buy Setup: Either this holds at 7734.25 and we make new all-time highs, or we push below it and come down much farther. We will know immediately — this is going to be awesome or it is not.
Warning: Underneath 7725 — the massive two-week composite value area low — it is no bueno for the bulls. We are super soft down there and could easily come down another 50 to 100 points.
The Last Four-Hour Leg: 7694.00
7694.00 (Four-Hour — Last Lowest Untested).
Context: One final spot all the way down here — the last, lowest untested four-hour leg. Do I think we are coming down here? Not necessarily. But the Weekend Review is for high-timeframe evaluation, so we look 100 to 200 points up and down.
Actionable Setup: Below 7734.25 we are in big-time trouble. There is a lot of high-timeframe static support down here that could hold and bounce around, and this is the last untested level in it.
📌 Cheat Sheet – Key Levels Recap
🧠 Final Thoughts
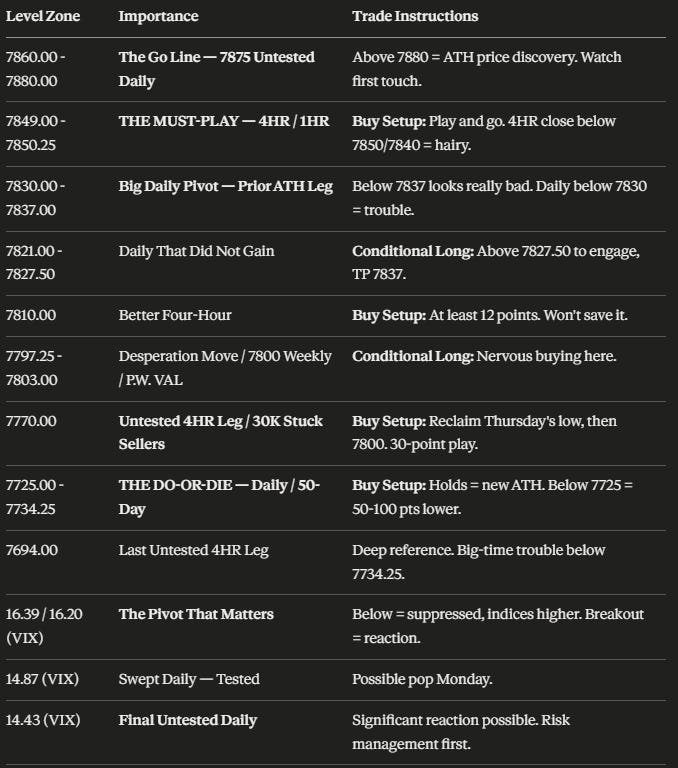
Here is the whole thing in one breath. We are up on all timeframes and looking to buy — but we have limited buy spots. Did you hear that? They are limited, but they are high quality, which means we have a few real opportunities this week to make some money. On ES, 7850.25 has to play and go; above 7880 we head to all-time-high price discovery, and the 7875 daily is the resistance to respect on the way. Close the four-hour below 7850 — really below 7840 — and it gets hairy, and below 7837 it looks really bad. From there, the 7821 daily is iffy, the 7810 four-hour is better, 7797.25 is the desperation move, and 7770 — with 30,000 stuck sellers right above it — is a clean 30-point scalp setup. Underneath it all, 7734.25 with the 50-day moving average is the do-or-die: it holds and we make new all-time highs, or we push below 7725 and come down another 50 to 100 points. On SPX, mirror it: 7798 is the first buy and where things start to shift, and 7765 - 7770 with the 7766.99 shoulder is the last do-or-die spot.
Keep VIX front and center. We have a big buy spot on VIX below at 14.43, and you have seen this story so many times — when VIX gets this low, we get a pop, and it can send the indices down. Honestly, those little pullbacks are welcome for us. We are up on our timeframes and looking to buy, so give us something to play. As long as VIX stays below 16.39, the wind stays at our backs.
Thank you again for joining me. I wish you all an amazing and blessed week — I know we in the Inner Circle are going to have one. And if you are a Trade Plan subscriber and you are not in the Inner Circle, shoot me a DM and I will get you in there. I know you are going to love it. Have a great Sunday, and I will update you as the trade plans come out. Next week, we conquer the markets. Cheers.
Until next time—trade smart, stay prepared, and together we will conquer these markets!
Ryan Bailey, VICI Trading Solutions.
📊 Indicator String
Copy and paste the levels below into your S&P Edge Levels indicator to automatically plot today’s key levels on your chart:
7875.00|D|D
7850.25|4HR|4H
7837.00|D|D
7821.00|D|D
7810.00|4HR|4H
7803.00|P.W. VAL|GD
7800.00|WK|W
7797.25|4HR|4H
7770.00|4HR|4H
7734.25|D|D
7694.00|4HR|4H


