

Welcome back, everyone. I am Ryan the Conqueror, and I am here for another amazing edition of the Weekend Review so that you and I can absolutely conquer the market this week. We had an awesome week last week — really, everything went exactly to plan, not only in the plan itself but in the way we talked about it in the post-market breakdown. We had that massive spike up on Tuesday, and a lot of people thought we were going to sell right back off; they were talking blow-off tops and everything else. We predicted that would more than likely not happen, using SPX, VIX, and just plain common market knowledge and experience to determine exactly what was going to unfold. Then Friday they had an opportunity to make a big move with the NFP, and they did not do much at all. It was a little disappointing — I expected a massive move and we did not get it.
So today we are going to look at exactly what we need to anticipate this week. Here is the setup in one sentence: we have a ton of inefficiencies below us, one buy level, and one kind of resistance level. I say “kind of” because we are still in an uptrend, so I look at it as a little head-bump location — but it could potentially be a big make-it-or-break-it for us. Let’s get to the levels as usual: VIX, then SPX, and we will finish it off with ES.
☕ FREE RESOURCE — The SPX Morning Brief | Delivered 5:45 AM EST Take advantage of this. Every morning at 5:45 AM EST, the SPX Morning Brief hits your inbox with everything you need to understand the significant value levels on SPX, over 150 indicator prediction assessments, and the top 5 news articles of the day. It is a fast read that gets you fully prepared well before the bell. It is free — all I ask is that you let me into your inbox. Sign up now → https://pages.vicitradingsolutions.com/spx-edge
A Note on This Week’s Market:
News: They had their chance on Friday with the NFP and did essentially nothing with it, which was disappointing — I expected a massive move. Nothing specific is flagged on the radar heading into this week, but with the structure this coiled and VIX this low, monitor the open.
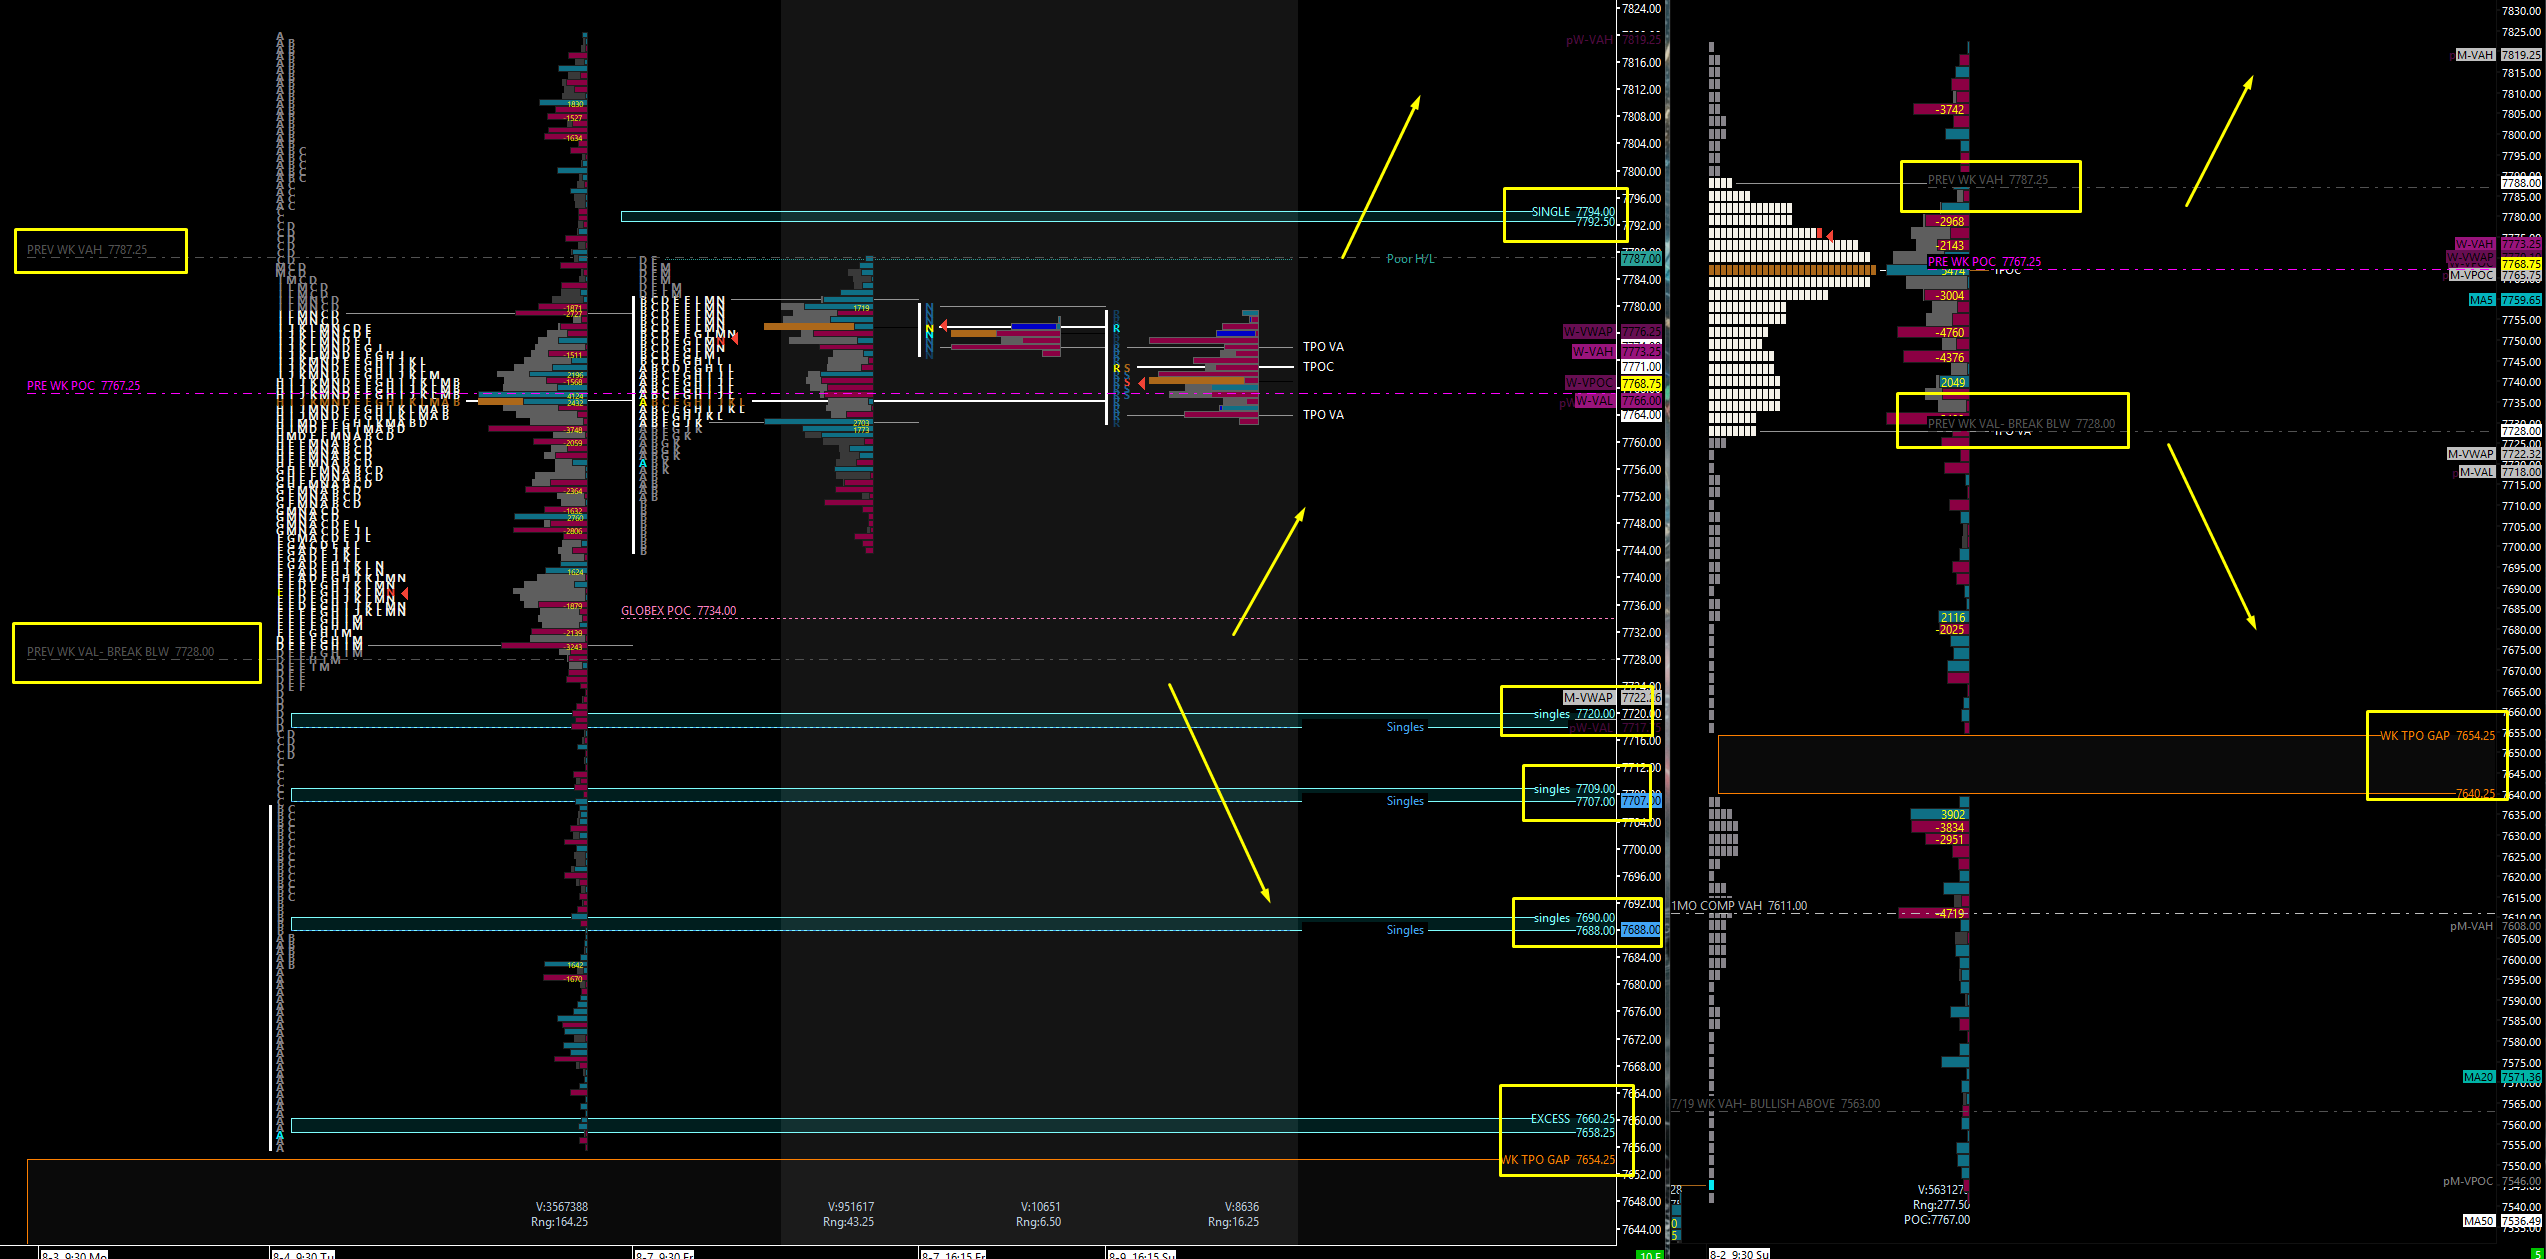
Volume: That massive push up last Tuesday was extremely thin. We created no support whatsoever on the way up, leaving singles all the way down the profile, a TPO gap from Tuesday running to 7640, and excess in the profile down to 7658 with the gap directly below from 7654 to 7640. These are big inefficiency areas that will more than likely get cleaned up — there is no saying when, but it certainly will happen.
Range: We have been balancing at all-time highs for about a week, sitting up here for three days as price accepts value in this range. We will more than likely continue to do so as we figure out whether we accept range and push higher, or whether we are ultimately distributing to come down lower. We are still sitting directly at last week’s point of control.
Volatility: VIX is way down in the $15 handle, and that is indeed kind of an issue for me. A 20% spike from here is only $3 — it would only send VIX up to about $18-19, which still keeps VIX relatively suppressed, but a 20% pop in VIX would send the indices down meaningfully. So my antennas are up, even if my horns are not.
Trend: Up on all timeframes — we have not lost on any timeframe. Our process tells us right now that we are looking for longs only, not shorts, and we have to assume that is still logical given we are trending up and opened at all-time highs. We are still in buy-the-dip mode, no question about it.
🧠 Current Market Context
Balancing At The Highs: One Support, One Resistance, And A Profile Full Of Holes
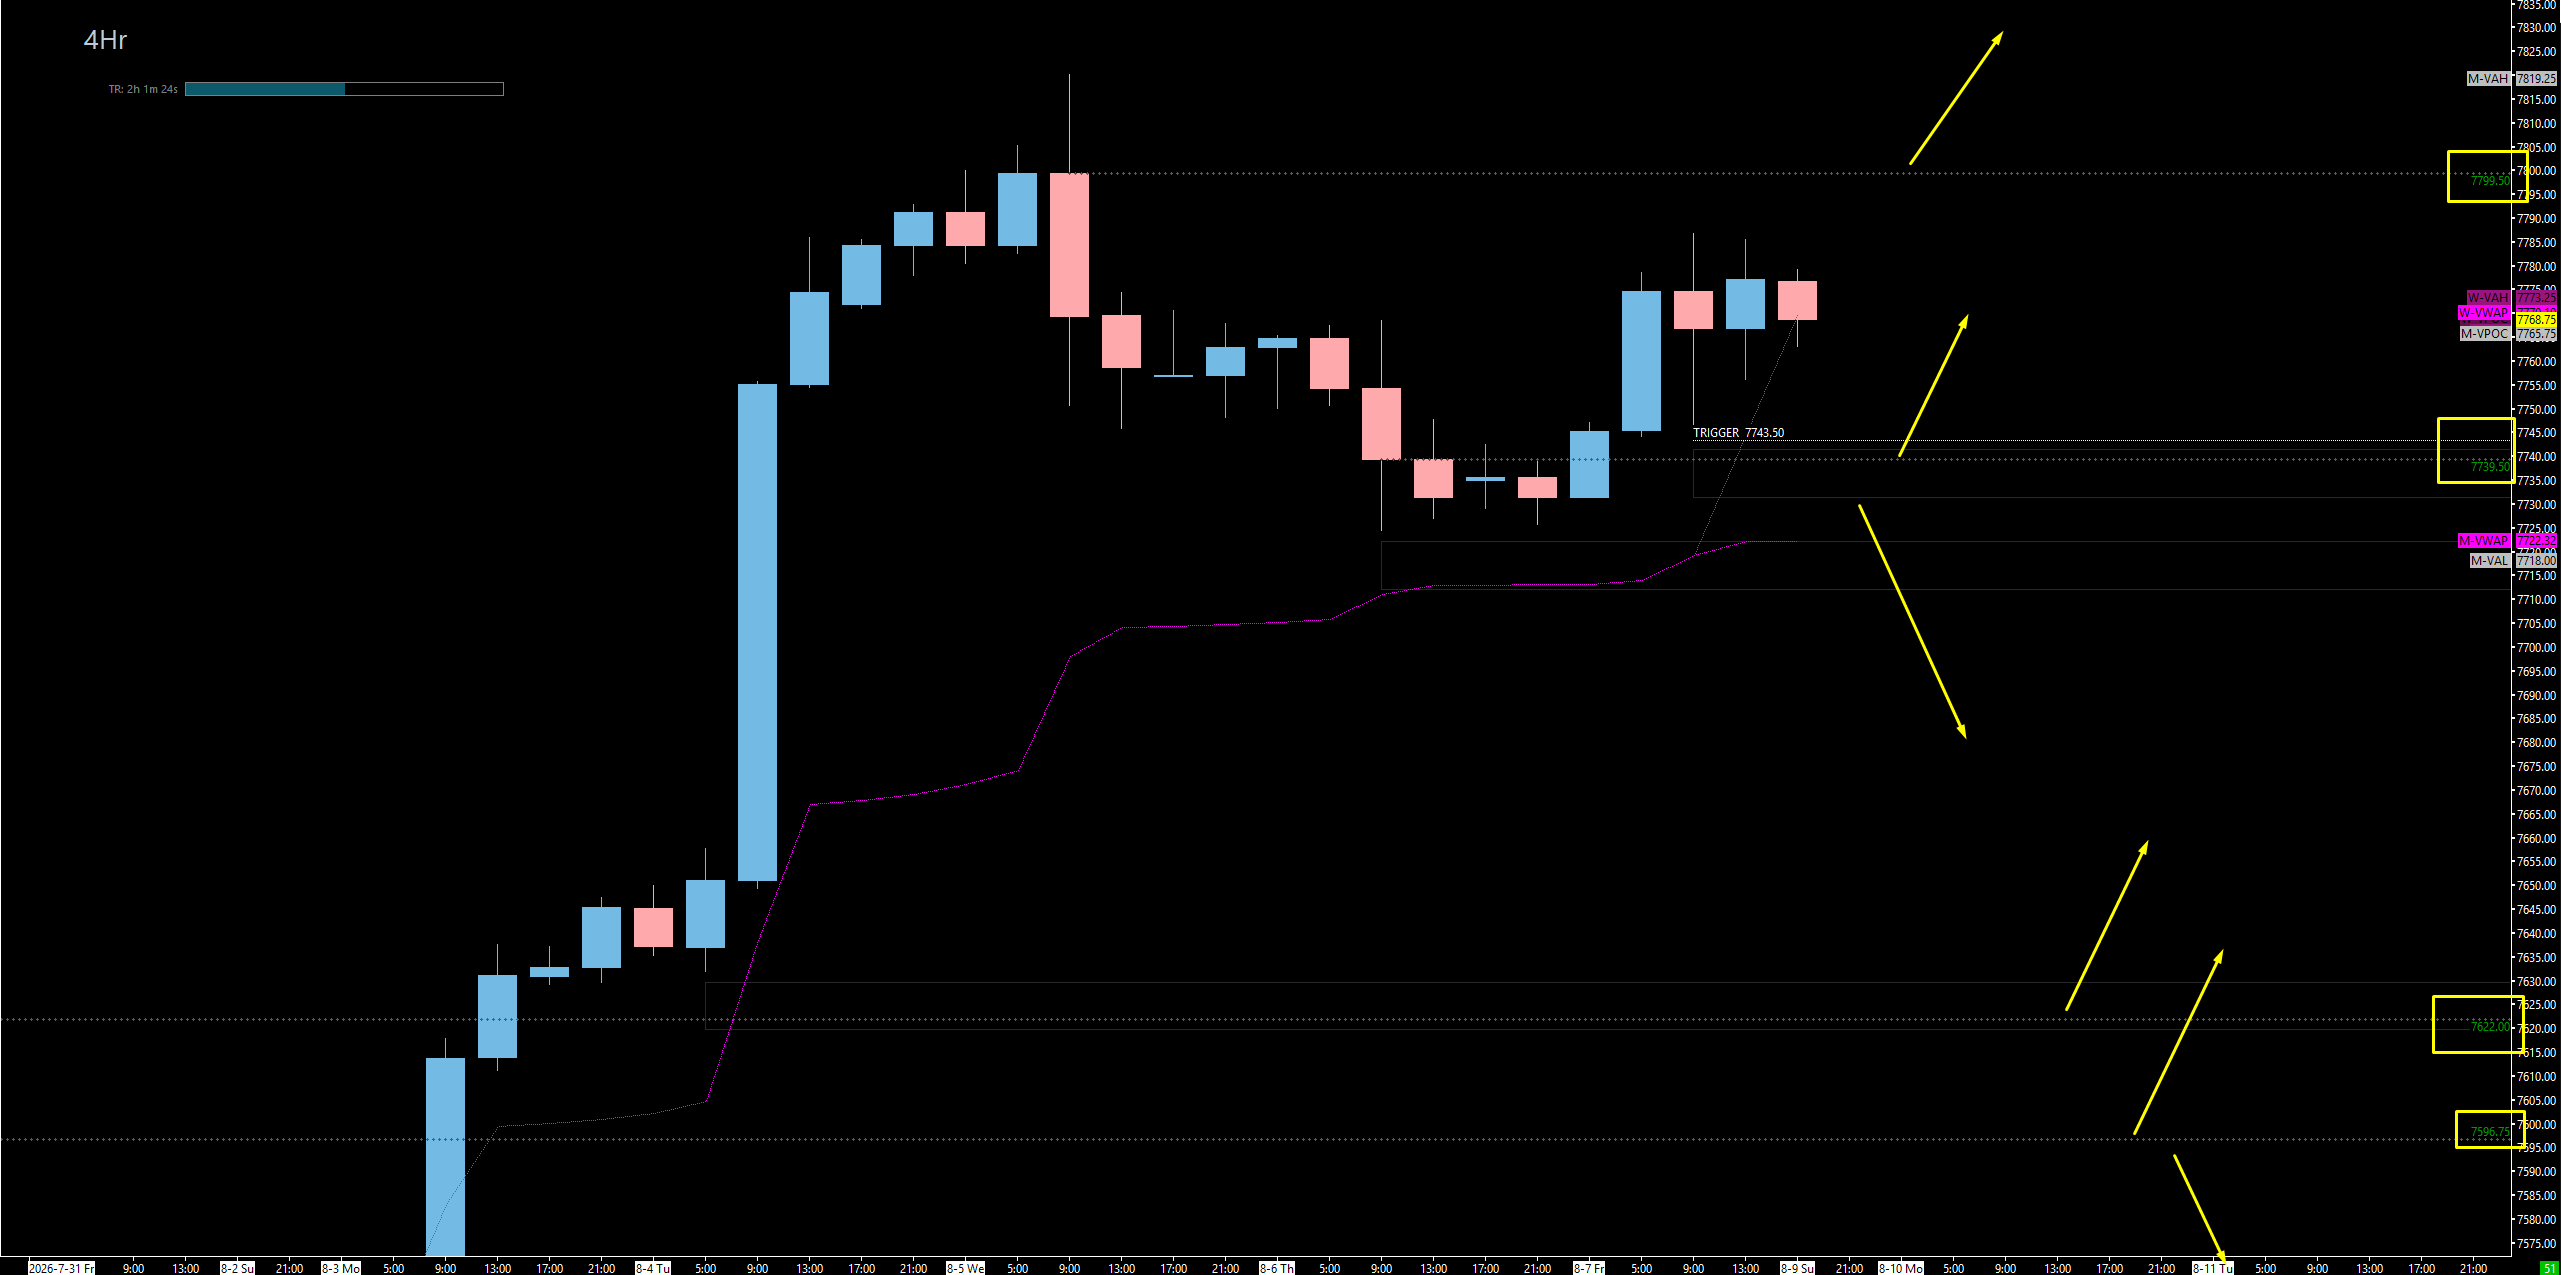
It really is just this clear, and it is very defined right now because we have been balancing up at the all-time highs for a week. We know we have very limited support, and we know we have basically no resistance except for one spot. So one of two things is going to happen: we play the only support we have, we head bump the resistance, and we make new all-time highs — or we get smacked from the high at that daily/four-hour I am going to show you, and we come on down and clean up some of these inefficiencies. That is the entire week in a nutshell.
On the ES weekly profile, the Previous Weekly Value Area High is at 7787, which is a really good indicator: if we stay above this, we could push higher. The critical number, though, is the Previous Weekly Value Area Low at 7728 — that appears to be a massive downside break for us. Remember how we talked about 7700 on SPX? On ES it is very similar, but our number is now 7728. Below it, look at all the inefficiency in there — we are very thin, we have singles all the way down, and there is a TPO gap from Tuesday that brings us all the way to 7640. If we do end up pushing below 7728, we could come down quite nice. But the same thing applies here as always: we can also sweep 7728 and reclaim.
On SPX, we have had this massive push up and we are now balancing at all-time highs. Either way we look at it, we have one minor resistance area: the daily at 7771. This is going to be a massive make-it-or-break-it for us — we either just bump our head on it a little bit and continue higher, or this actually could send us down quite significantly. We were looking for this spot to get played on Friday; it was the gap fill for SPX on the cash session from Thursday, it is also a four-hour, and I still think it could play. But please keep in mind, we are up on all timeframes — so these are simply targets, not short areas. We just need to be careful and stay prepared in that sense. If we push above 7771, we continue back through all-time highs and go right back into price discovery mode.
On the SPX support side, my main area of interest is basically 7609 through 7500, and underneath 7700 we will more than likely come visit that area and clean all of it up. Our only big major level — the same spot as ES — is 7709, which could pull back nice, give us a nice-looking W, and potentially pop us back higher. That is my big major buy location. Other than that, a potential sweep underneath 7700 and a reclaim could get the job done as well. But if they cannot get the reclaim done, remember: that massive push up last Tuesday created no support in there whatsoever, so they could drift all the way down, fill the gap left on Tuesday, and play the daily at 7609.78 — and I do really like this daily a lot. I would look for it to play, then get back up and fill that area for our first target of about 20 points at 7630, and then ultimately look for a squeeze much higher back to the 7700 area. If it goes lower than that, we get down into two areas I really like, and my main one is 7580 / 7572 — this is the weekly/daily combo, and I really like it. If it is not the 7709, I do think the 7580 / 7572 area could get the job done, and that is our best chance to keep momentum moving to the upside. Below that, we have a big weekly at 7516 that would be our first spot for a pop — but the issue is that we get pulled back into the massive balance range, and if they cannot get back through that massive support (which becomes resistance once we are underneath it), we could get sucked all the way back in.
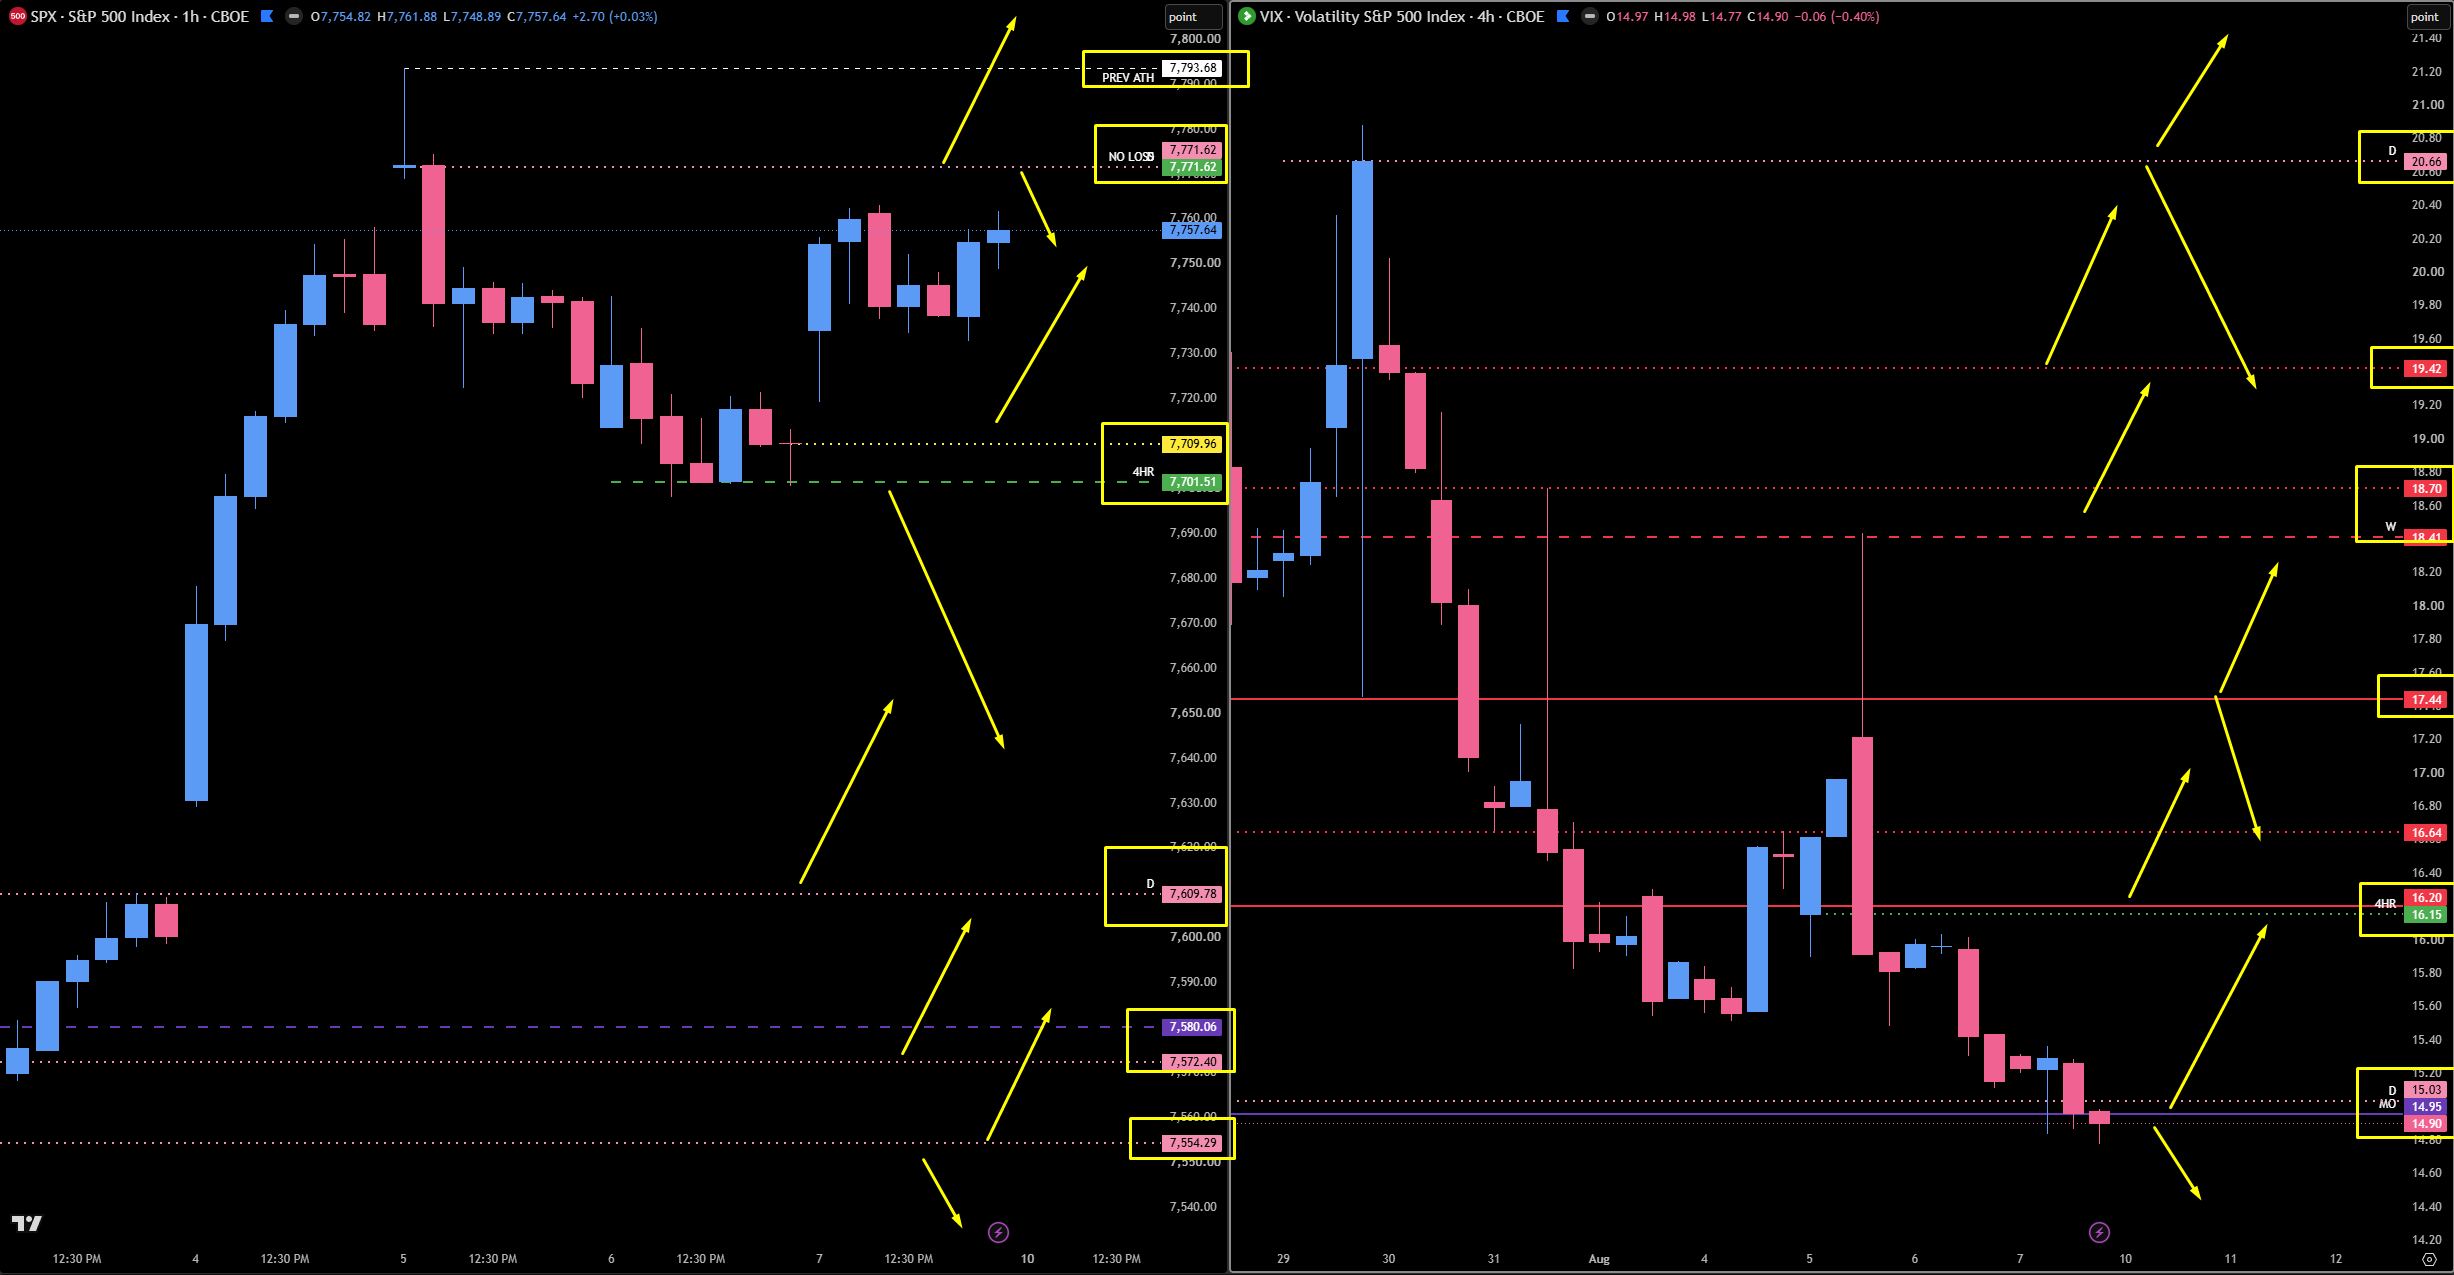
🚨 VIX Analysis: The 15.03 Floor & The 20% Spike Risk
We are way down here on VIX, and this is really a big pivot for us to keep in tune with. I know it seems like we are very far away from the important levels right now, but I am pointing them out for a reason.
The Floor — Watch This Closely: 15.03 and 14.95. Keep an eye on this $15 handle — let’s just call it our big floor. Every time we get into the $14 or $15 handle, we get a reactionary pop. We did not get a reaction from it on Friday and we are still balancing up here at the highs, but I suggest everyone keep an eye on these lower levels: we do not come down here too often, and when we do, we do not stay down here very often. We continue to get pops from this area, which leads me to believe it will happen sooner rather than later. My assumption is we will not stay down here too awful long.
The Midpoint Pivot: 16.20. This is kind of our midpoint pivot right now. We are not really feeling too much pressure when we go over it, but it is certainly where it starts. Keep an eye on above/below here.
The Pressure Line: 16.64. When we get above 16.64, that is when we start to get a little pressure on the indices and we see the indices begin to stall on the way up.
The Big One: 17.44. Once we move over 17.44, we get some serious headwind, and that is where things start to really go bad for the bulls and the indices — that is where the suppression begins. As long as we stay below it, the indices stay fairly bullish.
The Tested Stack & The Only Untested: 18.41, 18.70, and 19.42 (which has been a biggie) are all tested. The only thing left untested is the massive daily up here at 20.66 — and I am telling you this because 20.66 is truly the inception of the move down, which really would be our target if we start to pop. If we start to move down in the indices, we can move down fast and retrace 100-plus points like it is nothing, which would send VIX spiking much higher. Keep an eye on these levels.
🎯 Detailed Actionable Trade Plan (ES Futures)
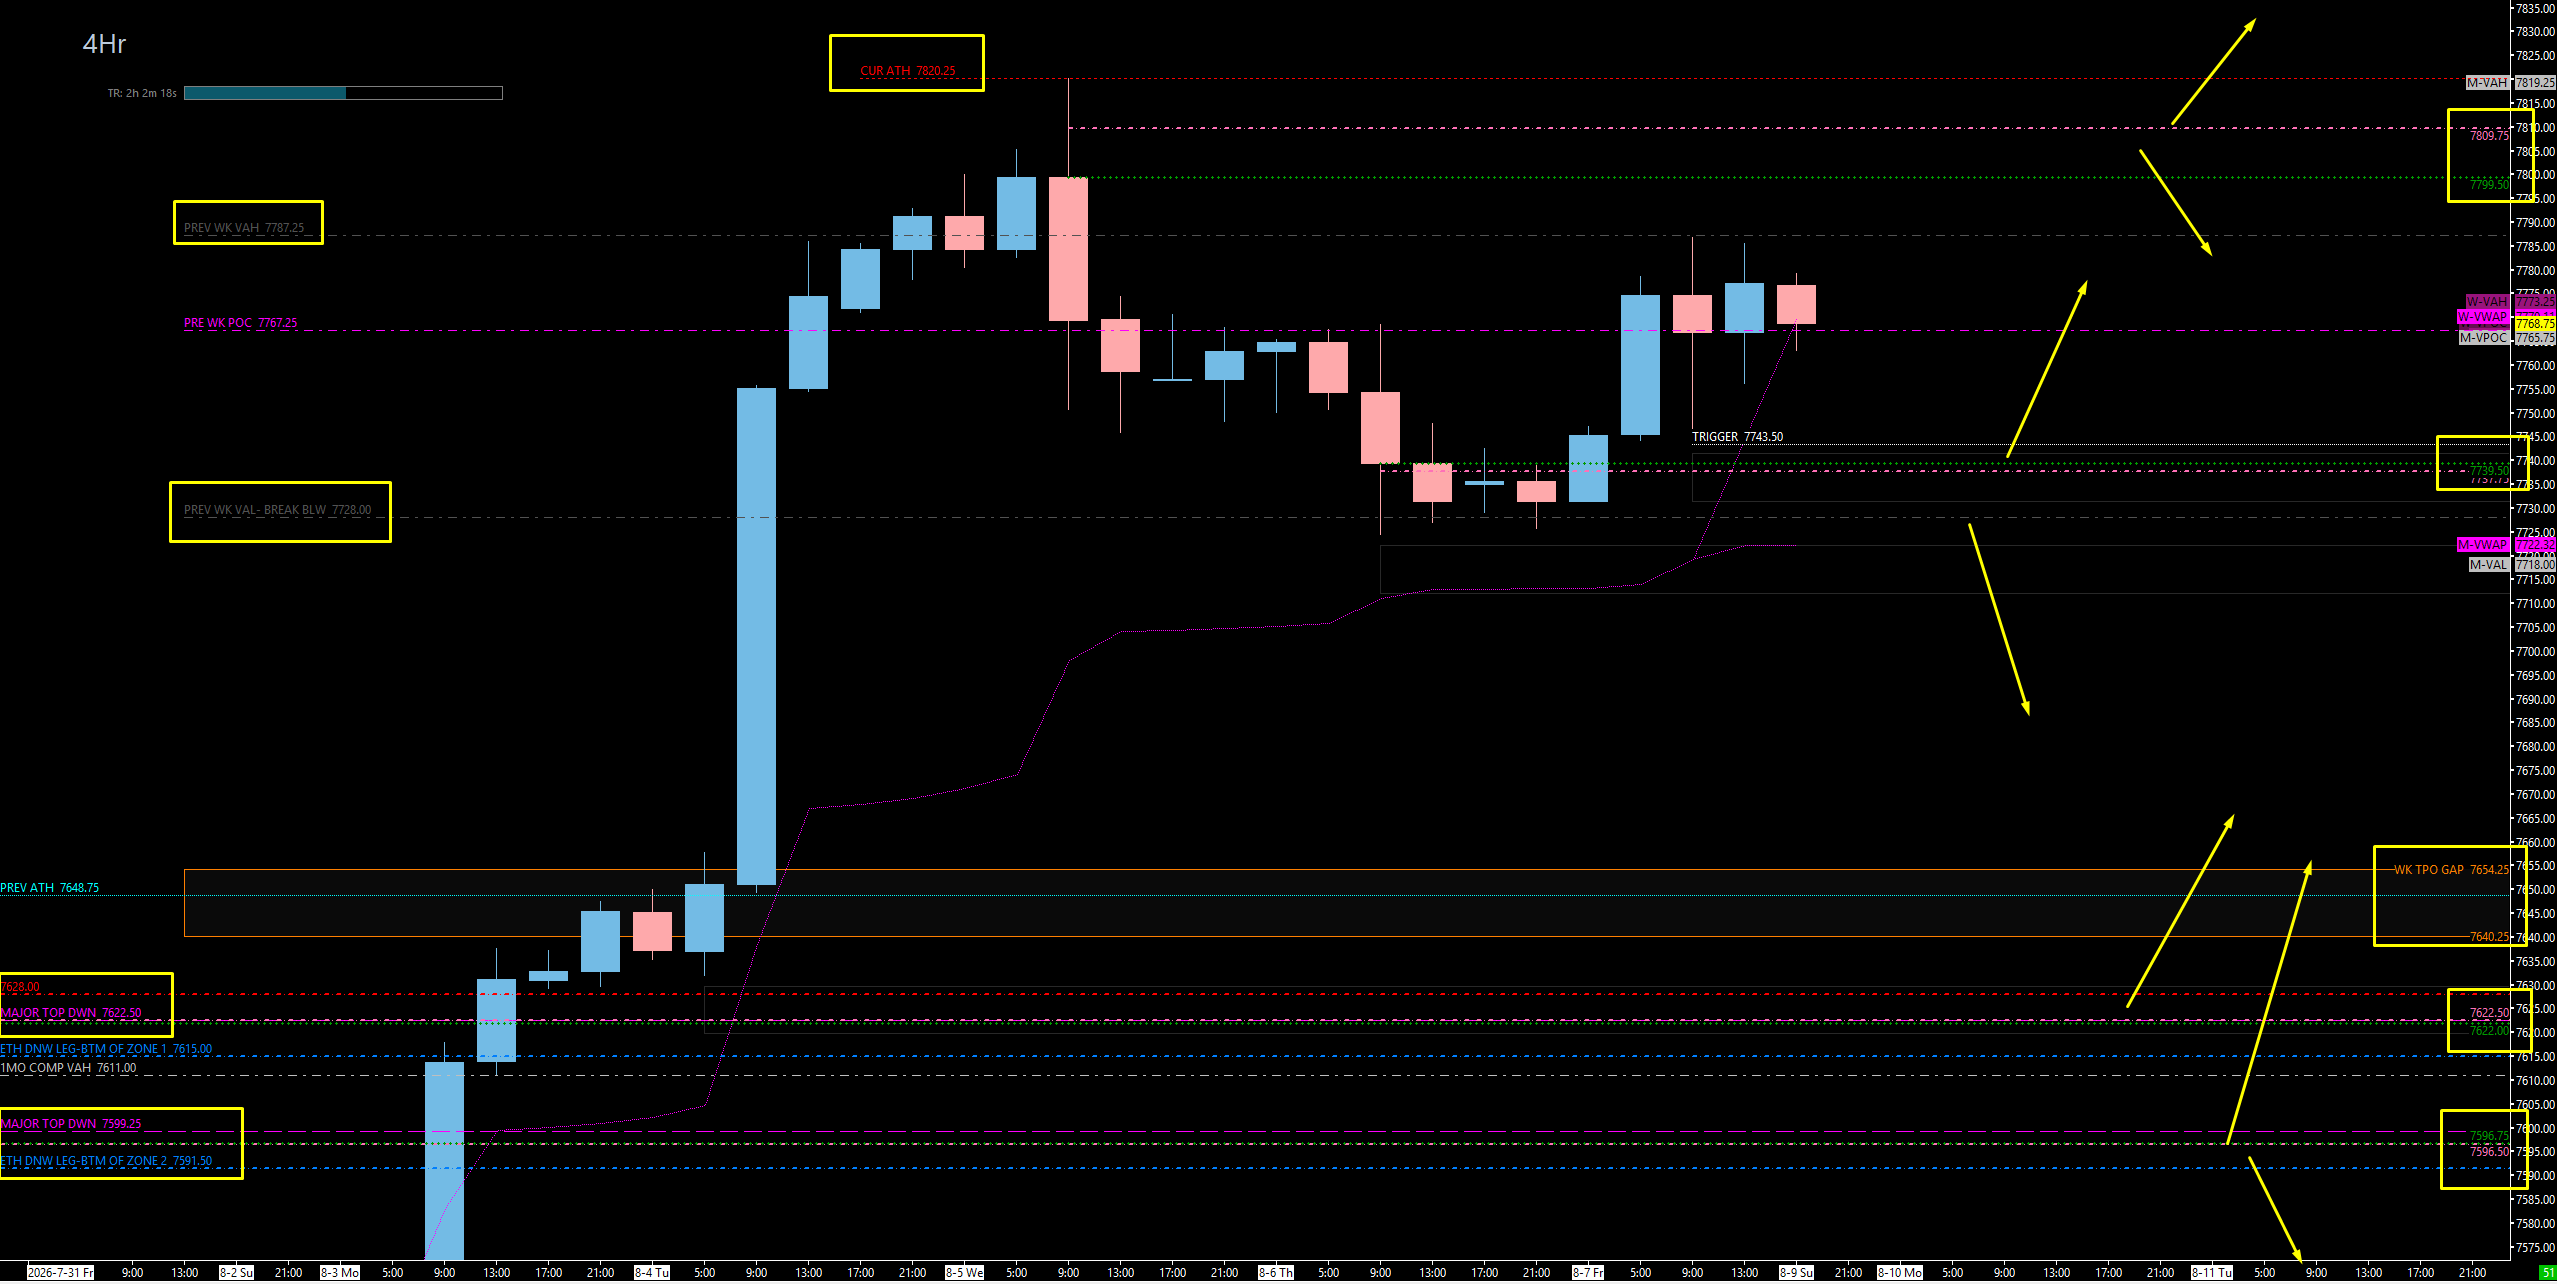
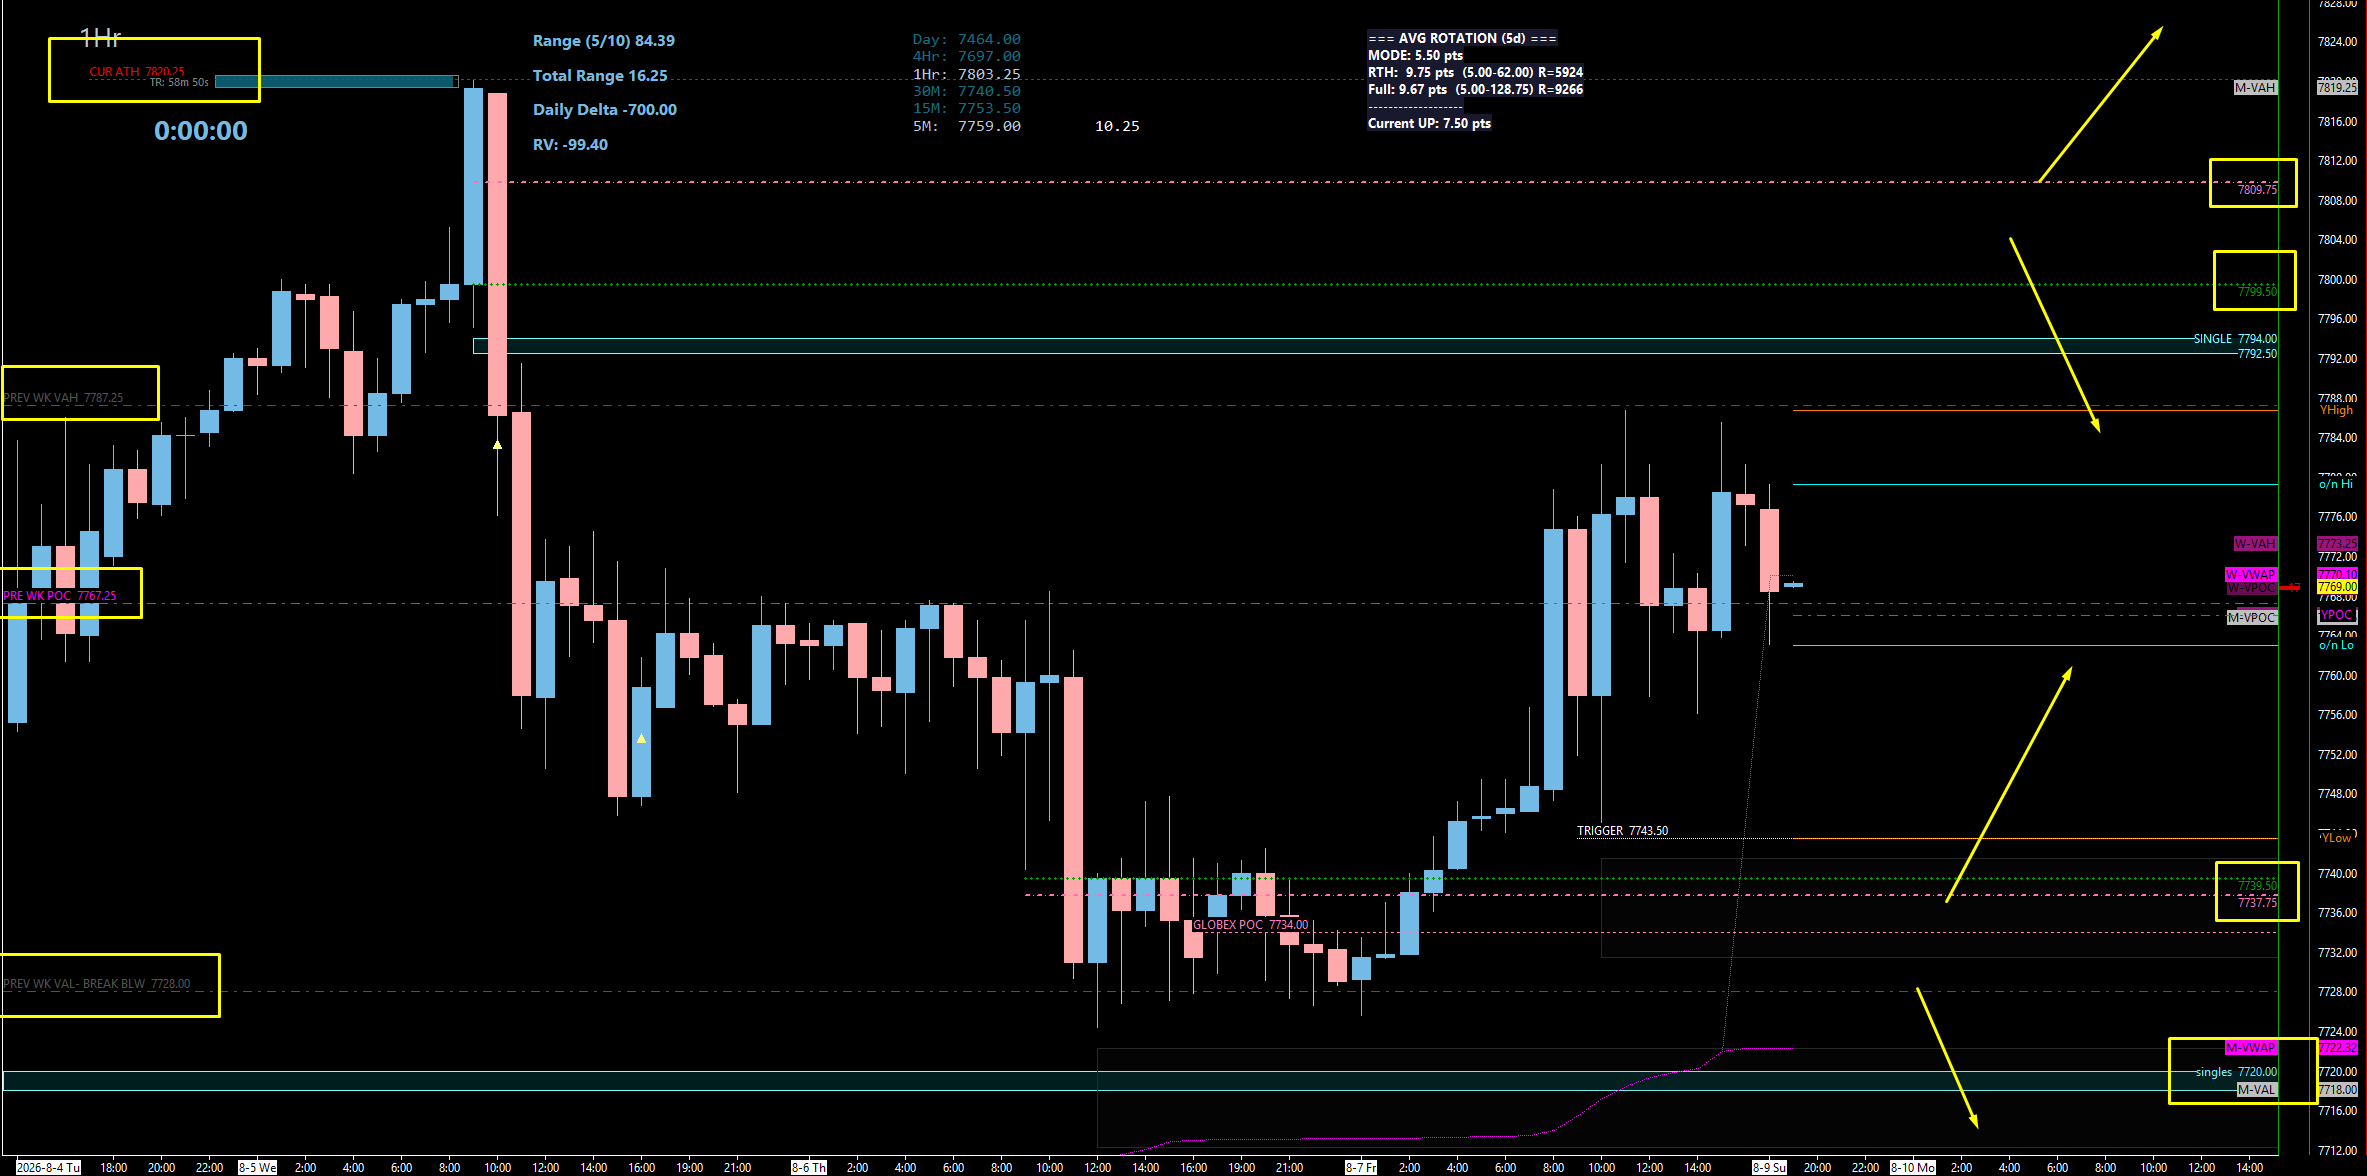
This is about as defined as it gets. We have one buy and one head bump. The buy is the 7737 - 7739.50 daily/four-hour cluster with a trigger at 7743 and a stop under the low; the head bump is the 7799.50 - 7809.75 leg-down resistance, with the 7787 Previous Weekly VAH as the first profit-taking marker on the way up. 7728 — the Previous Weekly Value Area Low — is where things start to look pretty ugly, and below it the profile is full of inefficiencies to clean up. If we do come down, my two excellent buys are the 7622 and 7596.50 / 7599 zones, where weekly, daily, and four-hour levels are all laying on top of each other. Our process says longs only, not shorts — but if price fails and breaks below 7737, we know we need to get short at least underneath the 7725 area.
🔴 Key Resistance Zones & Setups
The Previous Weekly VAH — First Profit Target: 7787.00
7787.00 (Previous Weekly Value Area High).
Context: The Previous Weekly Value Area High at 7787 is a really good indicator for us: if we stay above this level, we could push higher. We are still sitting directly at last week’s point of control right now, so this sits just overhead as the first structural marker on any push up.
Actionable Setup: On the long from below, this is a strong profit-taking area — I would take some at the weekly point of control and then at this previous week’s value area high. Holding above 7787 keeps the upside path clean toward the leg-down resistance above.
The Only Resistance — The Leg Down: 7799.50 - 7809.75
7809.75 (Daily — The Leg Down), 7799.50 (Four-Hour Leg Down).
Context: This is the one resistance spot on the entire board, and it is the same location as the SPX 7771 daily/four-hour. The 7809.75 daily is our leg down, so obviously it is resistance — but keep in mind, we have not lost on any timeframe. So for me, this is a target, not a short area. I think this could play, we come up into it and get a little pullback, and then potentially go higher. That is what my process says we should infer.
Actionable Setup: Take Profits / Head Bump: Ride the long from 7737 up into here and take profits at 7809.75, then potentially look for runners to take you higher. If we push above this area, we continue back through all-time highs and go right back into price discovery mode.
Warning: Just know this could be the high — we do not know. Especially with VIX as low as it is, we know that at some point we will sell off and come clean up some of these inefficiencies from the massive push up. My thing is, we do not know when. So be prepared for this exact look: come down, play the level, push up, play this, and that is the high — and it essentially rolls us over. We have seen this look many times before.
🔵 Key Support Zones & Setups
THE ONE BUY — Daily & Four-Hour Cluster: 7737.00 - 7739.50
7739.50 (Four-Hour), 7737.75 (Four-Hour), 7737.00 (Daily — Same As Friday’s).
Context: This is the buy. We have a daily at 7737 that I am looking to for support and a potential long — this was our same one from Friday — and stacked right with it are four-hours at 7739.50 and 7737.75. If it plays and holds, it could potentially send us up to 7809.75.
Actionable Setup: Buy Setup: We want to see price come down, play this cluster, and get back above our trigger at 7743. Our stop goes under the low at that point. Then we want to ride this all the way up, taking profits — I would say the weekly point of control is a good one, then the previous week’s value area high at 7787, then the four-hour leg down at 7799.50, and finally the daily at 7809.75.
Warning: Underneath 7737 — and as we know it is actually 7728, our value area low — that is where things start to look pretty ugly.
The Value Area Low — Where It Gets Ugly: 7728.00
7728.00 (Previous Weekly Value Area Low — The Massive Downside Break).
Context: This appears to be a massive downside break for us. We talked about 7700 on SPX; on ES the number is 7728. Below it, the profile is a mess — very thin, singles all the way down, and a TPO gap from Tuesday running to 7640. If we push below 7728, we could come down quite nice.
Actionable Setup: Sweep Setup: The same thing applies here as always — we can sweep 7728 and reclaim, which would keep the bullish structure intact and set up a squeeze back into the resistance above. Watch for the sweep-and-reclaim before assuming the break is real.
Warning: If price fails and breaks below 7737, we know we need to get short at least underneath the 7725 area to come down and clean up some of those inefficiencies I showed in the profile, targeting them as we move lower.
The Excess & TPO Gap Fill: 7640.00 - 7658.00
7658.00 (Profile Excess), 7654.00 - 7640.00 (The Gap).
Context: We have excess in the profile that runs all the way down to 7658, and we know we have the gap directly below that from 7654 to 7640. Combined with all the singles on that inefficient profile from Tuesday, these are big inefficiency areas that will more than likely get cleaned up. There is no saying when it is going to happen, but it certainly will happen.
Actionable Setup: These are the downside targets if we lose 7728. Use them as objectives for shorts working down from the value area break, not as places to catch a knife.
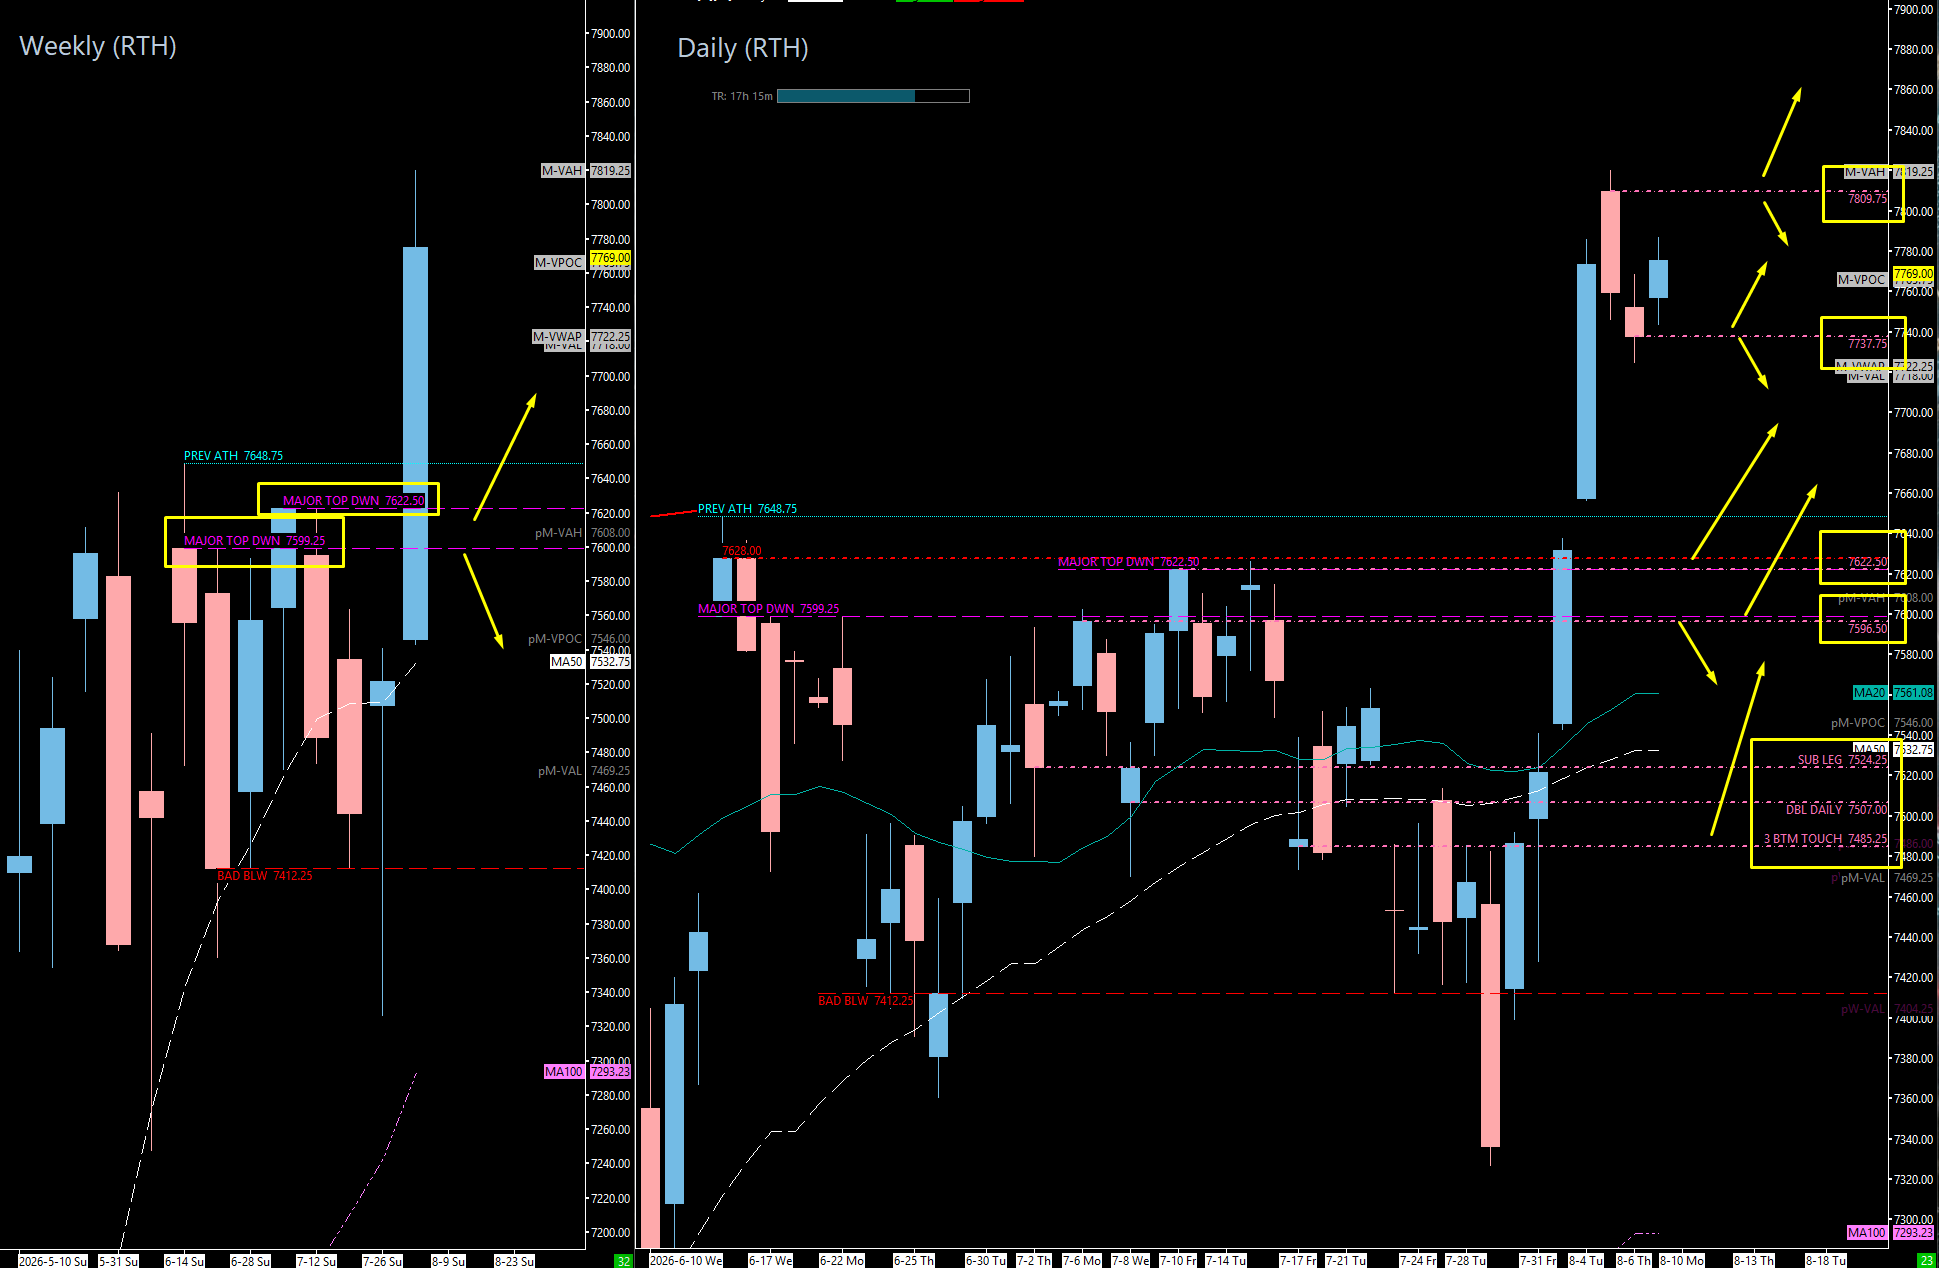
EXCELLENT BUY #1 — Weekly/Daily/4-Hour Stack: 7622.00 - 7622.50
7622.50 (Daily), 7622.00 (Weekly), plus a Four-Hour at the same location and an ETH Daily.
Context: This is a big weekly that I like, and the daily lines up perfectly with it. When I overlay the charts, you can clearly see the weekly is perfectly in line — and we also have a four-hour level located perfectly here. This literally does not get any better in terms of stacking timeframes: weekly, daily, and four-hour all laying on top of each other. And on the ETH side, this cluster has an ETH daily as well, so we have all three timeframes plus ETH confirmation. I am a firm believer that one of these two zones is going to really keep us propped up.
Actionable Setup: Buy Setup: This is one of my two excellent buys on a real pullback. Look for a reaction here and ride it back up. In order to keep this momentum up, we want to see them stay above really 7600 and 7622 to keep this mojo rising.
EXCELLENT BUY #2 — The 7600 Spot: 7596.50 - 7599.00
7599.00 (Weekly — Our 7600 Spot), 7596.50 (Daily), plus a Four-Hour at the same location and an ETH Daily.
Context: This is our 7600 spot that we have talked about for some time — you guys know how crazy the launch was above 7600. The weekly at 7599 and the daily at 7596.50 line up perfectly, with a four-hour right on top of it and an ETH daily in the cluster as well. This looks very similar to SPX, and these are my excellent buys.
Actionable Setup: Buy Setup: Look for this zone to play and hold — it should keep us propped up and send us back higher.
Warning: If we get back below 7596 — really below the 7600 area — just like SPX, we start to end up back in our big rotation and playing supports, and we get stuck once again in that massive eight-week balance we found ourselves in prior. As you guys know, that was a real pain in the ass when we get in there. We really want to stay above here.
The Balance Suck-Back Zone: 7507.00 - 7561.00
7561.00 (Minor Support), 7524.00 - 7507.00 (Stacked Daily & Four-Hour Support).
Context: If we get underneath the 7600 area, we get sucked back into that massive value area where we balance — and again, we have tons of support in there. We have a little bit at 7561, and then in between 7524 and 7507 we have stacked daily and four-hour support as well.
Actionable Setup: It is not that the bulls are completely screwed in this scenario — there is real support here. But if they get underneath 7600, we are just going to come back in here, play supports, and figure out what is going on as we go back and balance.
The Deep Four-Hour Leg: 7483.00 - 7485.00
7485.00 (Daily), 7483.00 (Four-Hour Leg).
Context: All the way down here we have our four-hour leg at 7483 paired with the daily at 7485. This is the deep end of the balance range and the last real structural support in that rotation.
Actionable Setup: Reference support for the full suck-back scenario. If we are down here, we are firmly back inside the eight-week balance and trading it as a range rather than a trend.
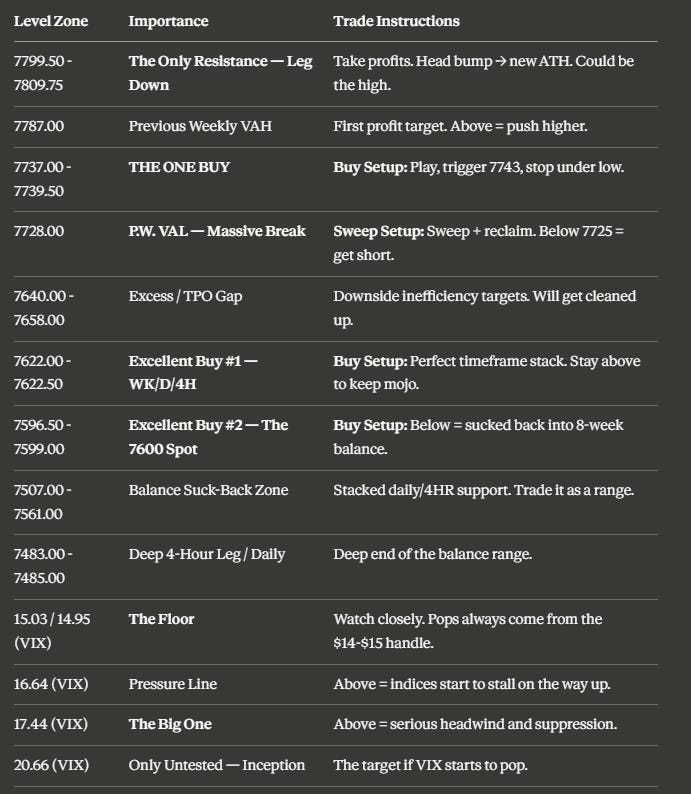
📌 Cheat Sheet – Key Levels Recap
🧠 Final Thoughts
It really is just that clear, and it is very defined right now because we have been balancing up at the all-time highs for a week. We know we have very limited support, and we know we have basically no resistance except for one spot. So one of two things is going to happen: we play the only support we have at 7737, head bump the leg down at 7809.75, and make new all-time highs — or we get smacked from the high and come on down to clean up some inefficiencies. The buy is defined with a trigger at 7743 and a stop under the low. The break level is 7728, our previous weekly value area low, and if price fails below 7737 we get short underneath 7725 and target the excess at 7658 and the gap down to 7640.
And we are still in buy-the-dip mode — no question about it. If we come down, can we come down 100 or 200 points? Yeah, for sure, 100%. And I am not saying you should not try to scalp and make a little money if we get real momentum to the downside and VIX starts spiking — I am absolutely all for that. But just know our process is still very much pointing us to the upside and will be for some time, even if we get a pullback of 100 or 150 points. Our higher timeframe is still looking up. If we do get that flush, my two excellent buys are the 7622 and 7596.50 / 7599 zones, where weekly, daily, four-hour, and even ETH daily levels are all stacked on top of each other — it literally does not get any better than that. Stay above 7600 and 7622 to keep the mojo rising; lose them and we are back in that eight-week balance, which we all remember was a real pain.
The VIX read is what keeps my antennas up. We are down in the $15 handle, and a 20% spike from here is only about $3 — it would barely lift VIX to $18-19 and still leave it suppressed, but it would push the indices down meaningfully. So watch the 15.03 / 14.95 floor, remember the 17.44 line where the real headwind begins, and know that 20.66 is the only untested level above and the true target if VIX starts to pop. As long as VIX stays low and we hold the 7728 area on ES and the 7700 area on SPX, we continue to drift higher. So we default to the process — because you know why? It helps us conquer the market.
I cannot wait to trade with you guys tomorrow in the Inner Circle — this Weekend Review is your plan for Monday, and of course I will get the full trade plan out to you first thing Tuesday morning. Appreciate you all tuning in with me tonight. Please enjoy the rest of your Sunday — I am going to take the wifey to dinner, since she has had me in the yard all day, so now I get to go munch. You guys have a great one, and tomorrow is another day.
Until next time—trade smart, stay prepared, and together we will conquer these markets!
Ryan Bailey, VICI Trading Solutions.
📊 TradingView Indicator String
Copy and paste the levels below into your S&P Edge Levels indicator to automatically plot today’s key levels on your chart:
7809.75|D|D
7799.50|4HR|4H
7787.00|P.W. VAH|GD
7739.50|4HR|4H
7737.75|4HR|4H
7737.00|D|D
7728.00|P.W. VAL|GD
7622.50|D|D
7622.00|WK|W
7599.00|WK|W
7596.50|D|D
7485.00|D|D
7483.00|4HR|4H


