

Welcome back everyone, and happy Weekend Review. First off, my apologies on the delay on this video — I finished it this morning, went to publish, listened to it first, and realized my microphone was off. Let me tell you the disappointment. Second time’s a charm, so here it is.
And guys, once again, I am so excited to talk about what happened last week. We had a record-breaking week from the Inner Circle — we put up more numbers in one day than we ever have in the existence of the Inner Circle. This was Tuesday: the usual suspects on the board, plus more, and we did over $100,000 on Tuesday as a community — and I was the low guy on the totem pole. I could not be more proud of what this is doing for individuals and the way the team is carrying their own. People in our room are taking this seriously, focusing, being patient, and making it count — and the P&L is absolutely showing it. Let’s get into VIX, SPX, and of course ES, the symbol of the day.

🎓 WEBINAR — How to Trade the Trade Plan | This Thursday This one is crucial for anyone following the trade plans. On Thursday I am running our big How to Trade the Trade Plan webinar, where I go over every single step of the trade plan line by line — the important areas you need to look at, how to ingest all of that information in about five to seven minutes, exactly how to structure your trade, what the actionable setups mean, and ultimately how to prepare for your day and trade the plan more efficiently. This has helped so many traders and answers a ton of questions. And as usual, I am giving away free prop firm evals — so even if you cannot make it live, sign up anyway and you will be in the roster for the winnings. Register here → https://pages.vicitradingsolutions.com/tradetheplan
A Note on This Week’s Market:
News: No specific Red Tag events flagged heading into the week. It looks like they are trying to do a little something-something at the Sunday open — we closed Friday at 7480 and are currently sitting at 7496 in Globex — so monitor the open carefully.
Structure: We had a massive close on Friday and we actually lost the daily support again. I was looking for shorts Thursday because we lost the four-hour; on Friday we lost the daily at 7507. We are now officially pointed down on all timeframes except the weekly, which is in balance.
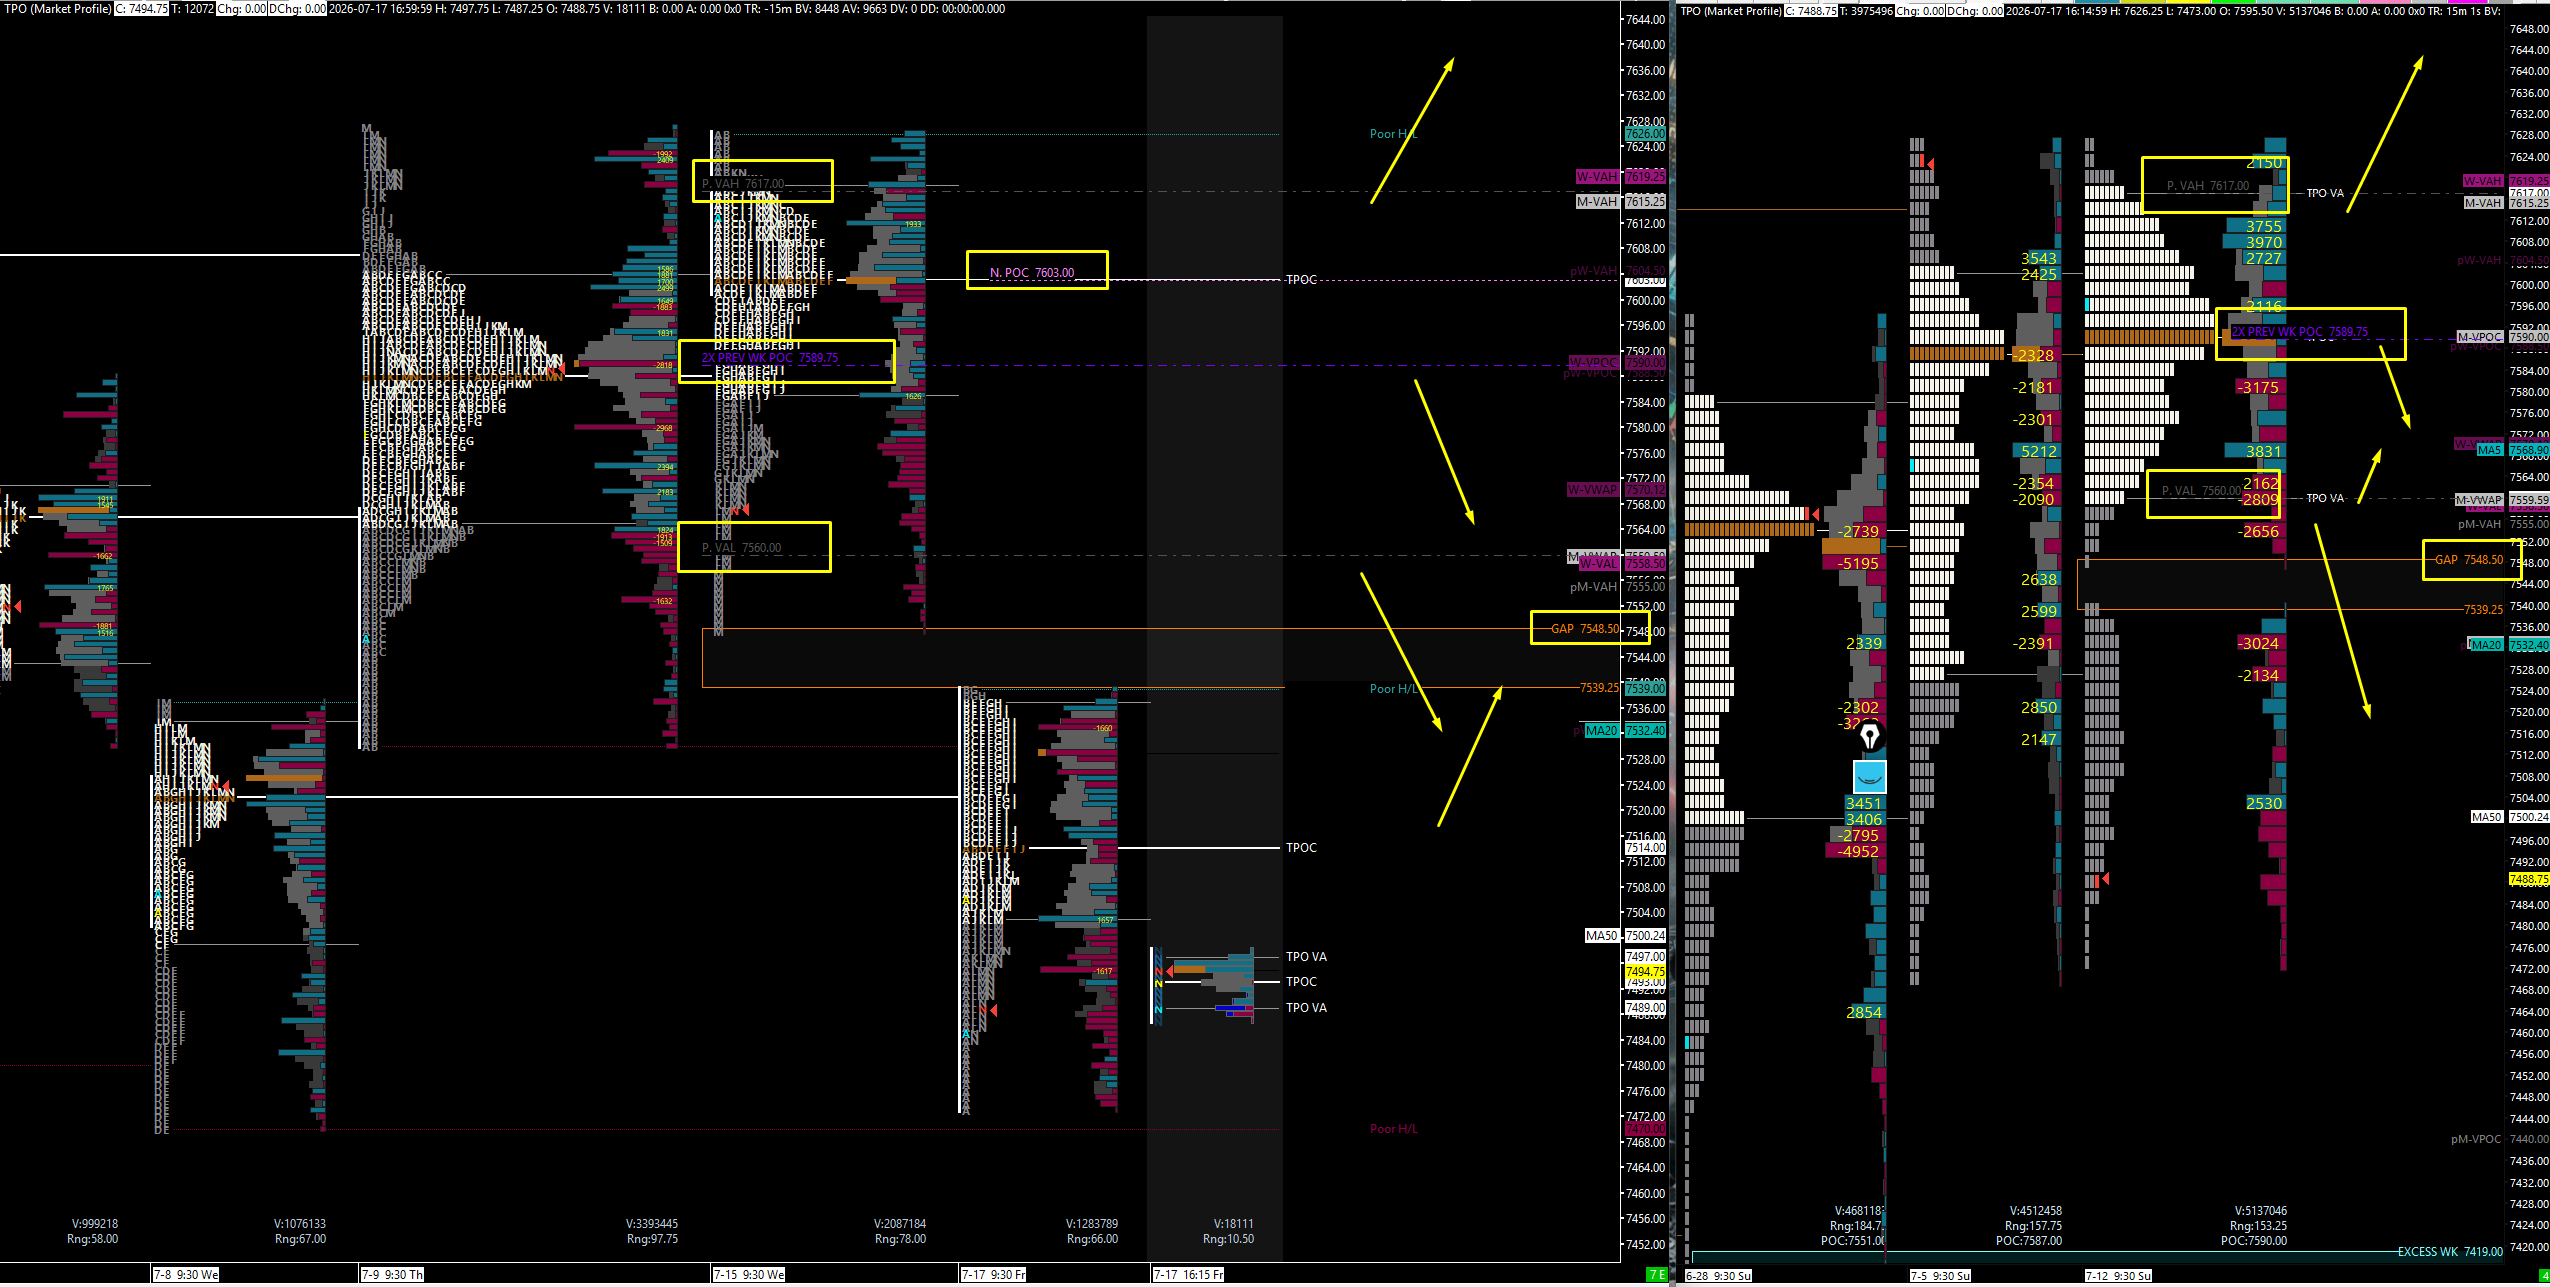
Range: We are in a six-week balance on the weekly timeframe — last week stayed completely inside the previous week’s range, not even sweeping a high or low, which is pretty insane. Friday’s move looks big, but in the grand scheme of things we have not gone anywhere. There is a little gap above that takes us up to 7548, and a big weekly excess below that still needs to get cleaned up down to 7412.
Inefficiencies: We have very significant untested levels below us and very significant untested levels above us — and usually when that happens, these inefficiencies like to get cleaned up. That is the overall gist of the week.
Trend: Down. My process is pointing us down, and I have been guesstimating we come down for a couple of weeks now — every time we do, we pop back up and stay in balance. We have one more opportunity to do that again this week. I remain bearish below the previous weekly value area low at 7560, and I do feel like we are gunning for new lows on this leg — I could not believe they rallied Friday without getting them.
🧠 Current Market Context
The Six-Week Balance & The Lost Daily Timeframe
Here is the honest picture: we are in a six-week balance, and last week we literally sat inside the prior week’s range going back and forth all week without gaining or losing anything in percentage terms. So while Friday’s action felt like an incredible move — and it was, do not get me wrong — ultimately we have not gone anywhere. What did change is the process: on Thursday we lost the four-hour timeframe, and on Friday we closed below the 7507 daily, officially losing the daily timeframe. We are now pointed down on everything except the weekly, which is in balance. I am obviously looking to the downside, and I do feel like we are gunning for new lows on this leg. They did come down late Friday and clean up Friday’s big massive buying tail — exactly like I was insinuating in the Free Alpha Friday — but a day late and a dollar short on the new lows themselves.
The weekly TPO frames the battlefield. We were cruising higher with progressing value areas until they started to overlap, and now all signs point to potential problems. The two big TPO landmarks: I am bearish below the Previous Weekly Value Area Low at 7560 — get back above it and we could get sucked back into the value area and make our way toward the point of control — and we have two previous weekly Points of Control overlapping at 7589.75, which is a very key area to put on your chart. Below us, that big weekly excess tail from the spike candle still needs its cleanup down to 7412. And the one area I truly think could prop this entire market up, at least for this week, is the 7463.50 daily — a massive untested daily that lines up with the absolutely tested 7458.50 right beside it, giving us a beautiful sweep opportunity. For those trading with me Friday, that sweep was the actual low I was hunting — short most of the day looking for it, ready to flip long.
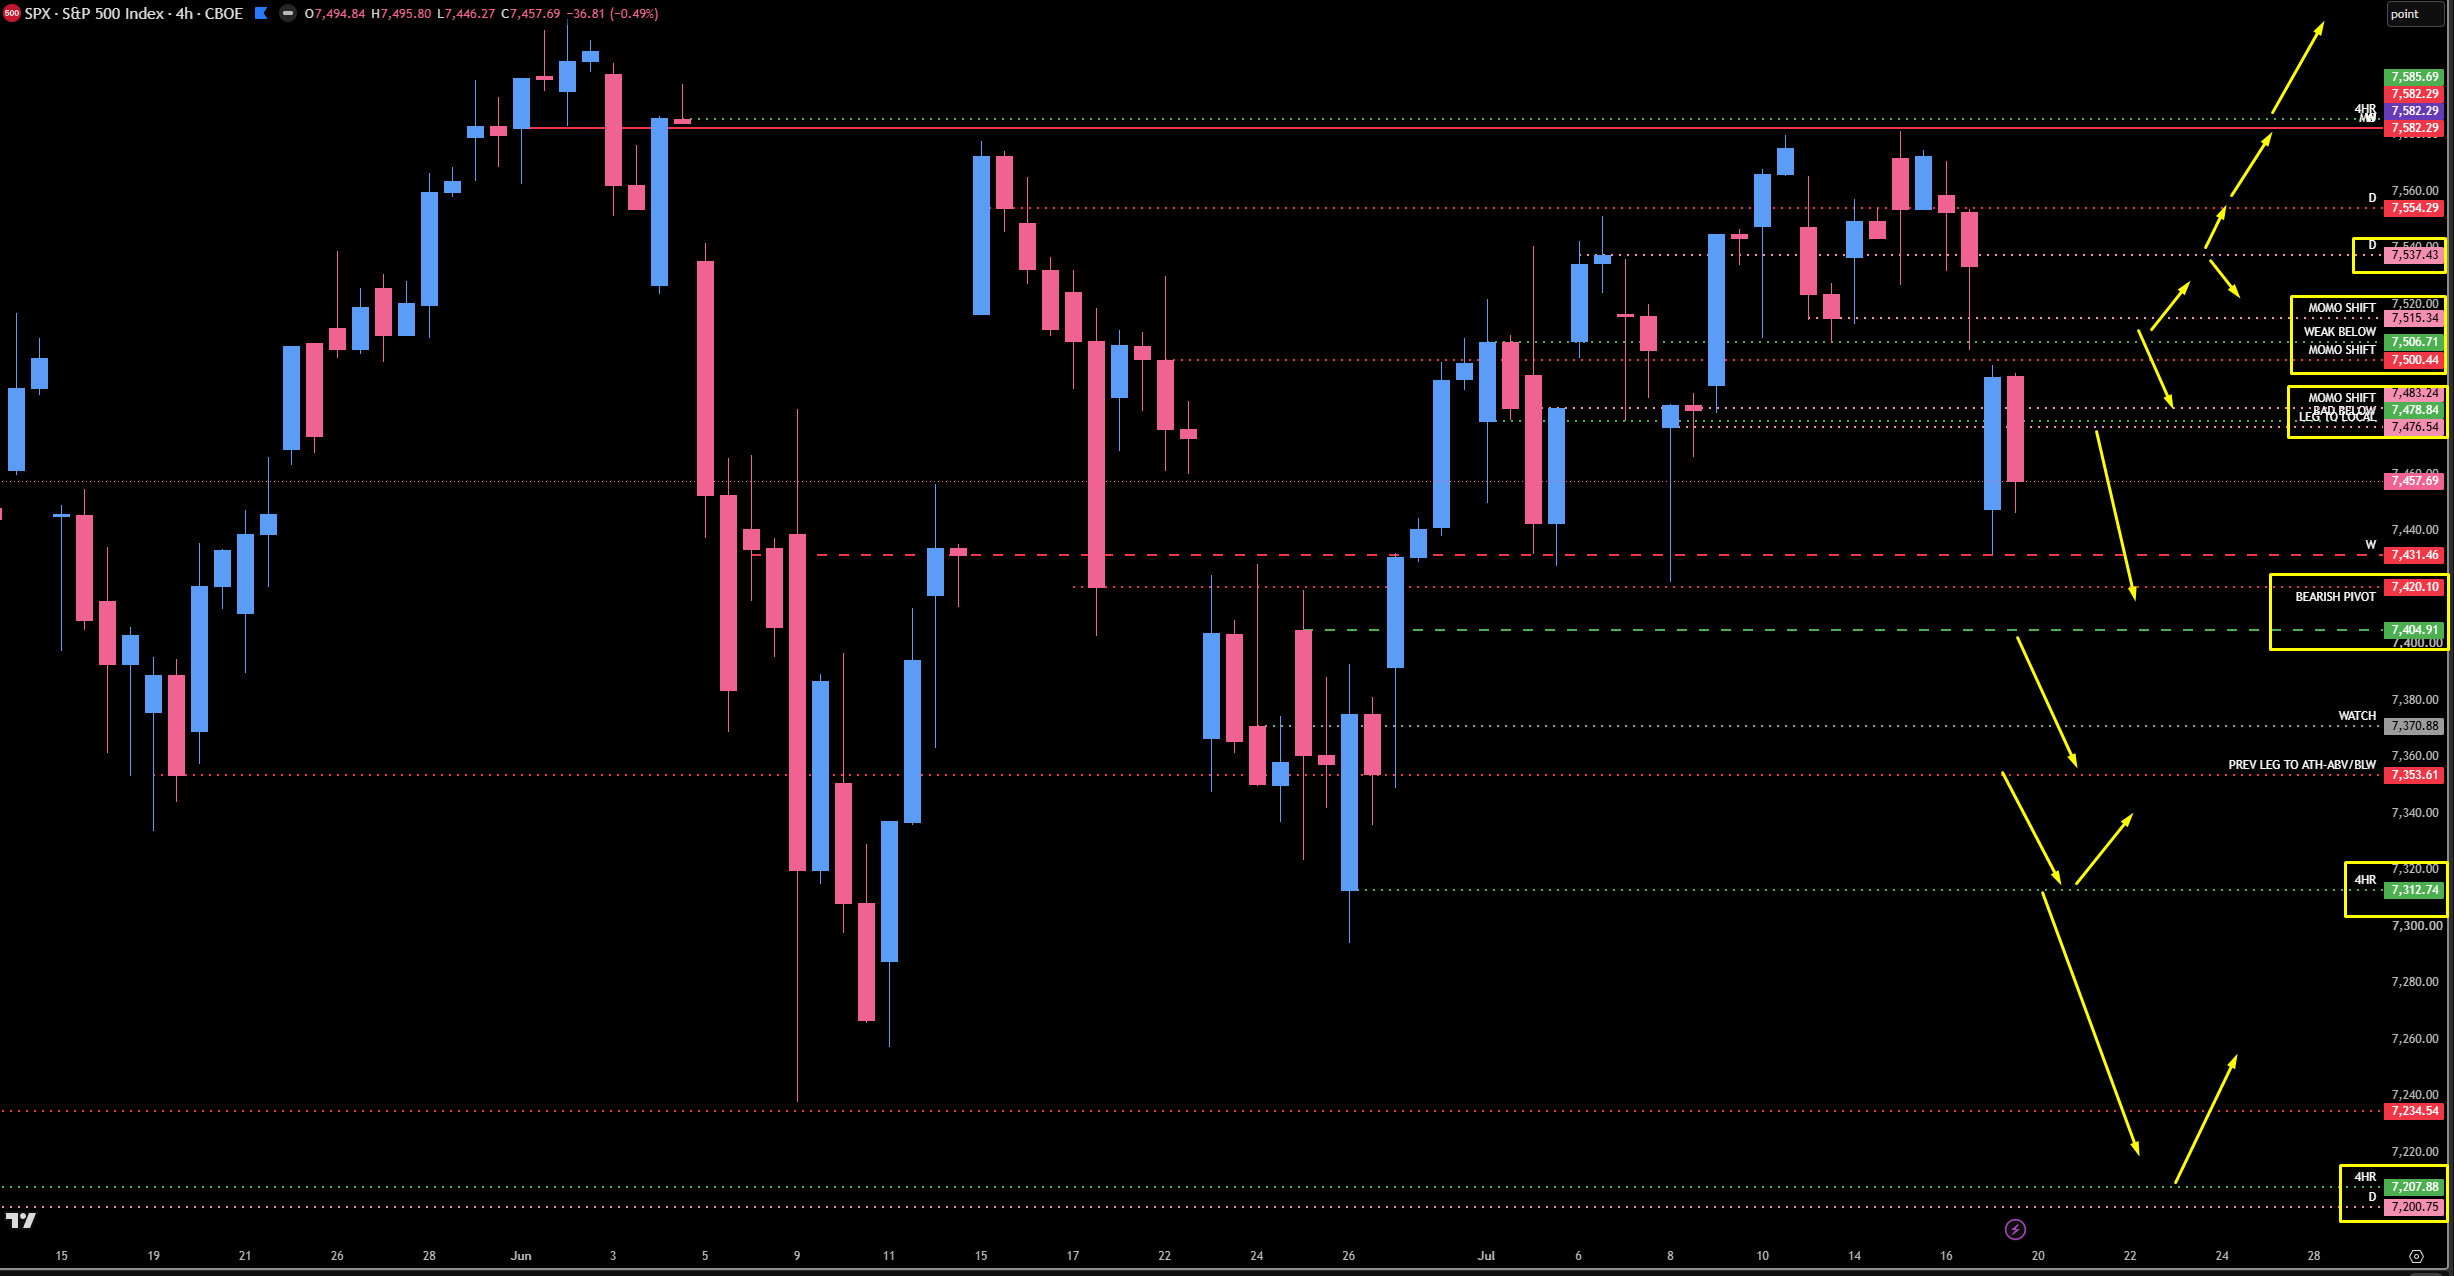
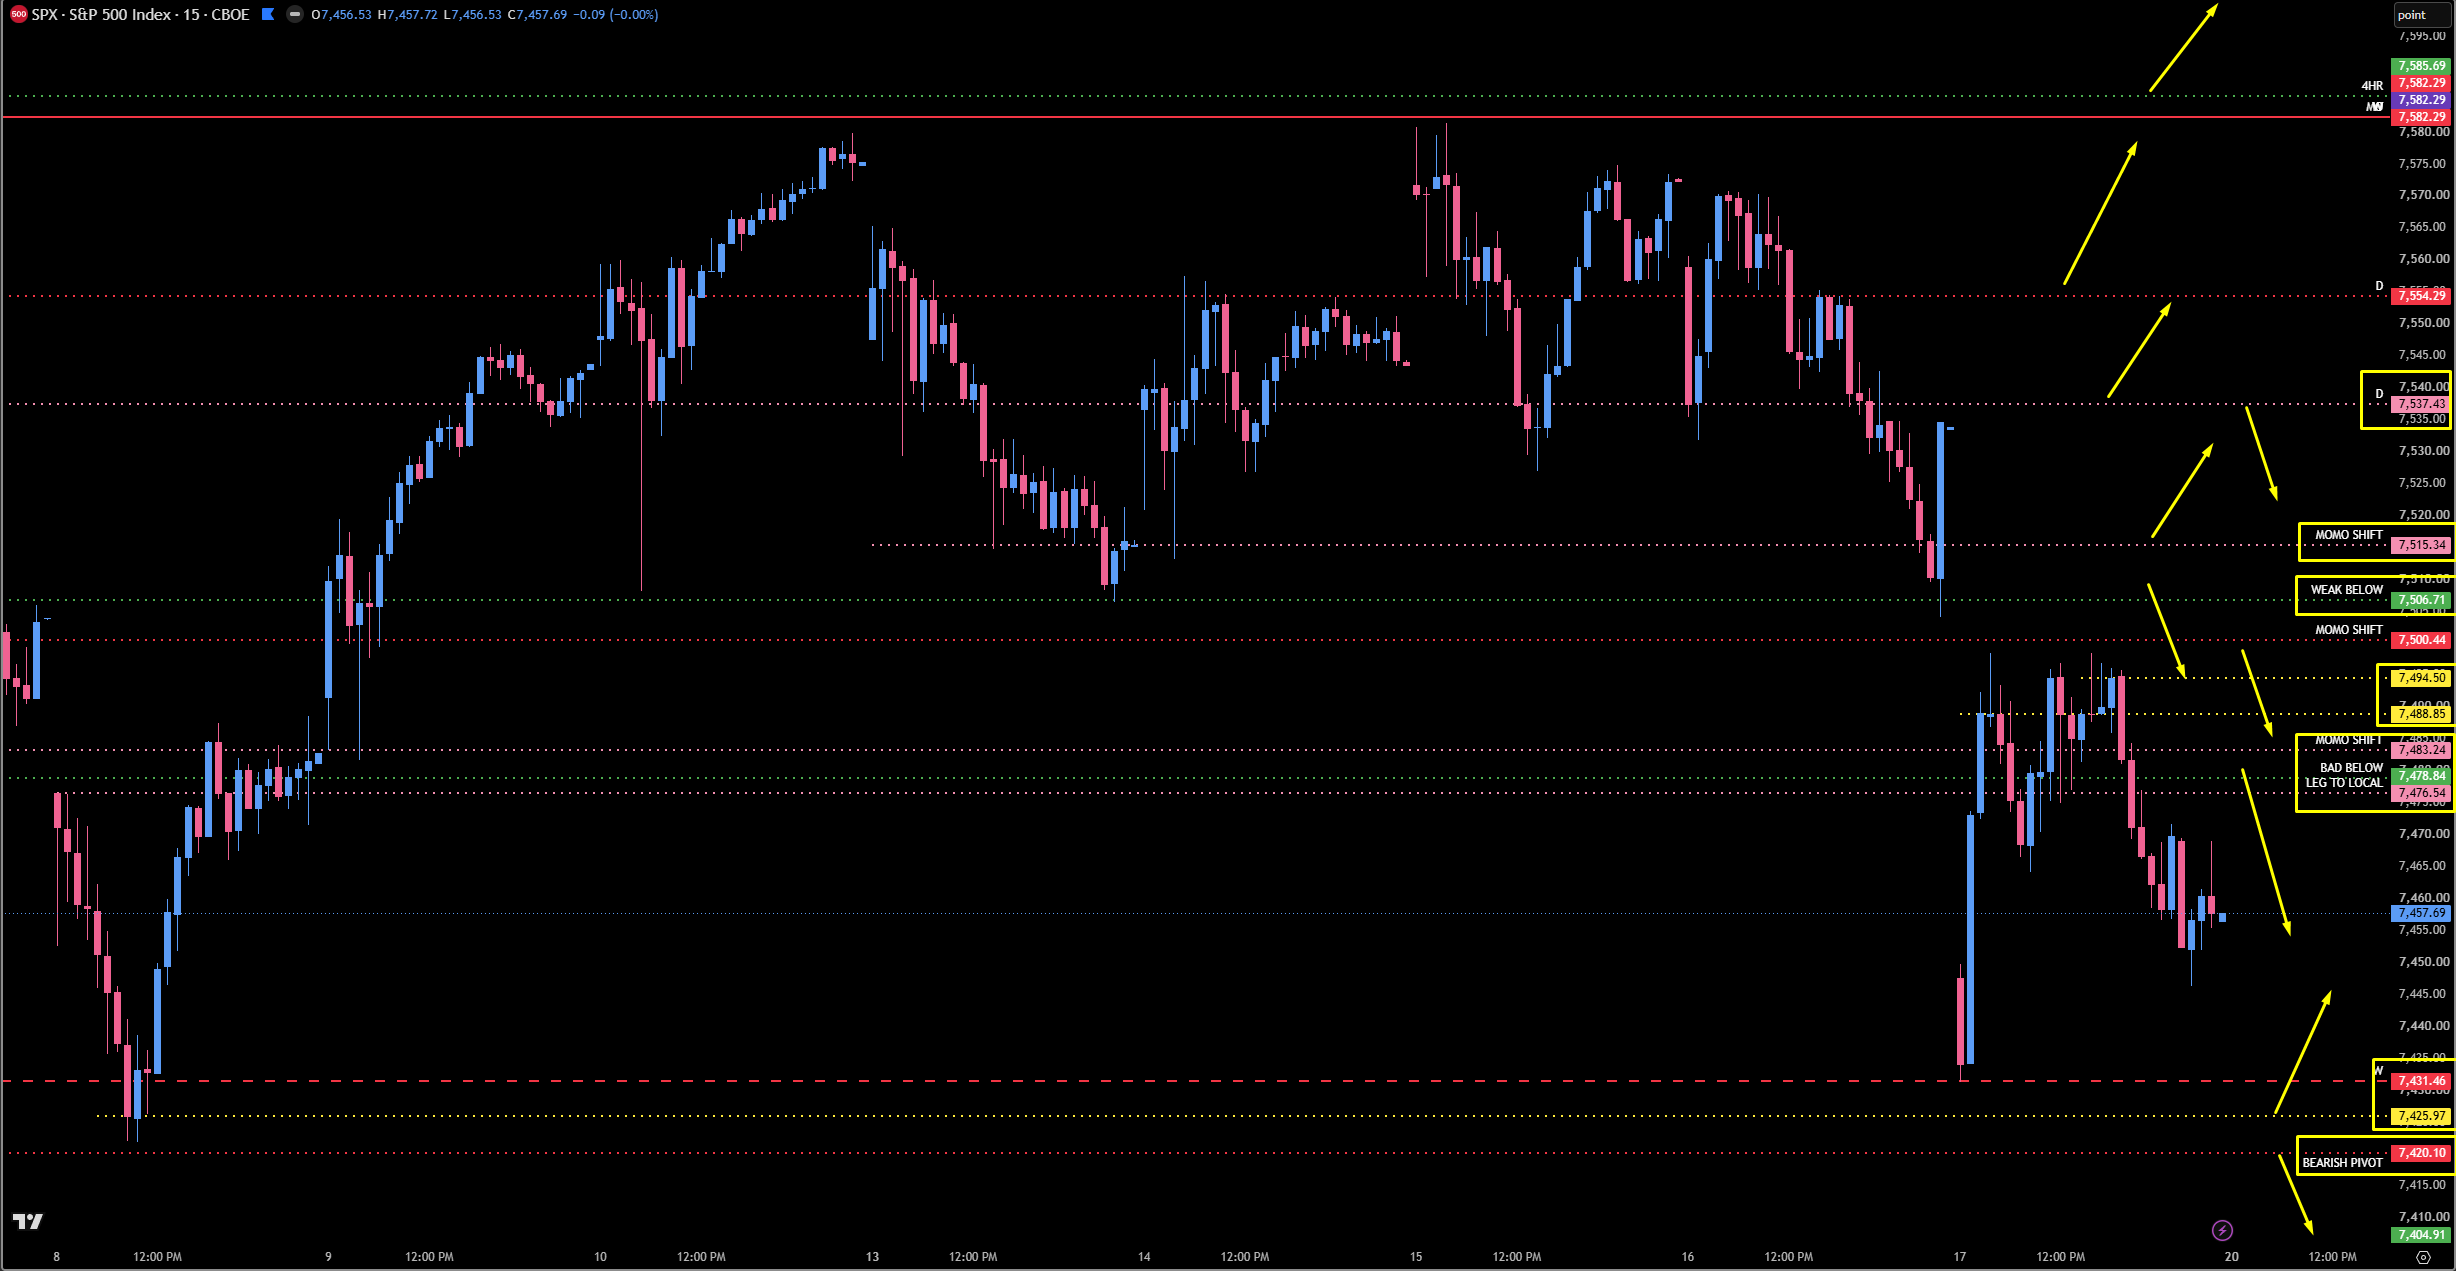
On SPX, the story mimics ES perfectly. We got very close to playing the 7500 — our short on Friday — as they popped, played the tested weekly perfectly, hit 7500, and pulled back. I remain bearish underneath 7500, really below 7506 — an untested four-hour that has played multiple times and a level I like. The 7515 untested daily above played for the pop to the highs, but it is not my favorite; even if it plays, I will more than likely not engage unless we get back below 7506 and 7500 for continuation lower. Above 7515, the bulls start to get a little juice back, taking us into the 7537 untested leg where I would look for a reaction; above 7537 we come to the tested 7554, then back to the monthly and all-time highs. Momentum shifts slightly back to the upside above 7483, but not perfectly. On the downside, underneath 7420 things go severely bad — that is our bearish pivot. The 7404.91 four-hour is tested but important; look for a potential slide into it. Then the one that matters: 7312, the last untested four-hour. Look for a reaction there — if you are short, it is a great place to take profits, and it could produce a nice 30-to-50-point pop. Under 7312, there is nothing untested until the 7234 leg low, and under that we hit the last daily and four-hour at 7200 and 7207 — if that area plays and we get back above 7234, we boogie back higher and start all over again.
🚨 VIX Analysis: The 17.44 Midpoint Pressure
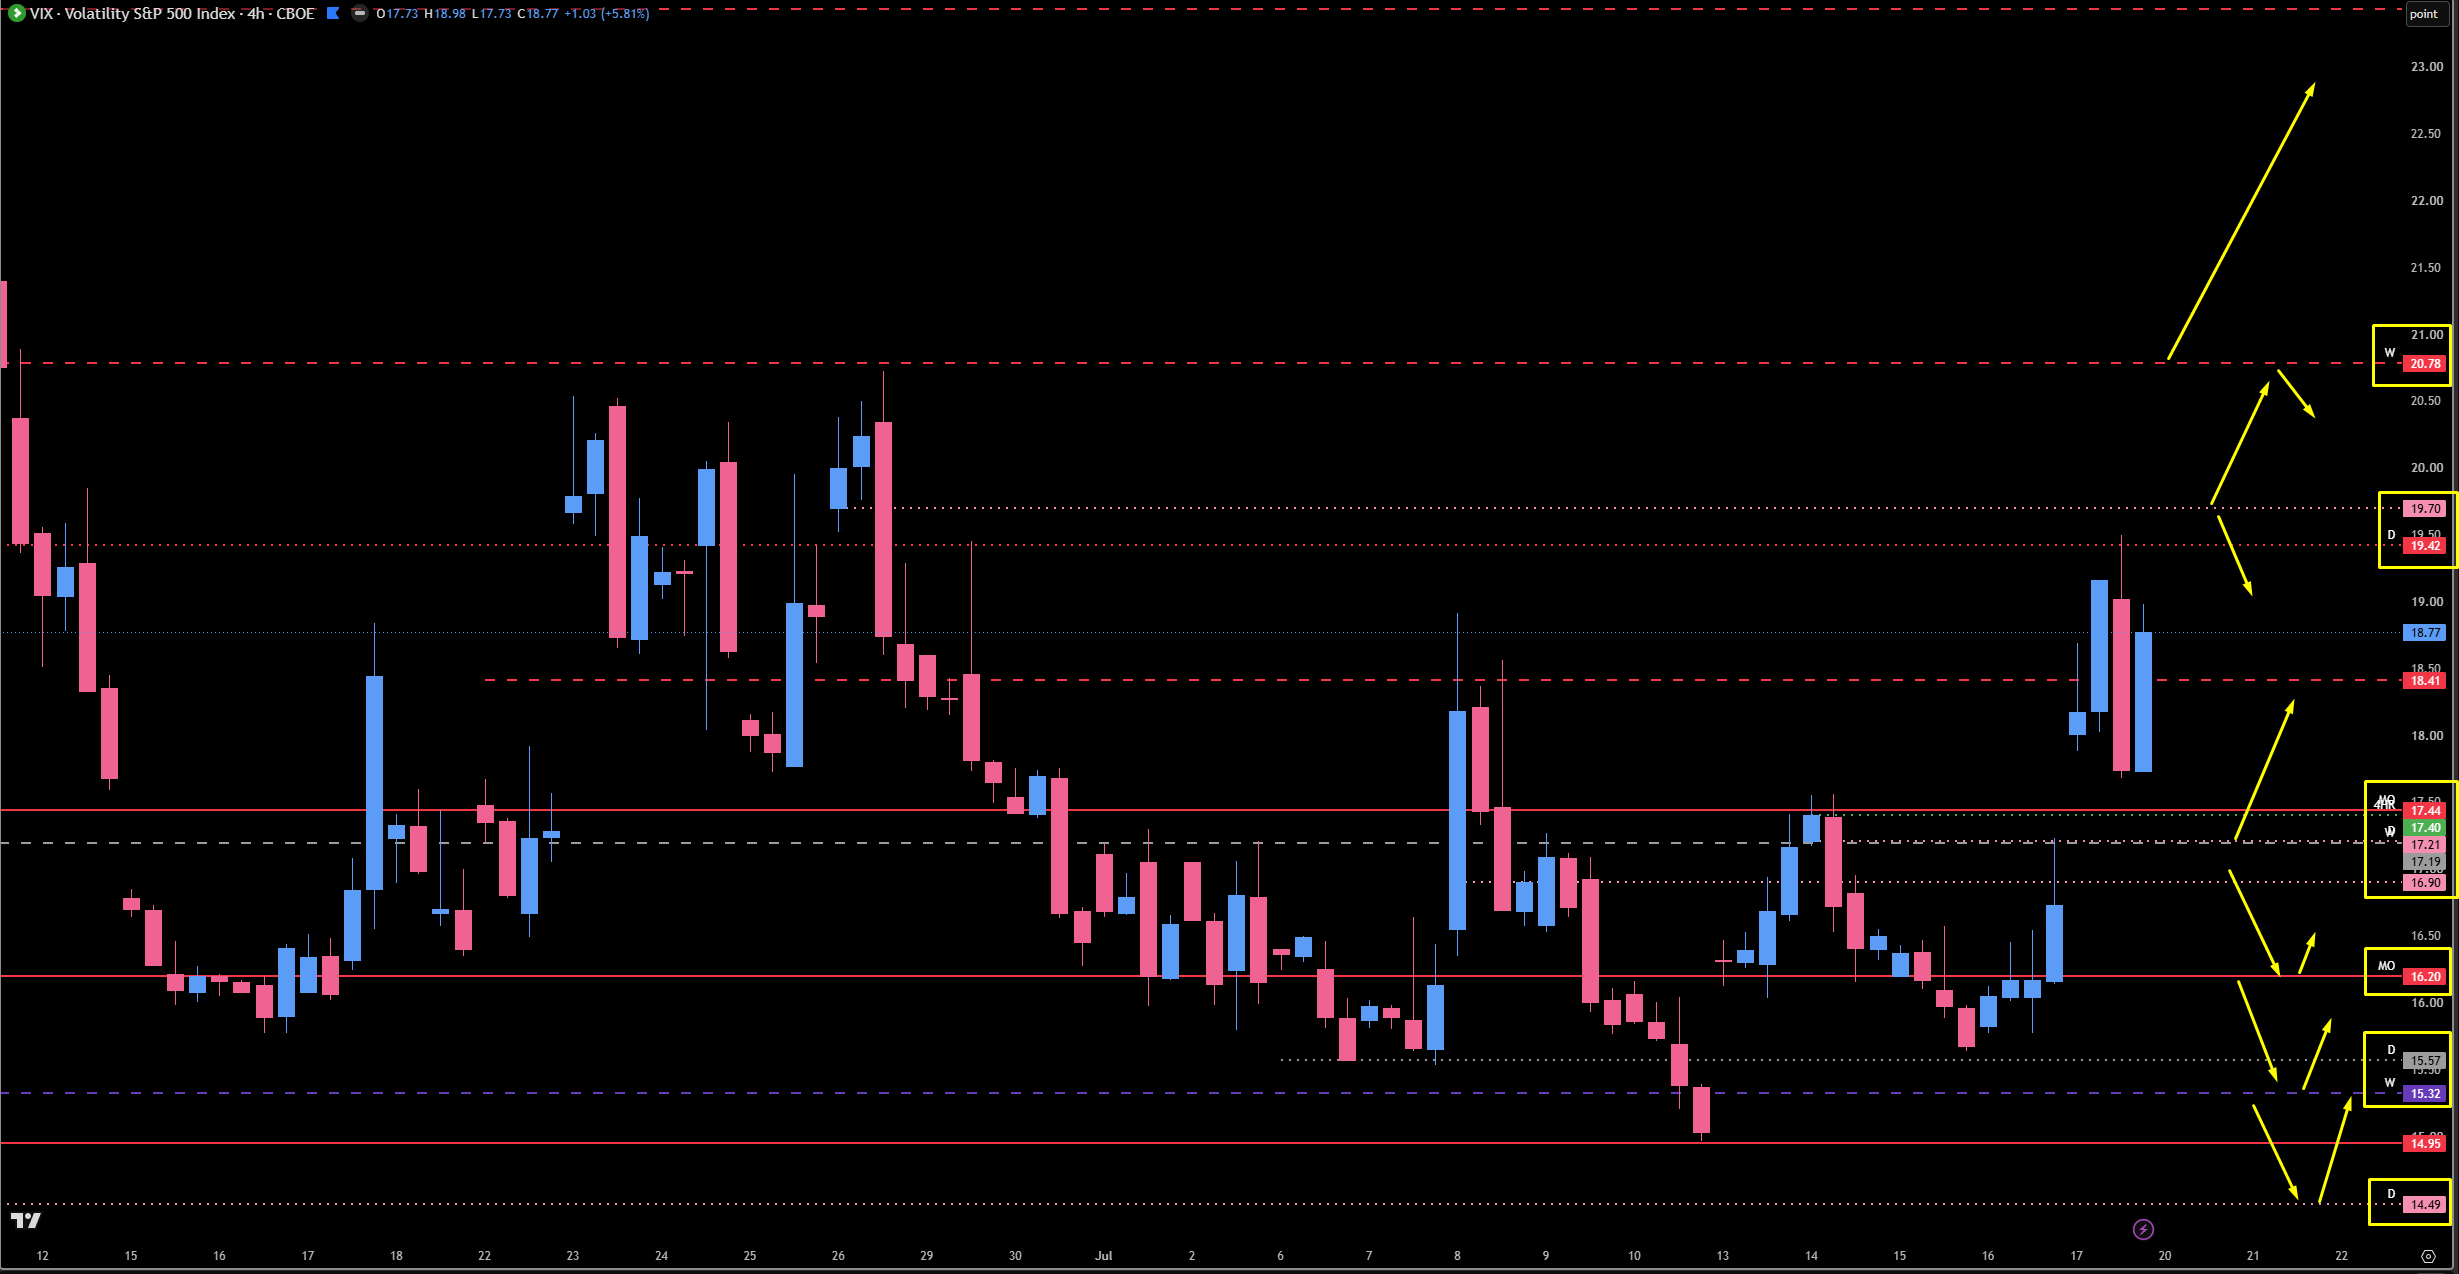
VIX is the pressure gauge this week, and the message is bearish for the indices: we are back above the 17.44 monthly, and just being above it is inherently bearish, keeping a downside lean on the indices — no question about it. We came up and hit the big 19.42 daily once again — this thing never fails to disappoint, smacked over and over — and pulled back into the 15.57 daily before popping again. Now the 17.44 / 17.19 midpoint pivot is where it all comes to play.
The Midpoint — Massive Support: 17.44 - 17.19. We have a nice little W pattern going on here, and this is the huge determining factor: either the indices continue down and keep VIX propped up, or we break below 17.19, test the lower monthly, and come back into the 15.32 weekly — which is where it all goes down for VIX and where the indices get serious relief. Remember: anything that is formerly resistance turns into support once gained. They played this area from the bottom side absolutely perfectly on Thursday, and there is a very untested gap in here. My thought is we get a pop on a test of this zone and at least get back to 18.41.
The Momentum Monitor: 18.41 (Weekly — Very Tested). Above 17.44, this is the next stop. It is very tested, so we use it to monitor momentum above and below rather than expecting a hard rejection.
The Prime Smack: 19.70 (Daily) directly above 19.42. This one is still prime for the smacking — if we come up here and play it and get back below 19.42, VIX could come down.
The Big Reversal Zone: 24.70 (Big Monthly) and 25.78 (Big Daily). Above 19.42 we have 20.78 and the perfectly-played-but-tested 23.43 — nothing untested for quite some time — until we reach this massive resistance band. If VIX pops all the way up here, it will more than likely get a smack, and that would be a great place to look for a potential reversal in the indices to get long — because a push up here means the indices have come down a couple hundred points by then.
The Relief Path: Below 17.19 and ultimately the 16.19 daily, we get serious relief on the indices, taking us back much higher. Watch the midpoint — it decides everything.
🎯 Detailed Actionable Trade Plan (ES Futures)
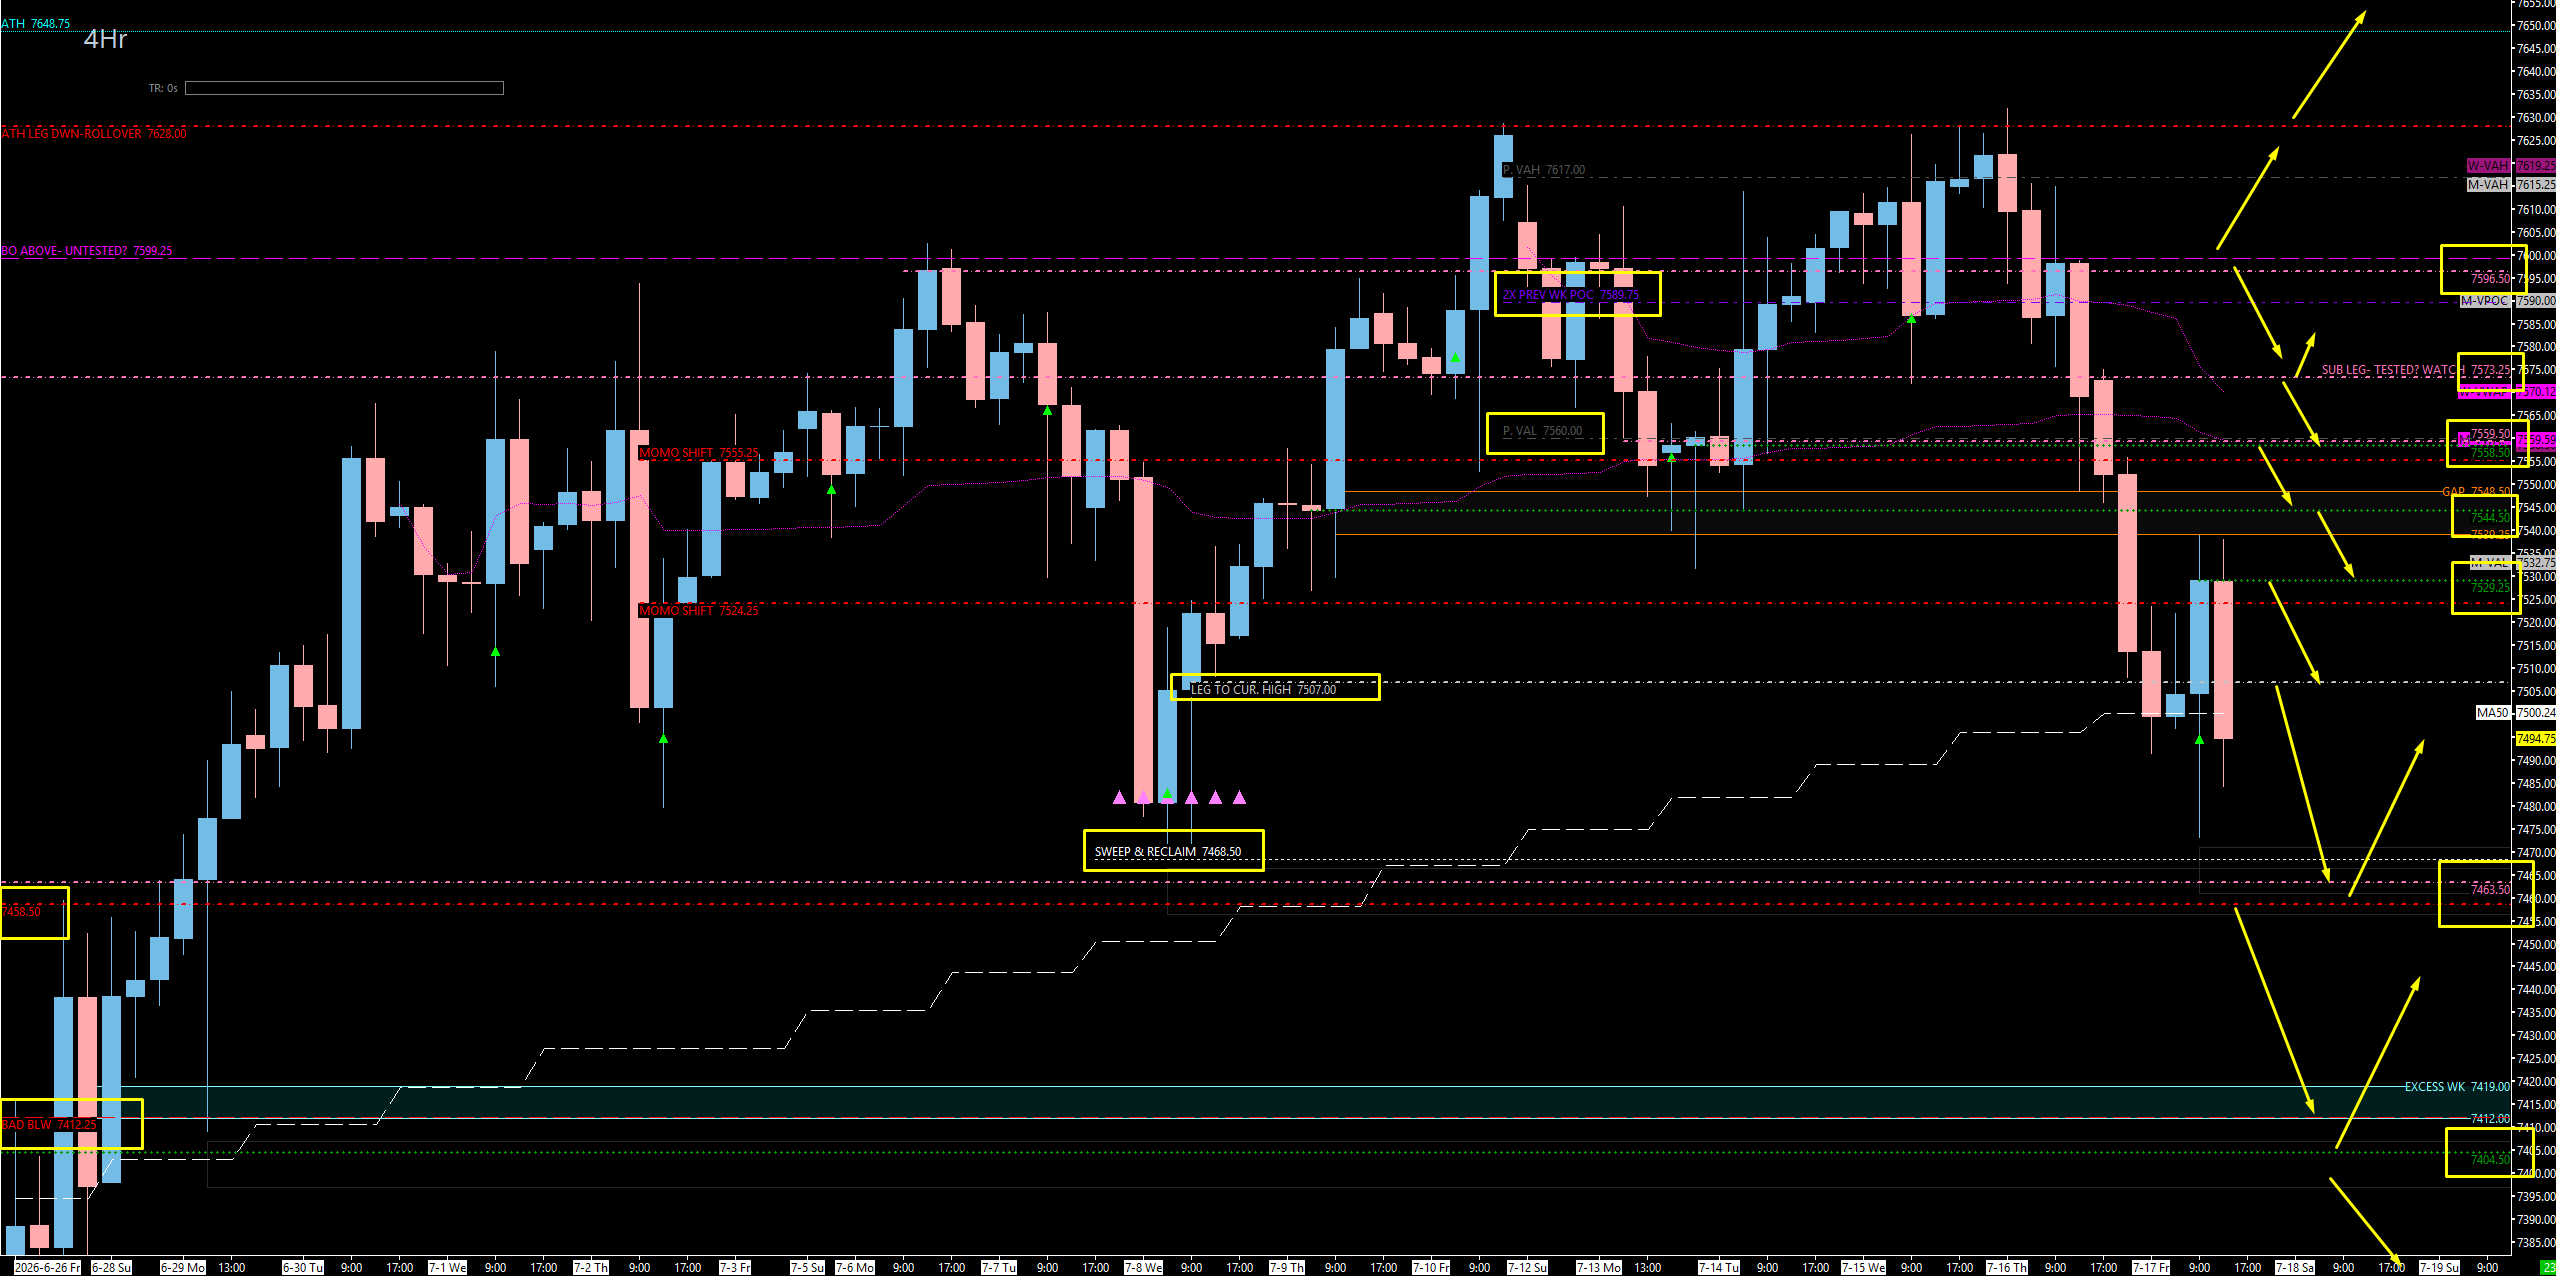
The process points down, and this week is about shorting the untested resistance overhead and hunting the sweep below. The featured trade is the 7529.25 untested four-hour: play it, get back below the 7524 daily to engage the short, take profits at 7507, and look for the full extension into 7463.50. The bull/bear line for the whole structure is the 7600 area — the 7596.50 untested daily (which I would short the sh*t out of), the 7599.25 weekly, and the 7589.75 overlapping POCs. Below, everything goes sideways under 7458.50, with the 7463.50 sweep as the save-it trade and the 7404.50 / 7412 weekly-excess cleanup as the deeper catapult play.
The Featured Setup — The 7529.25 Sexy Short: This is the same trade on both SPX and ES, and it is a beautiful, actionable setup. We have the 7529.25 four-hour — very much untested, very sexy — sitting right on top of the 7524 daily. The play: see 7529.25 play, get back below 7524 to engage the short, take profits at 7507, and then look for even lower into the 7463 area if possible. This is a giant trade — if it plays and gets back underneath, we literally could come all the way under Friday’s low. As long as it plays and pays, we will be very happy campers.
🔴 Key Resistance Zones & Setups
The Gray Marker — Leg to the High: 7507.00
7507.00 (Tested Daily — Leg to the High).
Context: This was the daily that decided Friday — I said if we close below it, we have officially lost the daily timeframe, and we did. Technically speaking, I think it is tested; it did not gain, and I am just not in love with it, so I keep it in gray — not to be ignored, but not a primary level.
Actionable Setup: Use 7507 for above/below context and as a profit-taking marker on shorts from above. It is our leg to the high, so respect the reaction potential without over-trusting it.
The Sexy Short — Untested 4-Hour & The Daily: 7524.00 - 7529.25
7529.25 (Four-Hour — Very Much Untested), 7524.00 (Tested Daily — Momentum Shift).
Context: The 7524 is the big level we have talked about multiple times — the support that held a couple of weeks ago and launched us to the all-time high, with rejection weeks visible bottom-up and top-down all over the left of the chart. It is going to be really important for a momentum shift up or down. And directly on top of it sits the 7529.25 untested four-hour — a very sexy level and my featured trade of the week.
Actionable Setup: Short Setup: Look for 7529.25 to play and get back below 7524 to engage. Take profits at 7507, then look for the extension lower into 7463 if momentum allows. If price gets underneath 7524 and keeps going, this trade could run all the way under Friday’s low.
Warning: If price accepts above 7529.25 instead, we head into the weekly gap fill above — do not fight the acceptance.
The Gap Fill & 4-Hour: 7544.50 - 7548.00
7548.00 (Weekly Gap Fill Target), 7544.50 (Four-Hour — Untested).
Context: Above 7524-7529, we come into the little weekly gap from the TPO that runs up to 7548 — and there just happens to be an untested four-hour at 7544.50 sitting right in it. I like this spot; it played great for us a couple of times.
Actionable Setup: Short Setup: Want to see 7544.50 play and get back below 7539, then take profits at 7529. If it gets underneath 7524, it just keeps going.
The Untested Leg & The Bearish TPO Line: 7558.50 - 7560.00
7560.00 (Previous Weekly Value Area Low — Bearish Below), 7559.50 (Untested — Leg to the High), 7558.50 (Untested — Leg to the High).
Context: This is the big spot for me — I feel like we really shift hard above this location. The 7559.50 / 7558.50 massive untested area is the leg that took us to the high, and it sits directly below the 7560 Previous Weekly Value Area Low, which is my bearish line from the TPO. Above 7560, we could get sucked back into the value area and toward the overlapping POCs.
Actionable Setup: Short Setup: Want to see the 7559.50 / 7558.50 area play and get back below 7555 for continuation lower — then it goes boom, boom, boom: take profits at 7544, 7529, and 7524-7525 on the way down.
Warning: Above 7559 I start to get a little worried that momentum might shift. Keep a close eye on this zone — it is one of my two big momentum-shift spots.
The Tested-Question-Mark Daily: 7573.00
7573.00 (Daily — Tested, Watch).
Context: We know 7573 has been playing, and playing good — this is the big spot we could not get over for weeks, and then finally cleared. My only concern is it looks slightly tested right here, so I have it marked as tested, question mark, watch, because I am not really sure.
Actionable Setup: If it starts to play, you can get in for a small risk with a tight stop. Above 7559 and then 7573, we could come all the way up into 7596.50 again.
The Bull/Bear Line: 7589.75 - 7600.00
7599.25 (Weekly — Untested?), 7596.50 (Daily — Very Much Untested), 7589.75 (Two Overlapping Previous Weekly POCs).
Context: This is where I am truly bullish above or bearish beneath — ultimately our 7600 level that we flirted with many times last week. The 7596.50 daily is very much untested, and I would short the sh*t out of this thing. The 7599.25 weekly is quasi-questionable on tested status — I marked it untested — but regardless, this weekly is so important; it is just big as hell. And the two overlapping previous weekly POCs at 7589.75 make this a very key area. Put all of it on your chart.
Actionable Setup: Short Setup: The plan is to play the 7596.50 daily short and lean on the 7599.25 weekly for help keeping us down. This is the big bull/bear line — below 7600 I am bearish; above it, the bulls take it.
🔵 Key Support Zones & Setups
The Fantastic Sweep — Prop-Up Zone: 7450.00 - 7463.50
7463.50 (Daily — Very Much Untested / The Sweep), 7458.50 (Tested Daily — Everything Sideways Below), 7450.00 (Tested Daily — Backside Plays).
Context: This is the one area I truly think could prop this entire market up, at least for this week. The 7463.50 daily is massive, very much untested, and has played from the bottom side over and over. It lines up with the absolutely tested 7458.50 — the red level below which everything goes sideways — and the 7450 daily that we played from the backside multiple times. It is still untested and provides a fantastic sweep; I do think this area is primed for the pickings. This was the actual low I was hunting on Friday, short most of the day looking for this sweep, ready to flip long.
Actionable Setup: Sweep Setup: The save-it trade: come down, play 7463.50, sweep and reclaim 7468, and squeeze back up into something much higher and untested to restart the balance rotation. This is the long I want if we flush.
Warning: Below 7458.50, everything goes sideways. If the sweep fails and we accept beneath the red level, we head straight into the weekly-excess cleanup below.
The Weekly Excess Cleanup & Catapult: 7404.50 - 7412.00
7412.00 (Weekly — Very Much Tested / Bad Below), 7404.50 (The Play Level).
Context: Underneath 7458.50, we come down and start cleaning up that weekly excess from the TPO — the tail created by that spike candle. The 7412 was a giant level not too long ago, the big weekly, and there is a nice wick here too. But note what my chart says at this weekly: bad below — it all goes south even more underneath it.
Actionable Setup: Buy Setup: What we really want to see: clean up the excess, push through the weekly, play 7404.50, and get back above the weekly at 7412 — that should catapult us right back up to 7458 / 7463. That is where I would take some serious TP if not my final TP — call it a 60-point win and be happy with it.
Warning: Underneath that, ladies and gentlemen, we literally have nothing for quite some time — a tested daily, and then we could come down all the way below 7350 ultimately. Do not overstay the bounce.
📌 Cheat Sheet – Key Levels Recap
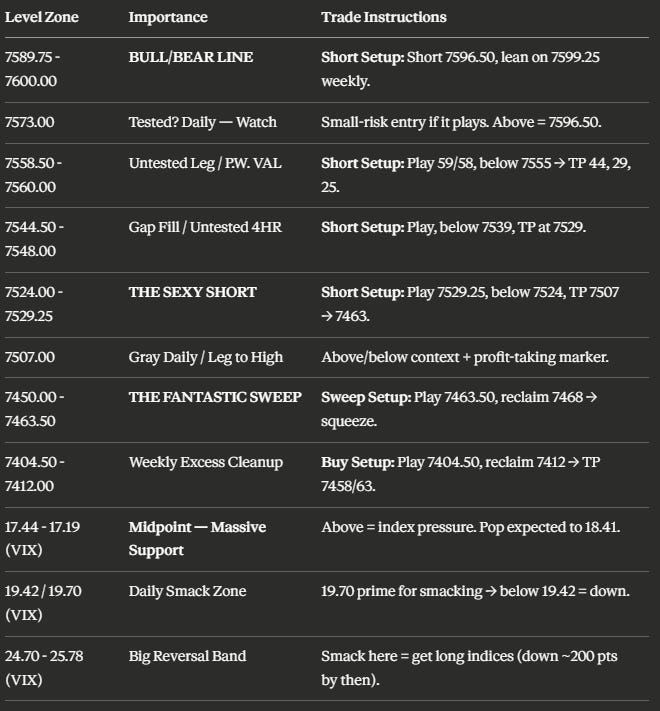
🧠 Final Thoughts
Super clear, super defined. We lost the four-hour on Thursday and the daily at 7507 on Friday — we are officially pointed down on all timeframes except the weekly, which is stuck in a six-week balance where we have genuinely gone nowhere. My process points down, I remain bearish below the 7560 Previous Weekly VAL and the 7600 bull/bear line, and I believe we are gunning for new lows on this leg. But remember: every time we have come down, we have popped back up and stayed in balance, and we have one more opportunity to do that this week — with significant untested levels sitting both above and below us, these inefficiencies like to get cleaned up.
The playbook: the featured trade is the 7529.25 sexy short — play it, back below 7524, profits at 7507, extension to 7463. Above that, the 7544.50 gap-fill four-hour, the 7558.50-7560 untested leg at the bearish TPO line, and ultimately the 7596.50 daily short with the 7599.25 weekly backing it up. Below, the 7463.50 fantastic sweep is the prop-up trade — sweep, reclaim 7468, squeeze — and if we lose 7458.50, the weekly-excess cleanup targets 7404.50 with the reclaim of 7412 catapulting us back for a 60-point win. Keep VIX front and center: above the 17.44 monthly, the pressure stays on the indices, and the 17.44-17.19 midpoint W is the determining factor for the entire week. One step at a time — the levels are defined, the setups are actionable, and we know exactly where it all goes bad.
To everyone in the Inner Circle — I am so proud of each and every one of you. And to those who have written me saying the trade plans are incredible: listen, it is not me, it is the process. If you want to learn more about it, shoot me a DM — I got you. Sign up for the How to Trade the Trade Plan webinar on Thursday, grab your shot at the free prop firm evals, and I look forward to absolutely murdering this week and conquering the markets with each and every one of you.
Until next time—trade smart, stay prepared, and together we will conquer these markets!
Ryan Bailey, VICI Trading Solutions.
📊 TradingView Indicator String
Copy and paste the levels below into your S&P Edge Levels indicator to automatically plot today’s key levels on your chart:
7599.25|WK|W
7596.50|D|D
7573.00|Tested D|TD
7560.00|P.W. VAL|GD
7544.50|4HR|4H
7529.25|4HR|4H
7524.00|Tested D|TD
7507.00|Tested D|TD
7463.50|D|D
7458.50|Tested D|TD
7450.00|Tested D|TD
7412.00|Tested WK|TW


