

Hello, hello — Chef Bailey in the house. It is a pleasure to see everyone. My gracious, I missed you all on Sunday, but here I am making it up to you. We are doing a very special edition today: we are running the Weekend Review live as the Post Market Breakdown so we can talk through the setups together with everyone in chat. Something a little unique.

I am actually fresh off the plane. We did not land until about one o’clock, took about an hour to get home, so I have only been home a couple of hours. And I will tell you what — this whole thing is called Murphy’s Law: if there is something bad that can happen, it will. I had a beautiful weekend with my girl. We went to Maine just for the weekend, since that is where she was working, and we ate our way through the entire state — literally stopped at every single place, chowder, this, that, and the other, driving all across the coast and stopping in every little town and shop. On my last day there she had this very intimate, beautiful thing planned out. Gorgeous ocean view, amazing food, the whole nine. I take one bite, excuse myself to the bathroom, come back and say I am just not feeling right. Food poisoning. Five hours hanging on the toilet. She had dinner by herself. We were only an hour from the hotel and it took two and a half hours because I kept having her pull over. Then I had to be up at four in the morning to catch a plane after being sick all night. So I think I look pretty good, all things considered. I love clam chowder — and I will probably never eat it again for the rest of my life.
Anyway, I am glad to be home, I have got the coffee juice, and we are getting right into it. I took a look at the markets today and we did not really get much movement, so not a bad day. As usual: VIX, SPX, and then ES.
☕ FREE RESOURCE — The SPX Morning Brief | Delivered 5:45 AM EST Take advantage of this. Every morning at 5:45 AM EST, the SPX Morning Brief hits your inbox with everything you need to understand the significant value levels on SPX, over 150 indicator prediction assessments, and the top 5 news articles of the day. It is a fast read that gets you fully prepared well before the bell. It is free — all I ask is that you let me into your inbox. Sign up now → https://pages.vicitradingsolutions.com/spx-edge
🎓 WEBINAR — How to Trade the Trade Plan | This Week I am running the How to Trade the Trade Plan webinar this week, and I will get all the details out via email tonight. This is one of our bigger events — I do it once a month and it has become a staple. If you are a Trade Plan subscriber and you have never been, especially if you are new, I highly recommend you come. It will help quite a bit. There is no reason to guess here. I put a lot of work into this stuff, so once a month come on through and I will show you exactly how to get the most out of it. And maybe you will win a prop firm or two — last time I gave away three, and I had a guy who never even responded, so maybe I will give his away this time and just keep bankrolling them until we have a little Powerball going on over here. Register here → https://pages.vicitradingsolutions.com/tradetheplan
A Note on This Week’s Market:
News: Nothing specific on the radar heading into the rest of the week. Monday gave us very little movement — not a bad day, just quiet. Of course, anything can shake it loose; a single headline out of nowhere could squeeze this thing, so stay awake at the open.
Volume: We still have that massive gap up from Tuesday and a huge amount of inefficiencies left behind from that push. The one thing that could truly save this on the downside is that we sat and balanced in that massive range below for weeks and weeks — I combined the profiles and each one is damn near a month; both are five weeks, so that is 10 weeks of profiles stacked down there. If they come into it, there is a massive amount of volume and action in that zone.
Range: We are working lower with a defined roadmap. On the weekly TPO, above 7746 everything shifts and we can come all the way up to roughly 7800. Below 7698 it is more down, and under 7683 we get even more suppression. There is a weekly gap below still waiting.
Gamma: We are in Positive Gamma. We got pretty spoiled with that negative gamma regime and then went right back to positive — it is summertime lazy out there. Hopefully we get a VIX tailwind in our favor so we can get some volatility and move around a little bit.
Trend: Down on all timeframes except the weekly. We are still up on the weekly, which means we have to buy the weekly when we come into it — and there are a couple of them below us. Until we get there, we remain short. That does not mean we cannot squeeze, but for now we are still coming down, and I am not looking for longs until we get into that lower weekly zone.
🧠 Current Market Context
Down On All Timeframes, But We Buy The Weeklies
Here is why the process keeps us on the right side of the trade: everything I do is high-timeframe based. In a downtrend there are pops, sure — but we know the downtrend is not over because we have not gained anything back on the higher timeframes. Right now we are down on all timeframes except the weekly, and that single fact frames the entire plan. We stay short until we reach the weeklies below, and then we flip and buy them.
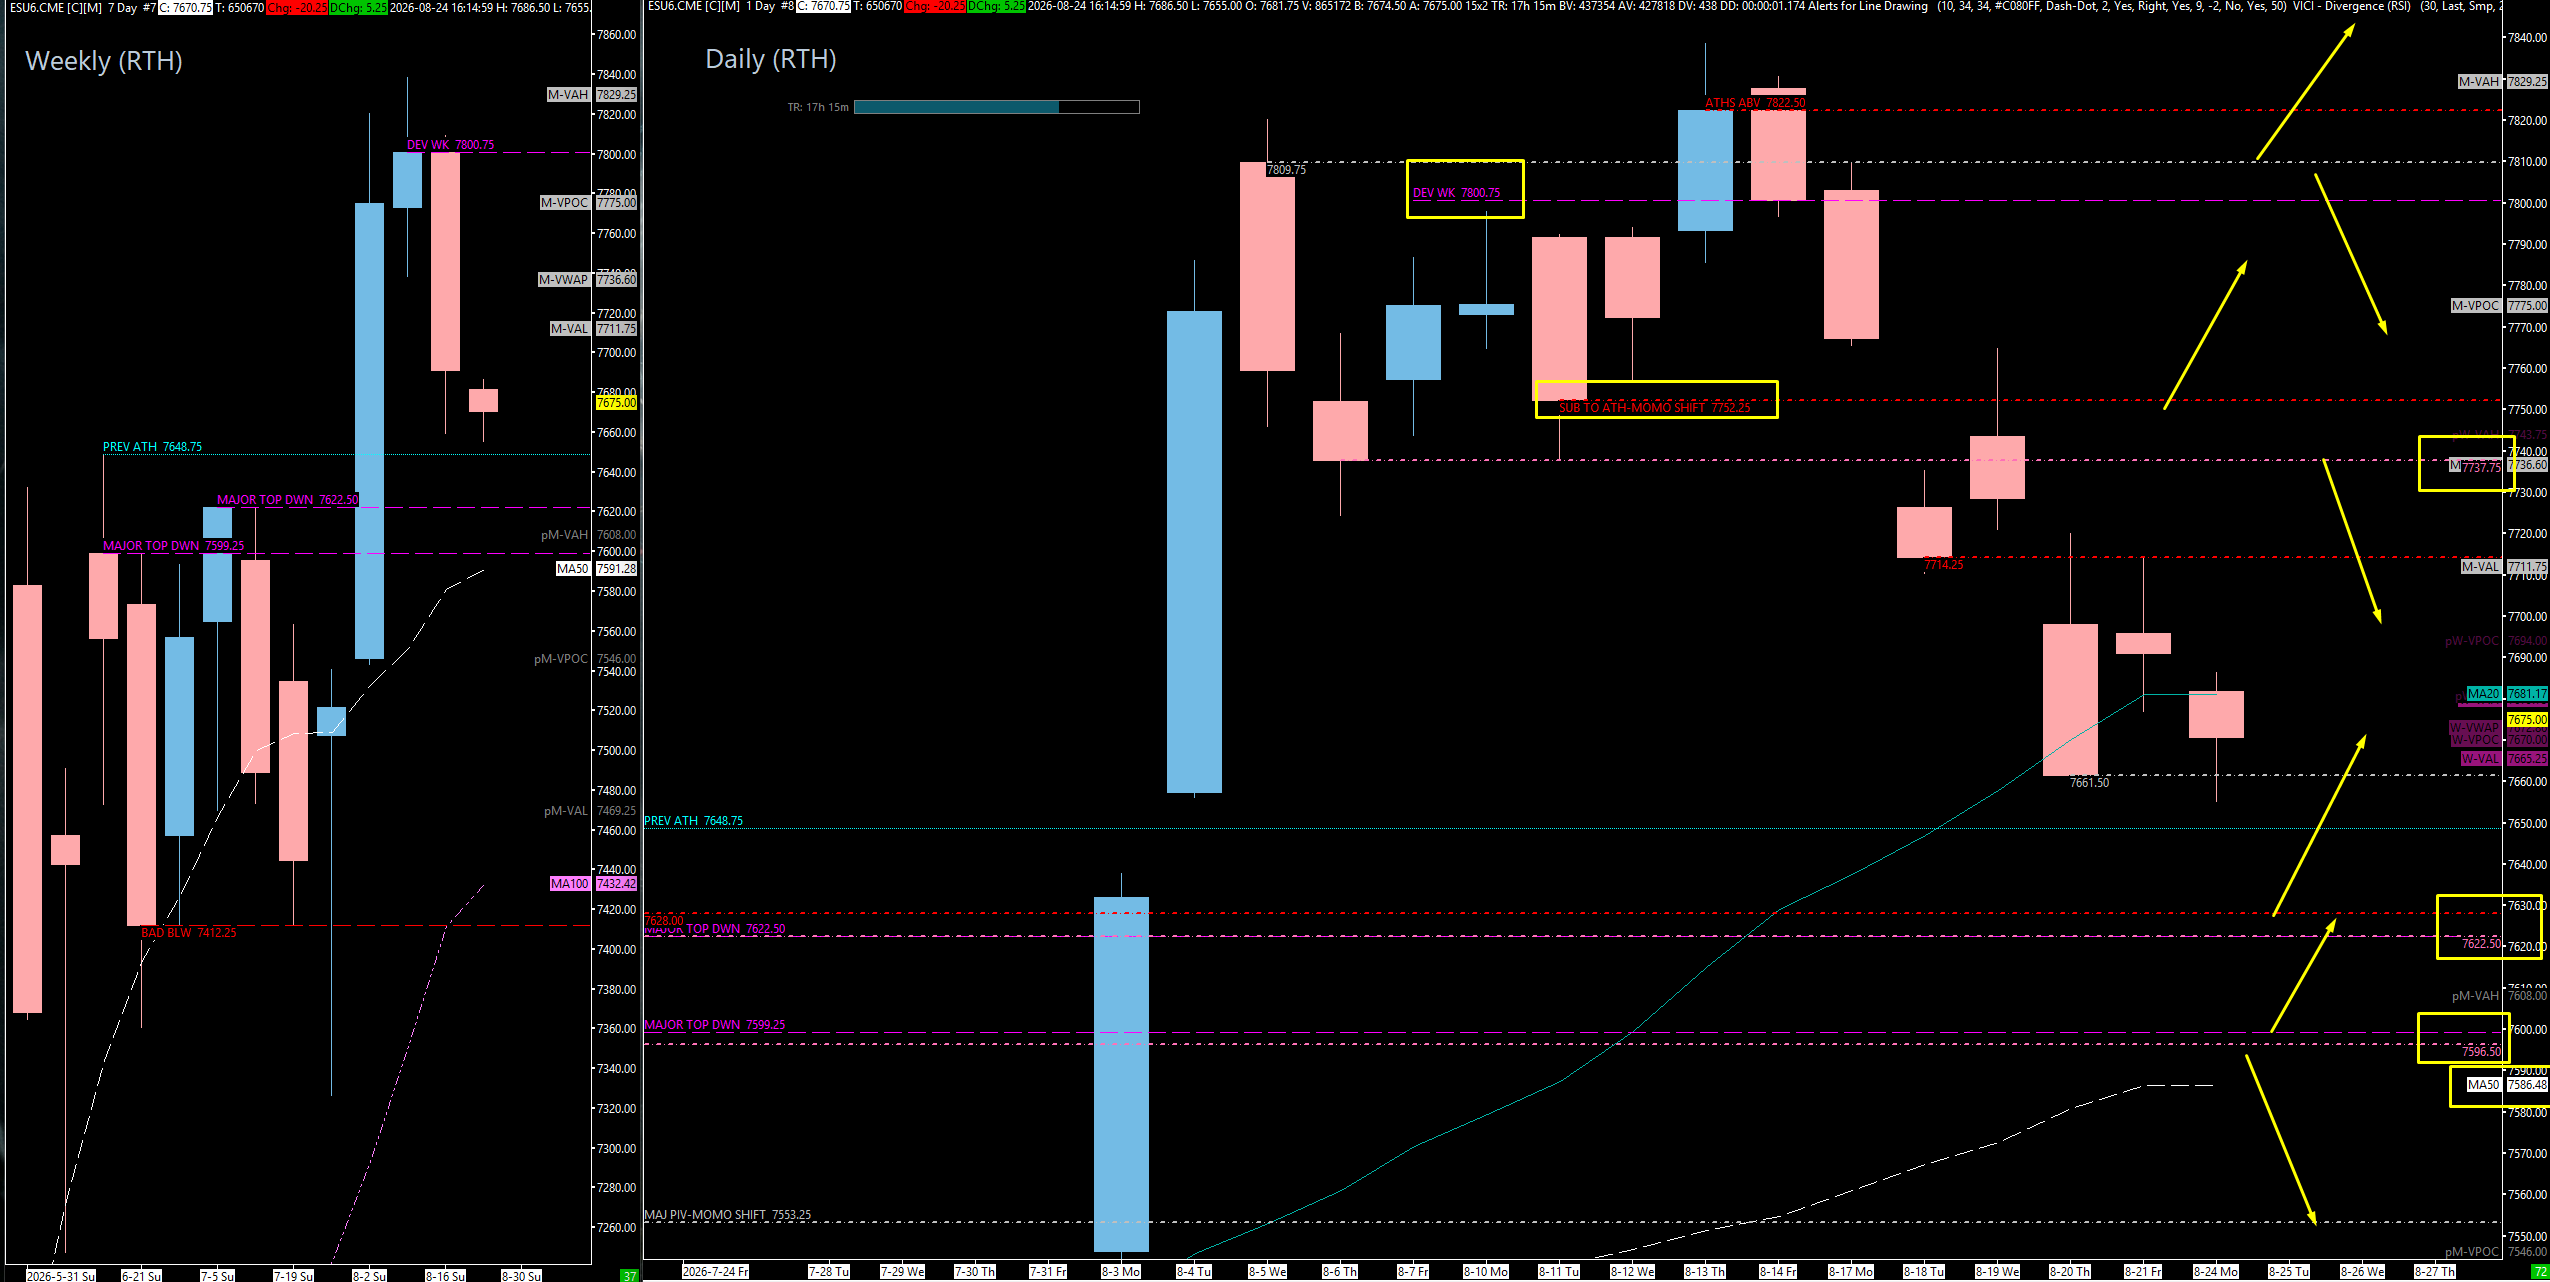
The ES weekly TPO makes this incredibly simple, and this is great for anyone who gets tangled up trying to track what is gained or lost. None of that matters right now. All you have to know is this: as long as we are below 7746 — the Previous Weekly Value Area High — we are pointed down. As long as we are below 7698, the Previous Weekly Point of Control, it is even more down. And under 7683, the Previous Weekly Value Area Low, we get even more suppression and we are truly very bearish. Above 7698 we start to get a little momentum to the upside — a little, not a lot. Where everything really shifts is 7746; above that we can come all the way up to roughly 7800, and I think that is a pretty safe bet. I really like 7698 as our above/below line for the suppression, and conveniently it is almost an even number — call it 7700-ish. Put that on your chart.
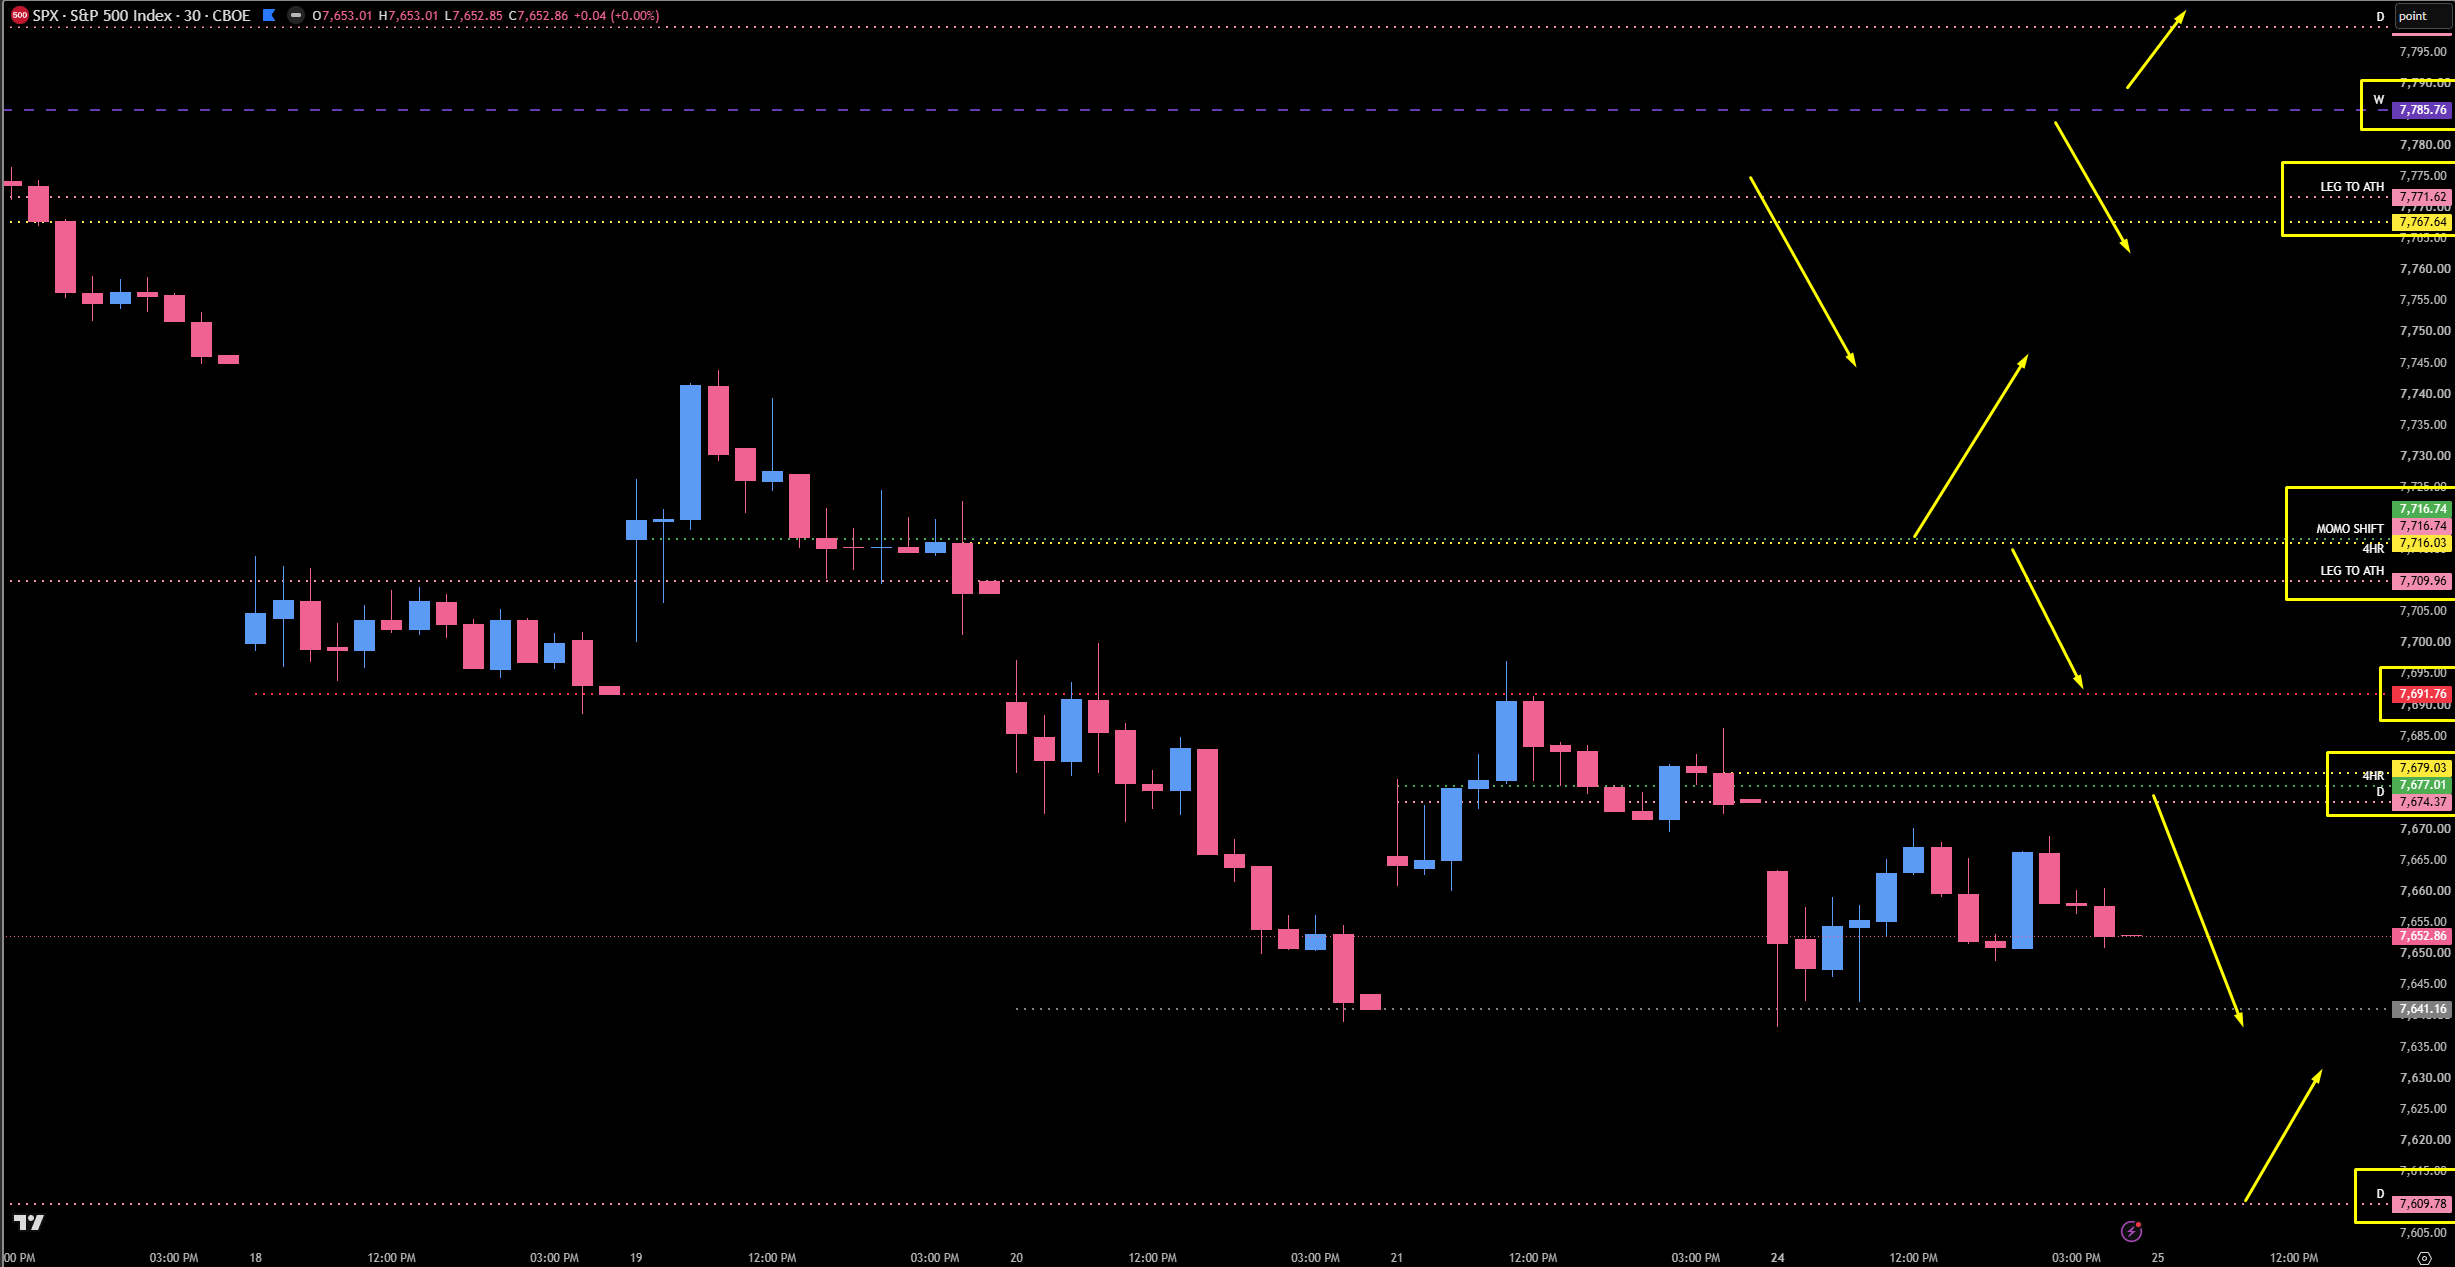
On SPX, I have to be honest — this looks pretty bullish. It is a nice bullish wedge and I am very much still bullish on the higher timeframe, even though I have been intraday bearish and short for pretty much all of last week. The party is not over, at least not yet. But here is my disclaimer, and it matters: the 7582 / 7575 area needs to hold. If it holds, the progression simply continues up and we can deal with the monthly/weekly at 7785 when we get there — that is another discussion, and more than likely it would just be a little head bump. But if we get back underneath 7582, we are getting sucked into that balance. And look at the weekly candles: one, two, three... call it 11, maybe 12, 13, even 14 weeks of balance if we extend the box. We do not want to be in there. If we do get down in that range, I still like the 7464 leg up — very much untested, a sweet spot — but then you have a big area to get over and you have to fumble around hoping for continuation. It is so much easier to hold that top main area at 7582, or even the first little spot at 7554, and dig ourselves out for that true progression right away.
Now for what we know for sure on SPX, and this is where it all comes together: 7709. This is our leg to the all-time high — we have talked about it a hundred times. That is where everything shifts. It is our main shift point and it is very much untested; that whole zone from 7709 to 7716 is untested. As long as we stay below it, our momentum shifts below. Next, 7691 is our current move to the low — this is where things shift in turn, not a full-blown bull or bear shift, but as long as we are below it we are bearish. If we get above 7691, it gives us the maneuver to come up and test that untested high zone. The spot really on my map is 7679 through 7674 — I like it quite a bit. We have a one-hour, a four-hour, and a daily all between 7679 and 7674, and we have not filled the gap lower yet, which I still think is coming. We still have not quite cleaned up all of that huge move up from two Tuesdays ago, so I think there is a little more downside left. That is the first area I am going to look to short, and as we show strength to the downside I will add into the trade, looking for new lows under the 7641 daily that is currently holding us up. If instead we reclaim and they push above the tested 7691 and come up into 7709 / 7716, that is where I would look for another big hit to take us down. Above 7771 and the monthly/weekly at 7785 — doesn’t that look like a massive head and shoulders? Head in the middle, shoulder on each side. I could totally see that getting whacked. I would not short at all anymore until we get up to there. And I am not fishing for longs until we get down into that weekly at 7582 or maybe even the daily at 7609.
🚨 VIX Analysis: The 16.15 Lid & The Single Print Above
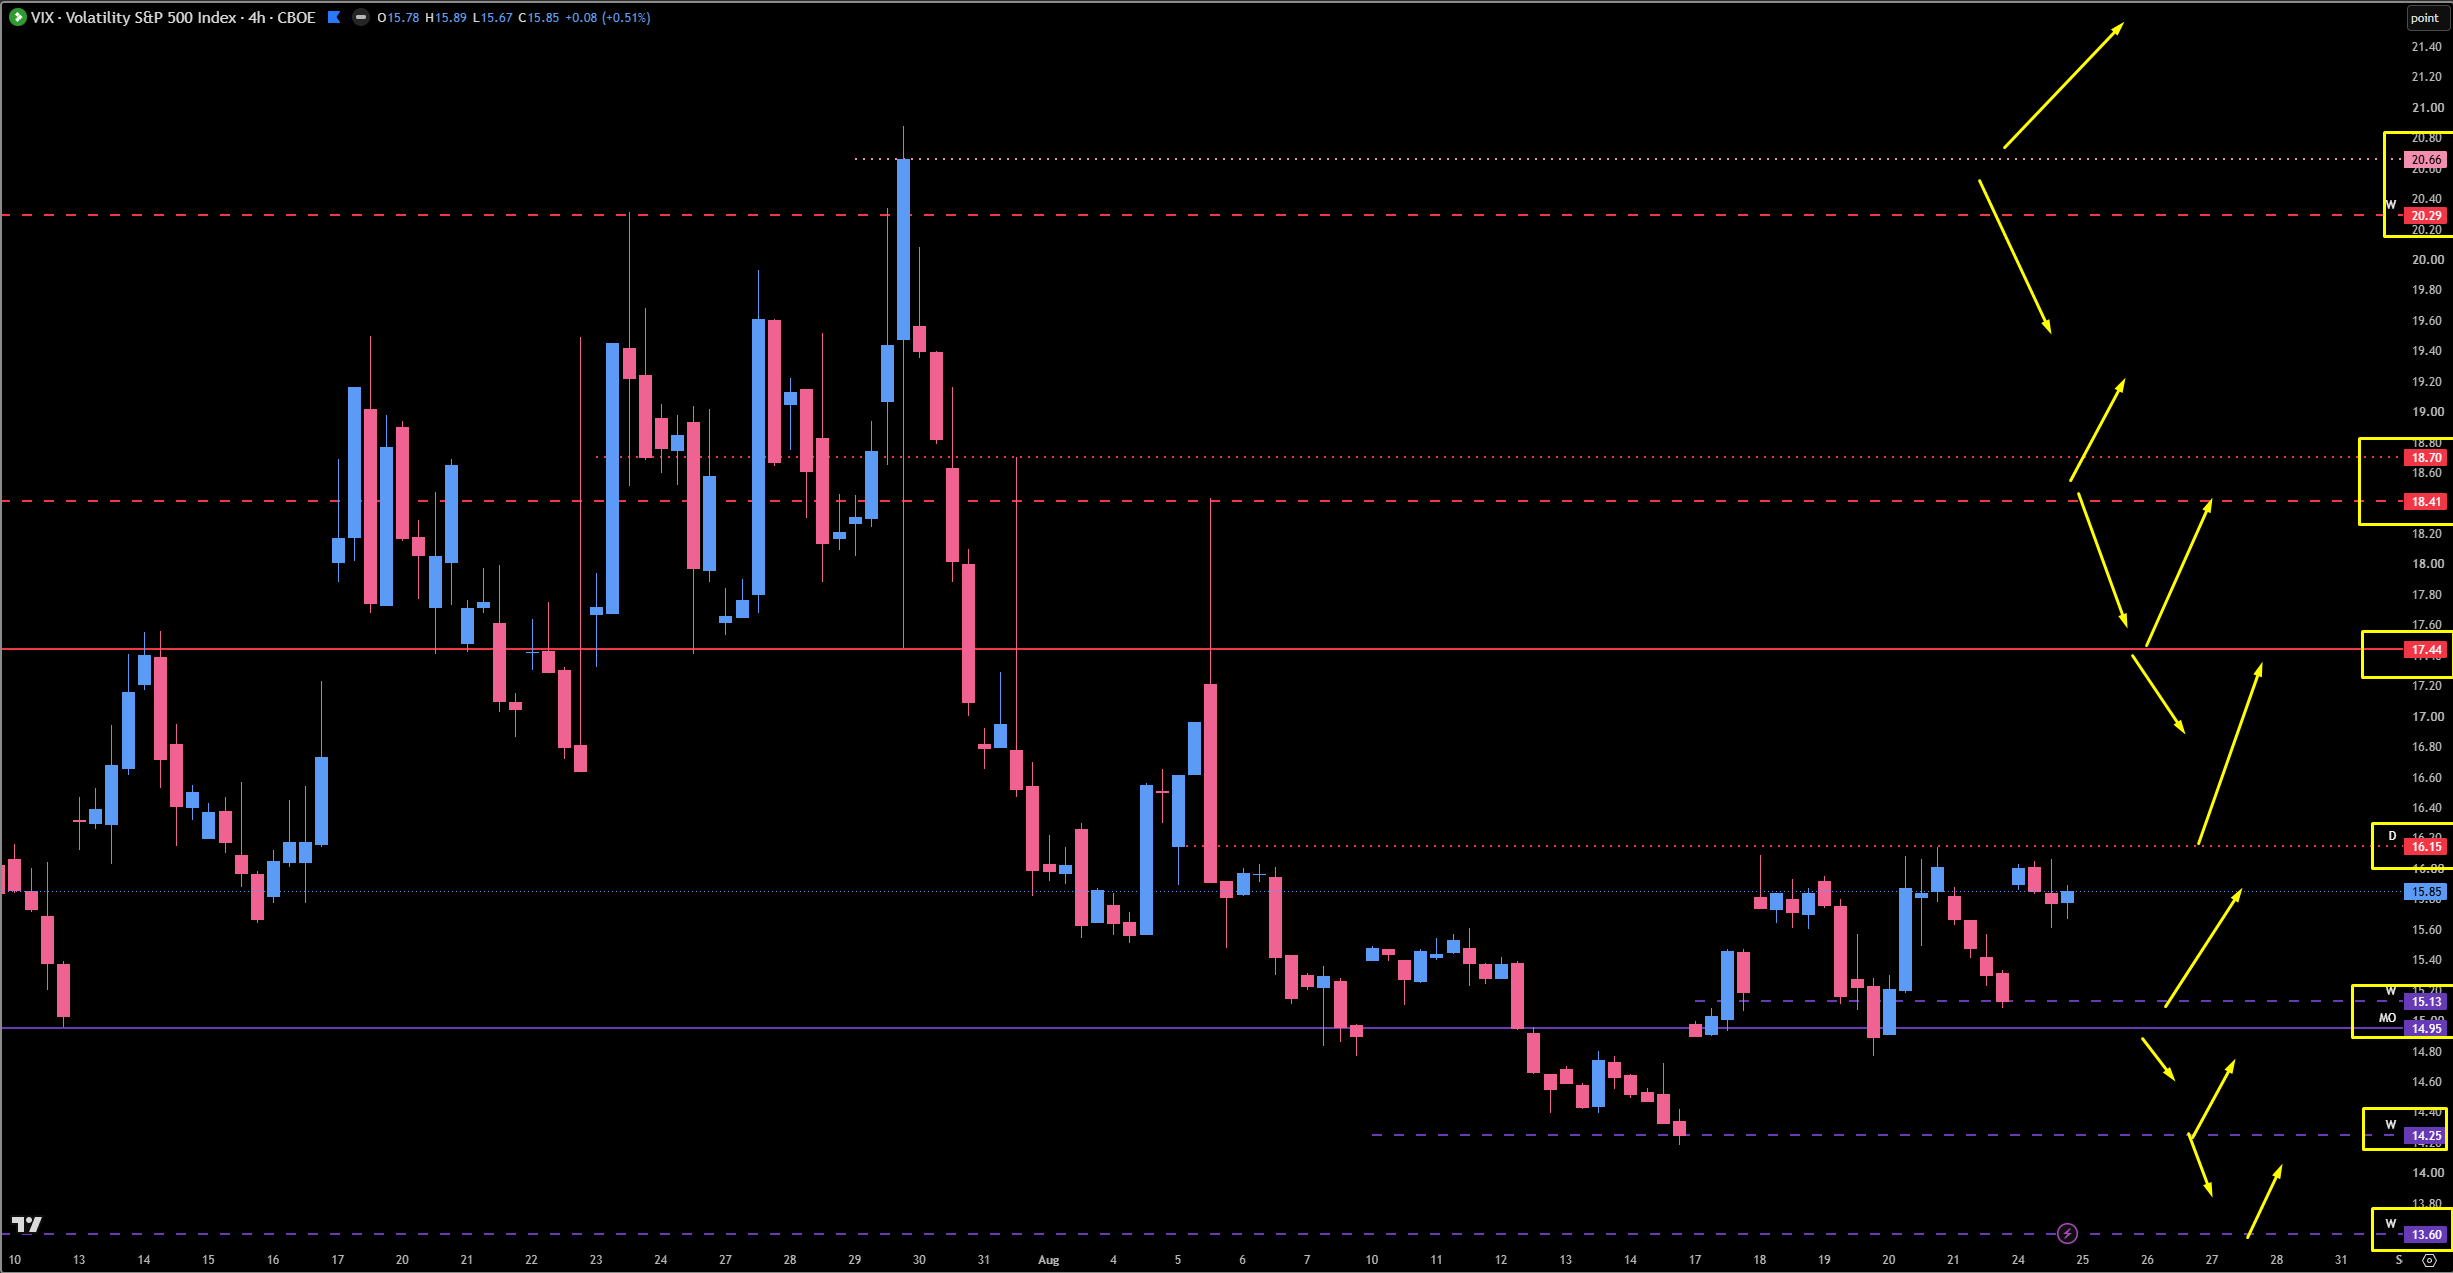
As you guys know, I put out an article a couple of weeks ago saying that every time VIX gets into this $14-$15 handle, we pop. It was just great timing — it came out last Sunday, and the moment it did, the market started to dip lower immediately as soon as Monday opened. We closed down around the $14.50 range, and since then we have maintained above this really critical monthly.
The Floor: 15.13 (Weekly) and 14.95 (Monthly). We need to hold the 15.13 weekly and the 14.95 monthly at the lows. This monthly is holding nicely and has been for quite some time — I am going to continue to lean on it to keep VIX propped up. Just because I am anticipating VIX to take off from down here does not mean it has to happen in one day. We are building volume in here; if you put a volume profile on it, we have probably got a sweet point of control that looks like a perfect bell curve.
The Lid: 16.15 (Daily). This daily is really keeping the lid on things — we have bumped our head on it three times, and my guess is that there will not be a fourth. We will more than likely propel over this, which will indeed send the indices down and give us a little pressure. There is also some support here on a gap fill just below, which is a bit of a flu gauge, but I do like it.
The Air Pocket: Between 16.15 and 17.44 there is nothing but air. Think of what the profile looks like when we get those single prints — the ones where we say we have got to clean that up. That is exactly what this is: a big single print. You can see it in the candlesticks. If they pop 16.15, we should clean that up pretty fast and bring it right to 17.44.
The Big Boy: 17.44 (Monthly). Make sure this level is on your chart. It has been big, it was big, it is big still. As long as we are above 17.44 on VIX, you will see suppression in the indices no matter what. It is just how it works — it is the cycle we are in with this current price. It is tested, so there is a good chance we push through, but given how significant it is, it would not surprise me to get a little reaction.
The Big Untested: 18.41, 18.70, and 20.29 are all tested — nothing untested until we get all the way up to the highest daily at 24.70, which is the move to the low. That will absolutely get a reaction; they will not pop through it on first touch. How far it pulls back is yet to be seen — maybe the 18s — but that area will be a fantastic spot to look for the inverse correlation and a potential long on the indices. If we get up there, that is roughly the equivalent of a 200-to-300-point flush in ES that we get to buy back up. And do not hold me to that math.
🎯 Detailed Actionable Trade Plan (ES Futures)
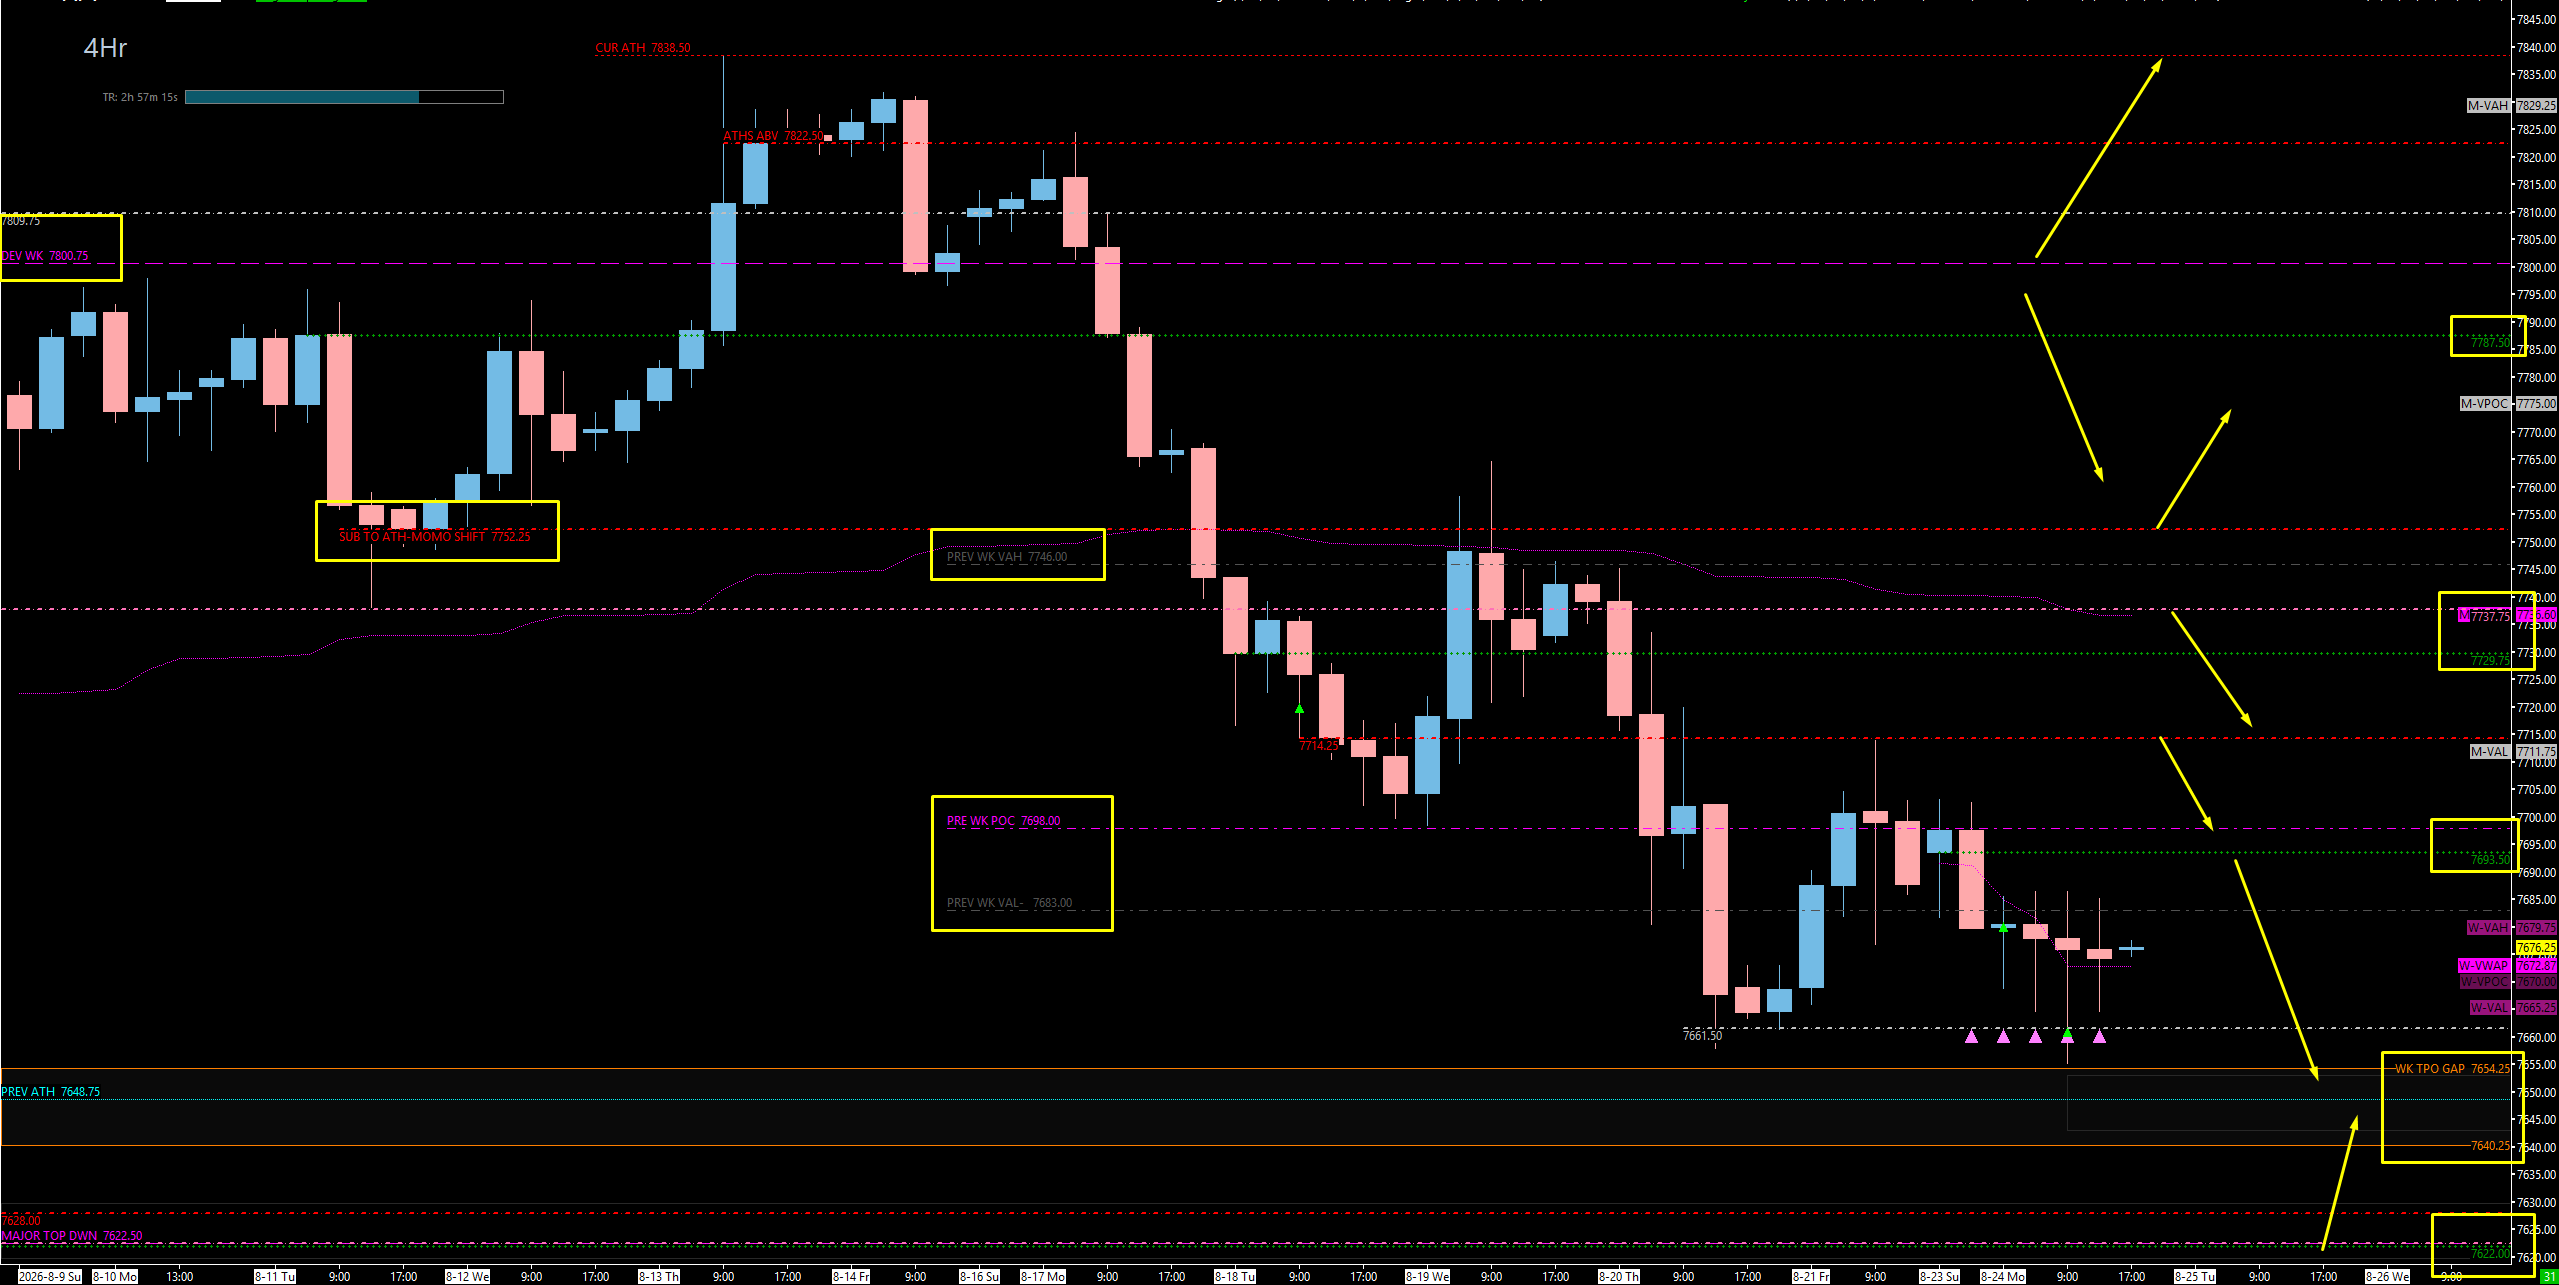
I am still looking to the downside personally, because I want to get into that 7622.50 / 7596.50 buy zone — that is where I am trying to get to, so I am not going to quit shorting. The immediate short is the 7693.50 four-hour sitting right on the Previous Weekly POC and Friday’s POC. My immediate short goes wrong above the 7714 tested daily, and my last short area is the 7729 - 7737 zone where the untested leg-to-the-all-time-high daily lives. Above 7752 we shift momentum and come higher into the weekly. On the downside, take profits through the previous all-time high at 7648, and the real buys are the two major weeklies at 7622.50 and 7599.25.
🔴 Key Resistance Zones & Setups
The Immediate Short — 4-Hour At The Weekly POC: 7693.50 - 7698.00
7698.00 (Previous Weekly Point of Control), 7693.50 (Untested Four-Hour + Friday’s POC).
Context: This is not brain surgery — I am just pointing out the obvious. I have an untested four-hour right here at 7693.50, and look where it is located: directly at the previous weekly point of control, and beautifully placed with Friday’s point of control as well. Look how many times that POC played from the bottom side, and now they are using it for resistance from below.
Actionable Setup: Short Setup: I told you I liked 7693.50 for the short and you best believe I will be short there. I want to see this four-hour play, stay below this area, and we look for continuation lower. As long as this stays below here, I am trying to get short.
Warning: If they push higher and ultimately get above the previous weekly point of control, I start to think I am on the wrong side of this trade.
The One-Hour Continuation: 7703.00 - 7707.25
7707.25 (Highest Untested One-Hour), 7703.00 (Overnight High Reference).
Context: You guys know I hate one-hour levels — I make it very clear in the trade plan that I do not trade reversals off of them. However, I do use them for continuation. And guess what? We are down on all timeframes, so this would be continuation. I still want lower. 7707.25 is the highest untested one-hour and it looks kind of decent — I was looking at it thinking I might have to try that one.
Actionable Setup: Short Setup: Let 7707.25 play, then get underneath 7703 for continuation to the downside — and then just keep adding into it. Add into your winners, guys. I know you will add into losers; try adding into a winner for a change and you would be amazed how much money you can make.
The Momentum Shift Daily: 7714.00
7714.00 (Tested Daily — Played Very Well For Resistance).
Context: We know 7714 played very well for resistance. Look how well it has worked. This is a momentum shift for us, and this is where my immediate short goes wrong and I have to wait for a little bit higher.
Actionable Setup: Above 7714, step aside on the immediate short and wait for the higher zone. On the way back down, 7714 is the next pivot to move us down — once we tap it and get below, it is over and we start coming all the way back into the balance.
The Last Short Area — Leg To The All-Time High: 7729.00 - 7737.00
7737.00 (Untested Daily — Leg To The All-Time High), 7730.00 (One-Hour), 7729.00 (Four-Hour).
Context: This is my last short area, and 7737 is not just any daily. We have played this daily; we know what it is — this is our leg to the all-time high, and it is the same daily as SPX 7709. We keep repeating these levels. Stack the four-hour at 7729 and the one-hour at 7730 with it and this just looks like fantastic resistance to me.
Actionable Setup: Short Setup: If we come up here, I want to see 7737 play and get back under 7714. If we get up in this zone, I could totally see this smacking and coming down to tap the 7714 daily — and then once we get down, it is over.
Warning: Otherwise, we shift momentum above 7752 and come higher into the weekly.
The Momentum Shift Zone — P.W. VAH & Tested Daily: 7746.00 - 7752.00
7752.00 (Very Tested Daily — Sub-Leg To The High), 7746.00 (Previous Weekly Value Area High).
Context: Remember what I said about the value area high: once we get above it, we can easily push up — and why? Because that daily is right there at 7752, and it is very much tested. 7752 was great resistance as the sub-leg to the high and a great pivot to be underneath to keep moving lower. So once we are above that area, we should be able to push much higher.
Actionable Setup: Above 7752, we are no longer in short mode and we have to deal with the levels above. Below it, we continue to make our way lower — at least until we get down into the 7622 area.
The Head & Shoulders Zone: 7787.50 - 7800.00
7800.00 (Massive Developing Weekly), 7787.50 (Resistance Above 7752).
Context: If we get above 7752, we have to deal with 7787.50, and then this massive developing weekly at 7800. If you recall, this is the same trade I pointed out on SPX — look at this beautiful head and shoulders. I think this is the same possible idea up here.
Actionable Setup: Do not forget about this weekly if we end up making a push. If we get above 7752, we will no doubt see it. This is where I would be looking for the big fade if the squeeze runs that far.
🔵 Key Support Zones & Setups
The Bearish Line — Previous Weekly VAL: 7683.00
7683.00 (Previous Weekly Value Area Low).
Context: This is our previous weekly value area low, and really below this area we truly are very bearish. I am going to tell you that right now.
Actionable Setup: We know that if we get below the previous weekly value area low, we are going to continue our move lower. This is the confirmation gate for the downside continuation.
The Profit-Take — Previous All-Time High: 7648.00
7648.00 (Previous All-Time High), plus the Weekly Gap below.
Context: As you know, we have that previous all-time high right here at 7648, and this is the weekly gap area we are after down below.
Actionable Setup: Take Profits: If you are short, I would highly recommend taking profits there on the way through. That is a proven pivot and a logical place to book part of the move.
THE BUY ZONE — Two Major Weeklies: 7596.50 - 7622.50
7622.50 (Major Weekly — Corresponds To SPX 7582), 7599.25 (Major Weekly), 7596.50 (Zone Floor / 50-Day Moving Average Confluence).
Context: This is my zone. This is my buy zone, and honestly this picture is even clearer than SPX. I have two major weeklies here. On the first one at 7622.50, everything is there — I have a daily, I have a weekly, I have a four-hour, I have an old daily to play for a bounce, and we have all-time-high confluence we can use for a trigger. There is a lot to work with. On the second one at 7599.25, we have the same thing going: another massive weekly with huge structure from the left, multiple taps underneath it, and you can see multiple taps from the bottom side on the daily too — boom, boom, boom. Lots of confluence. And look, the 50-day moving average is right here. You guys know I am not a moving-average guy and I do not really care about them, but I know many CTAs love the 50-day and they will buy it just because their strategy tells them they have to — so when it lines up with something I already have, I like it a lot. It is currently at 7586 and less than 10 points from 7596.50; by the time it gets there it should be right about on it. I do believe those first weeklies are going to get some love.
Actionable Setup: Buy Setup: These are my two real buys and where I stop worrying about the short side entirely, because at that point we come into major support. If we really want to continue this bullish structure, we need to pull in no deeper than 7596.50 and then reclaim 7622 to get our targets back to the upside.
Warning: If we push underneath this zone, you see what happens — we are in that massive range again and we could easily get sucked back down, and then we have to work that whole thing out. I stared at the profile pretty hard, and it is possible.
The Deeper Spot: 7507.00
7507.00 (Deeper Support — Same As SPX 7464).
Context: I do like this area at 7507. I like it a lot — it is the same spot I showed you on SPX at 7464. But that does not mean this one plays instead of the zone above.
Actionable Setup: Conditional Long: This is the fallback if the weekly buy zone fails and we get sucked back into the range. Everything between here and the buy zone is really just filler — these are my two real main buys, and this deeper one is the backstop.
📌 Cheat Sheet – Key Levels Recap
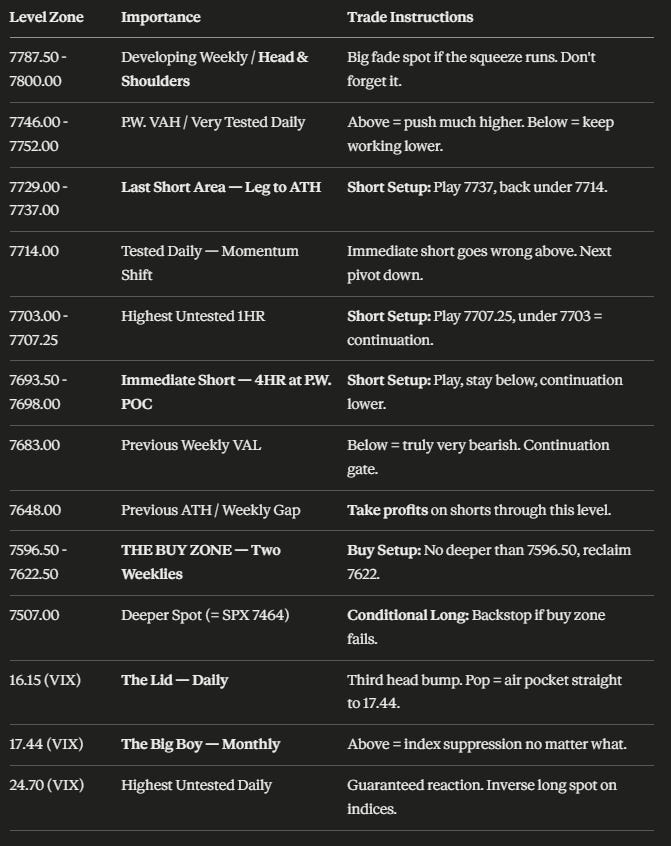
🧠 Final Thoughts
Let me make the framework as simple as I can, because none of the gained-or-lost bookkeeping matters right now. As long as we are below 7746 on ES, we are pointed down. Below 7698, it is even more down. Under 7683, even more suppression. That is your whole map. I am still looking to the downside personally, because I want to get into that 7622.50 / 7596.50 buy zone — that is where I am trying to get to, and I am not going to quit shorting until I get there.
The trade sequence is clean. The immediate short is the 7693.50 four-hour sitting right on the previous weekly POC and Friday’s POC. If they pop, the 7707.25 one-hour is a decent continuation entry — let it play, get under 7703, and add into the winner. My immediate short goes wrong above 7714, and if they run it further, my last short area is 7729 - 7737 where the untested leg-to-the-all-time-high daily lives — I want to see 7737 play and get back under 7714, and once we get down, it is over. Above 7752 we shift momentum and I stop shorting entirely; at that point we just wait for the edge up at the 7787.50 - 7800 head-and-shoulders zone. On the way down, take profits through the previous all-time high at 7648, and then the two major weeklies at 7622.50 and 7599.25 are where I flip and start fishing for longs — pull in no deeper than 7596.50, reclaim 7622, and we get our targets back to the upside. Lose that zone and we get sucked back into the massive range, and then we have to work the whole thing out.
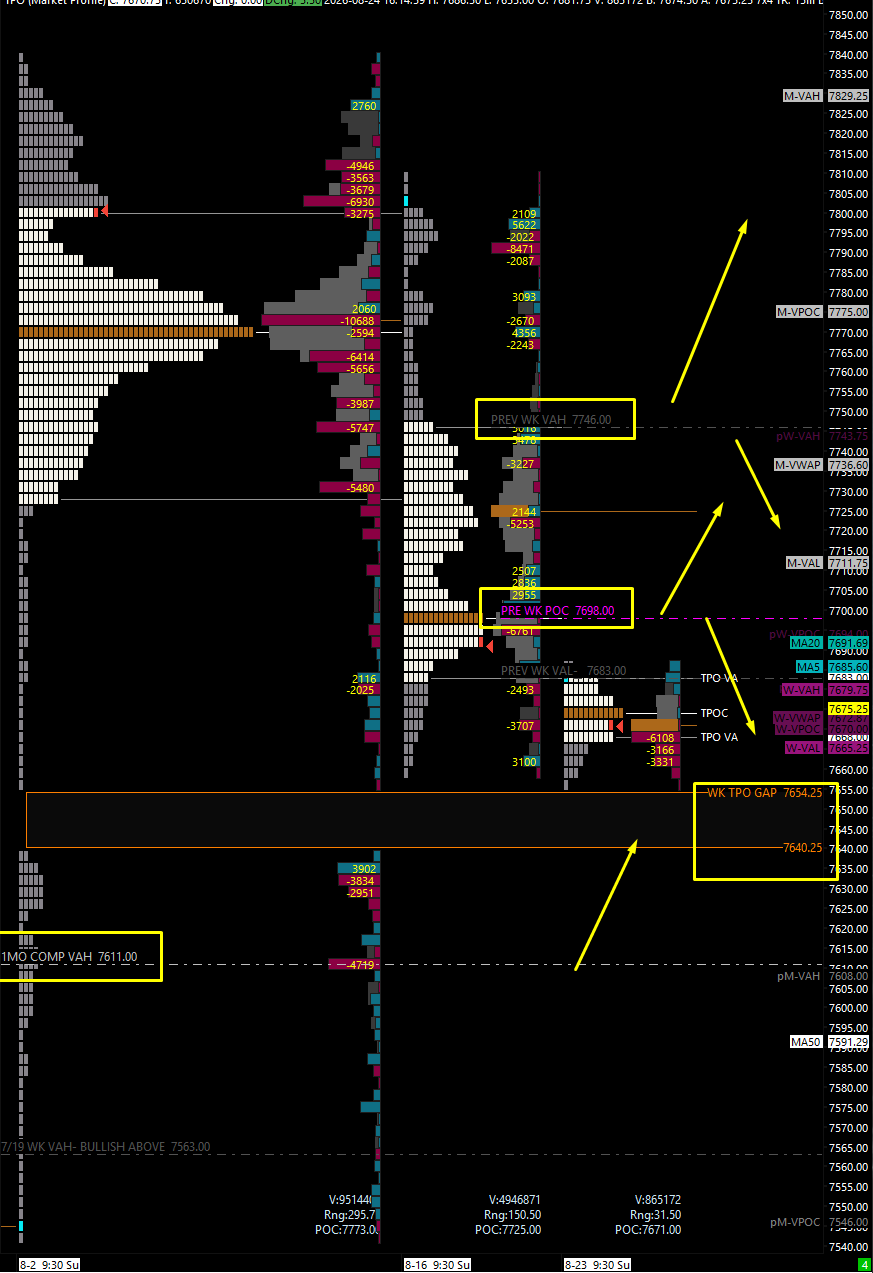
Keep VIX front and center as the tell. We are holding the 15.13 weekly and 14.95 monthly at the lows, and we have bumped our head on the 16.15 daily three times — my guess is there will not be a fourth. If it pops, there is nothing but air up to 17.44, and above 17.44 you will see suppression in the indices no matter what. And if we ever run all the way to that 24.70 untested daily, that is your inverse-correlation long on the indices — that is a 200-to-300-point flush we get to buy right back up.
Just as a heads up: I am going to do the trade plan tomorrow morning. I know most times I do the Weekend Review on a Sunday and you do not get a plan on Monday, so do not worry — it is coming. I am back, I am here, I am ready to get loose, and I need to make some money. Thank you so much for joining me tonight. You guys have a fantastic evening.
Until next time—trade smart, stay prepared, and together we will conquer these markets!
Ryan Bailey, VICI Trading Solutions.
📊 TradingView Indicator String
Copy and paste the levels below into your S&P Edge Levels indicator to automatically plot today’s key levels on your chart:
7800.00|WK|W
7752.00|Tested D|TD
7746.00|P.W. VAH|GD
7737.00|D|D
7730.00|1HR|1H
7729.00|4HR|4H
7714.00|Tested D|TD
7707.25|1HR|1H
7693.50|4HR|4H
7683.00|P.W. VAL|GD
7622.50|WK|W
7599.25|WK|W


