

Welcome back, everybody — Chef Bailey in the house. And for my crew, this one is for you: I have got a custom little Yes Chef hat, and I figured everybody in the room would appreciate that.
As we come back on Sunday for another fantastic Weekend Review, let’s recall what happened. Last Sunday we called all-time highs, and we were looking for a potential smack from 7799 to take us down into the daily at 7737. And we touched that 7737 perfectly after smacking from our significant four-hour at 7799, just as the plan foretold. Of course, we made a new all-time high, satisfying the requirement from our process — another beautiful display of trade plan amazingness. Friday we got a little pullback, and right now we are back in the middle of balance.
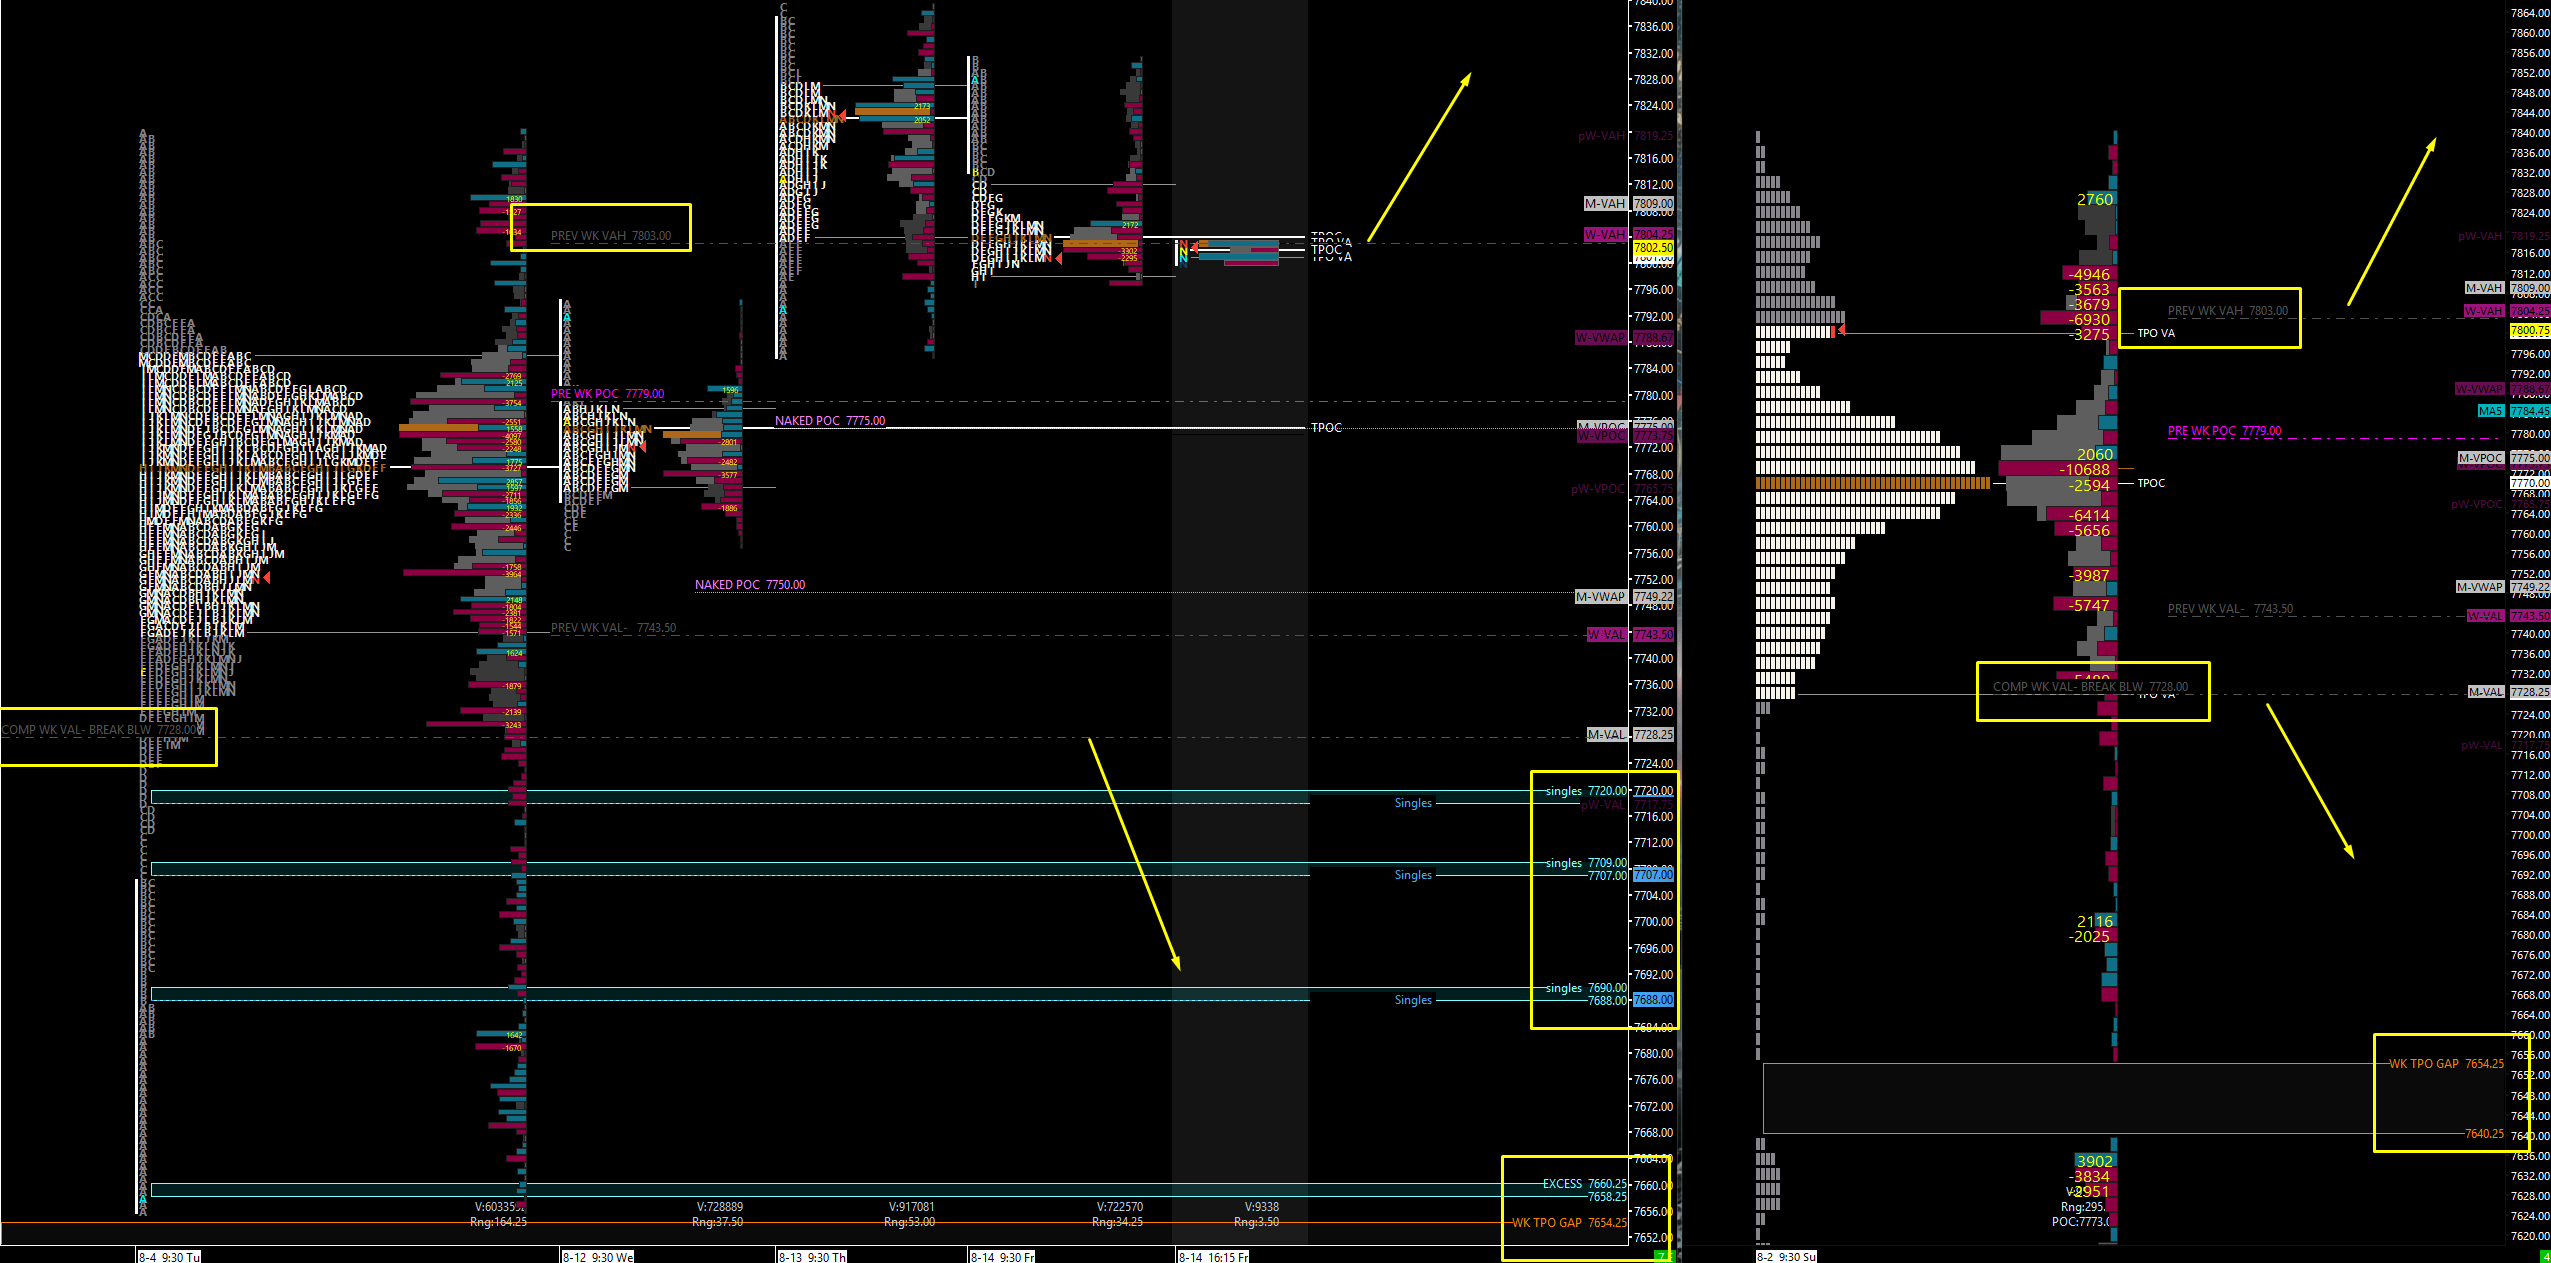
So let’s look at the levels and figure out exactly what we are going to play. I am going to take a look at VIX, SPX, and then we will do a little ES and get right into it.
☕ FREE RESOURCE — The SPX Morning Brief | Delivered 5:45 AM EST Take advantage of this. Every morning at 5:45 AM EST, the SPX Morning Brief hits your inbox with everything you need to understand the significant value levels on SPX, over 150 indicator prediction assessments, and the top 5 news articles of the day. It is a fast read that gets you fully prepared well before the bell. It is free — all I ask is that you let me into your inbox. Sign up now → https://pages.vicitradingsolutions.com/spx-edge
A Note on This Week’s Market:
News: I went ahead and looked — we do not have any news this week. We have FOMC minutes on Wednesday, and we already know what happened with FOMC, and that is it. So do not expect a scheduled catalyst; the moves this week will come from structure, not headlines.
Volume: We were in ridiculously low relative volume last week. I hope that does not continue this week, but it is a probability, guys — we are in summertime trading, no question about it.
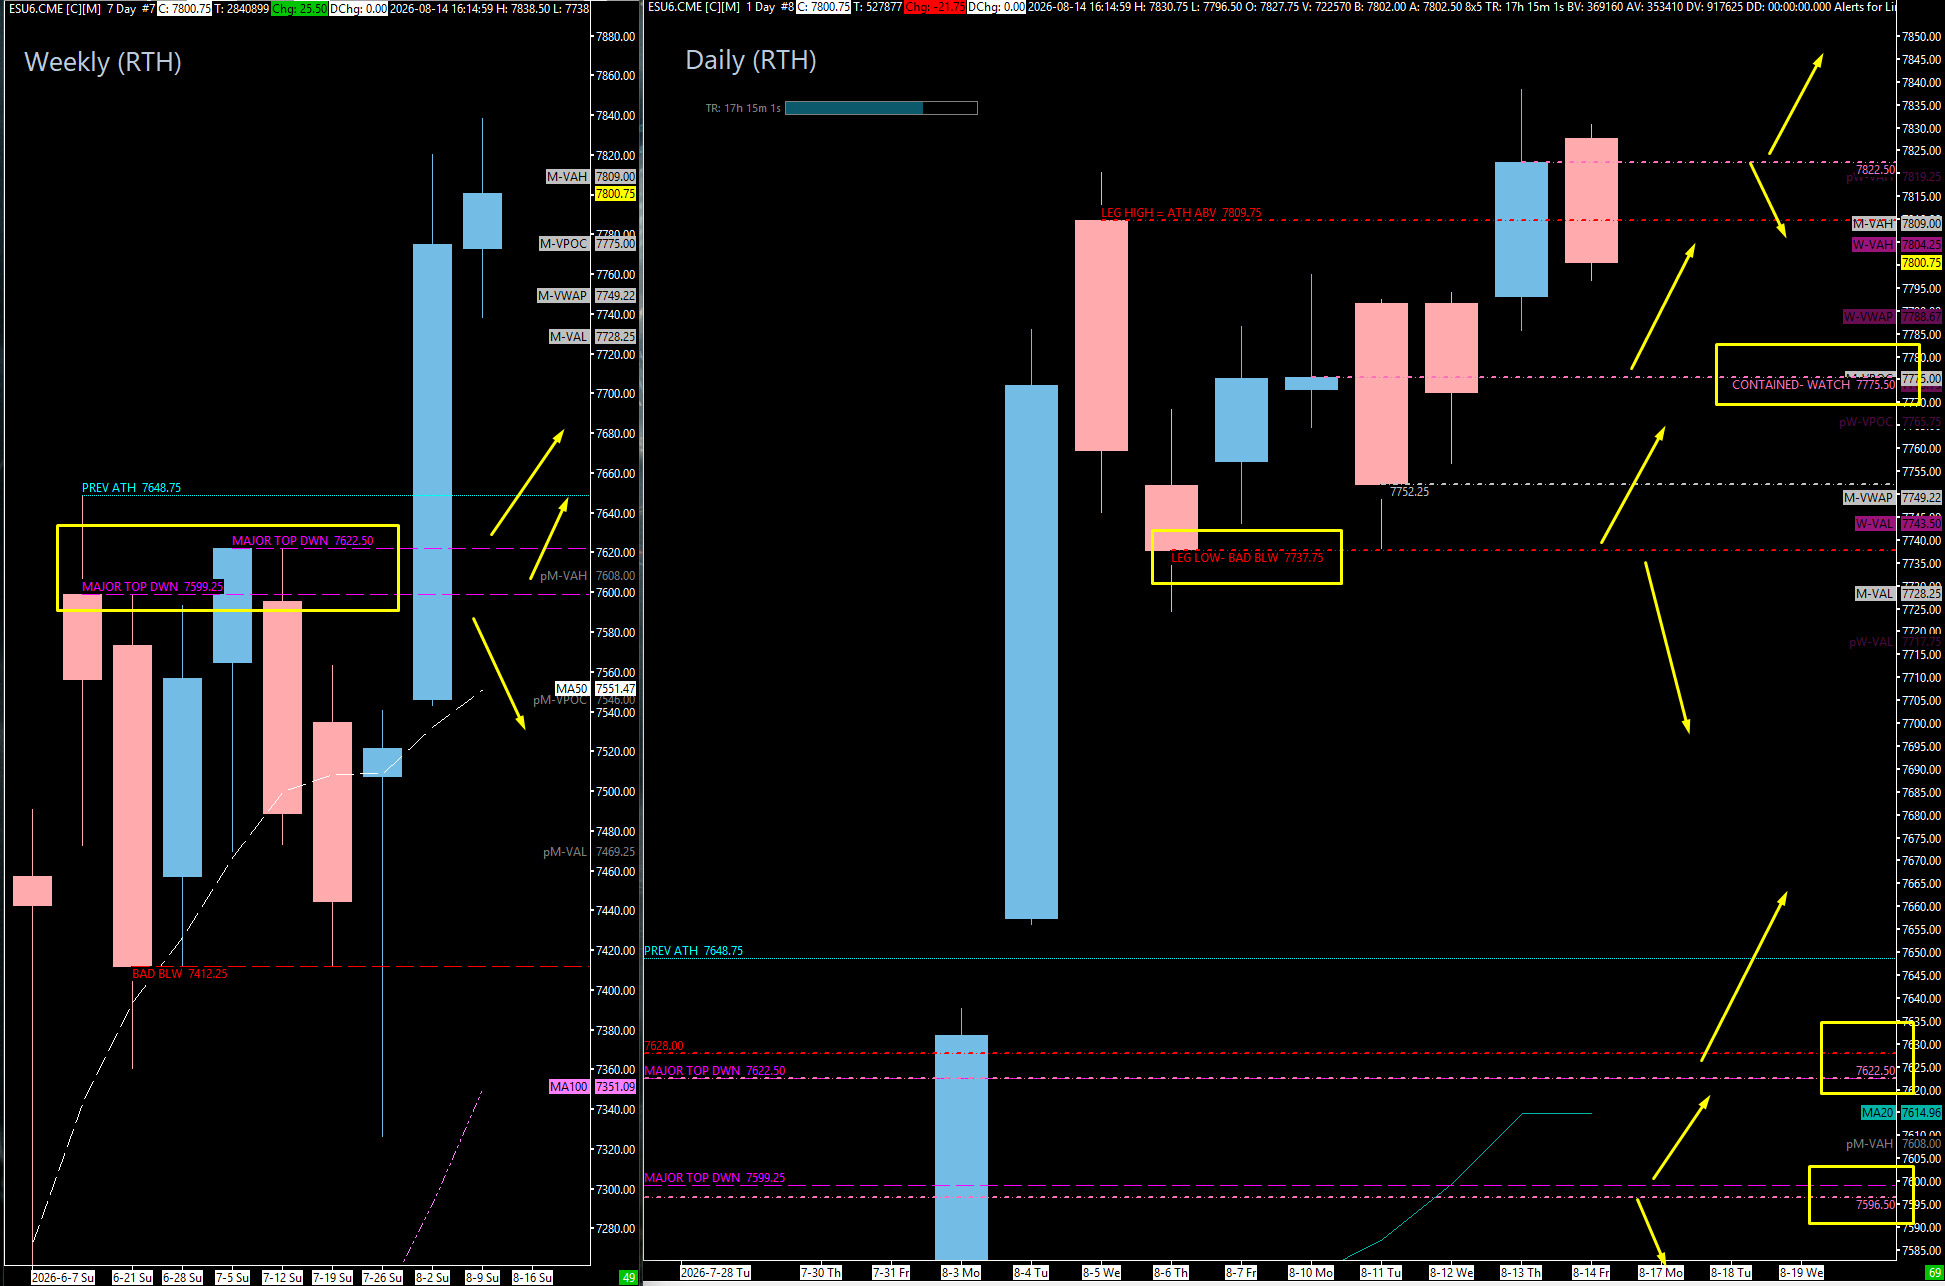
Range: This is balance on balance. The weekly profile shows that massive push week out of the eight-week range, then we sat balanced at the highs, and then this past week essentially overlapped that same area. We have some really overlapping values and we are starting to accept price at the highs again — which is pretty common for a bullish move. Below 7728, we start to come down again into a massive inefficiency that runs all the way to the weekly gap at 7640 and truly even lower.
Gamma: We are in a Positive Gamma environment. All-time highs, summertime, positive gamma — this is the perfect cocktail for sleepy-time trading. I just want to prepare you for what is likely coming this week.
Trend: Up on all timeframes. We have no reason to believe otherwise and I am looking for buys — I am not bearish, period. But do not get overly complacent, because a knee-jerk reaction in VIX could send this market down sharply. Be patient, let it do its thing, and look to buy it — especially on the bounce, or even let it bounce and then retest, and then you know we have got it.
🧠 Current Market Context
Balance On Balance & How This Market Actually Moves
Do not forget how this market works, because it explains the entire week. We balance sideways for weeks. We make a push up. We balance sideways for a week or two. We make a push up. Then we balance again. Sometimes we come back down, we balance, and then we go back up. That is essentially how it works — and that is exactly what we have been doing. We had that big massive move, we pushed up, we moved sideways, we pushed up, and now we are coming back down. The question is: do we hold in this area for our next push up? Right now, I would say the probabilities lean toward yes.
On the ES weekly profile, this was the massive push week that took us out of that huge eight-week balance range, then we sat balanced at the highs, and this past week overlapped right into the same area. That gives us really overlapping values and price accepting at the highs again. Right now we are directly back in the middle of things, which honestly reduces the opportunity for a big move in my opinion — but you never know. The way to think about it: we are coming from the edge right outside of value, and price is currently rotating back into value. That is exactly how we trade right now — where is our next edge at? Below 7728, it all goes bad and we come down into a massive inefficiency; as long as we stay above it, we remain bullish, stay in balance, and potentially go back into price discovery mode.
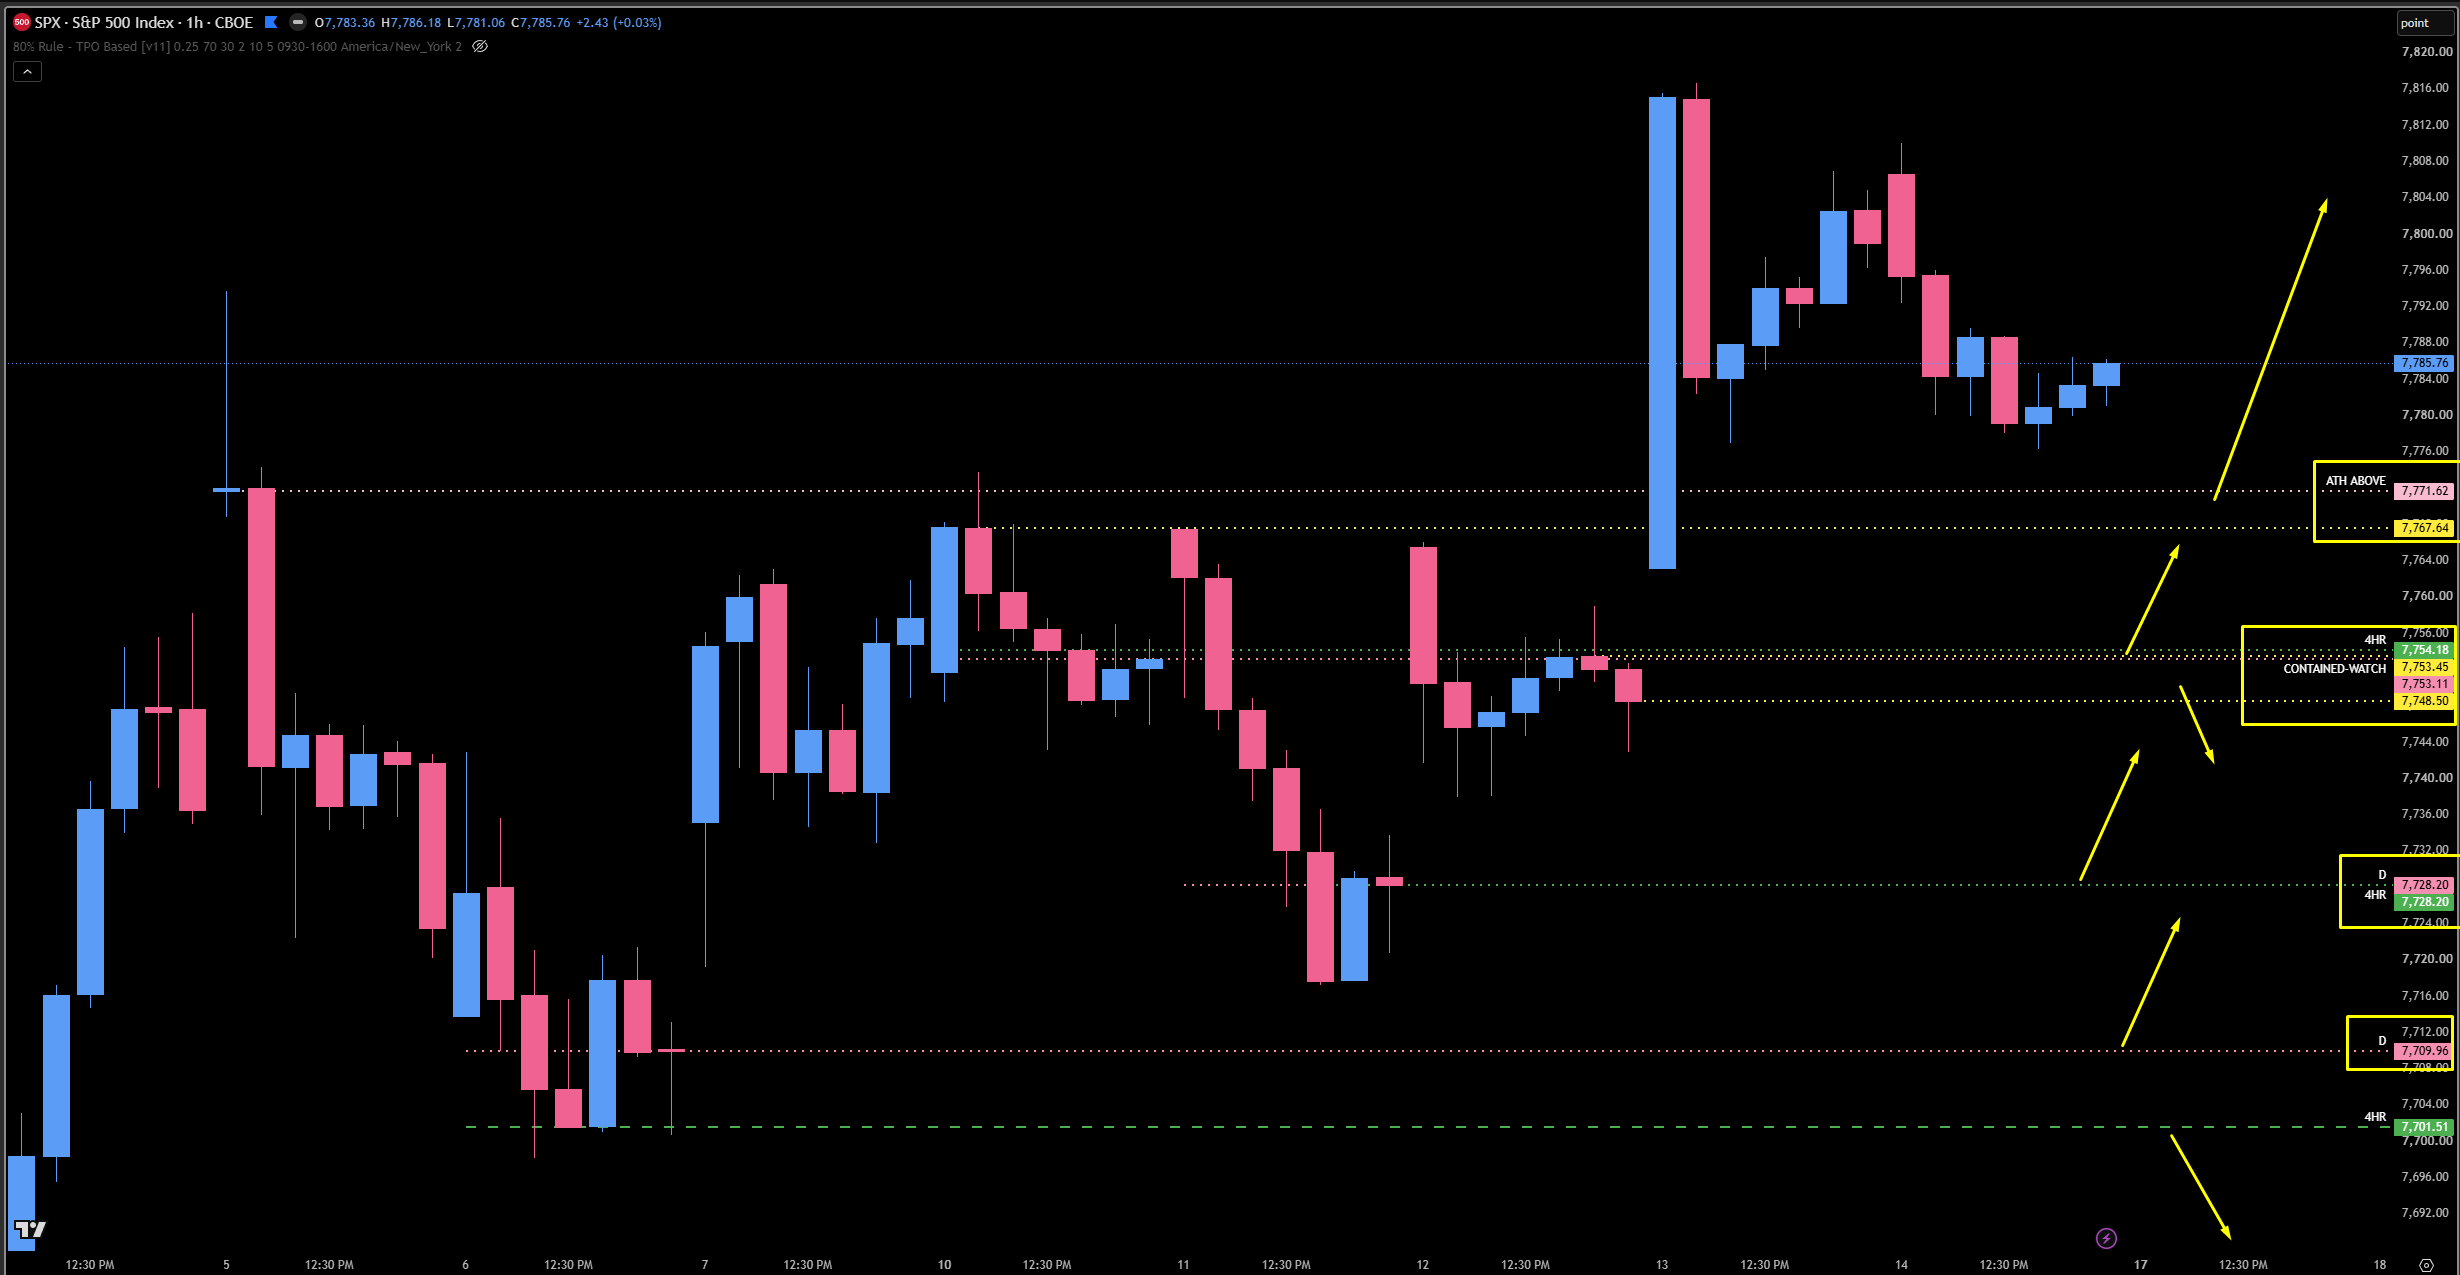
On SPX, we are still trending very much to the upside — a massive eight-week balance, then a huge push up, then sideways for a week again. Are we done making all-time highs? I do not know. Probably not. But what we do know is that we have plenty of support to play and we know exactly where things go bad. The first area is the 7771 big all-time-high daily that we struggled so badly to get above; once we popped it on Thursday it led us much, much higher, and it is still very much untested on first touch if we come back down. Below that, around 7767, is where momentum starts to shift back — as long as we stay on the upper side of it, we will have no problem pushing higher. If they do come below 7767, I really like the zone between 7748 and 7754, where we have dailies, four-hours, and one-hours all stacked in here. What we want to see is that play and get back above 7771, and then they take right back off for new all-time-high price discovery. If we push below 7748, we have another daily and a four-hour at 7728 — very much a gap fill, very much untested. We did not get a chance to play it Wednesday; they actually missed it, coiled through the day, and then we gapped up higher. I would not ignore it. Watch for 7728 to play, with our big first target at the 7753-7754 area, then look for continuation to the upside. And then our last spot: 7709, our final untested daily. That low was the daily on ES at 7737. If it plays, we need to get back above 7728 — this is our lowest untested spot and really the move to the high, so it needs to hold. Below that, we have the daily at 7609, which I really like and which even fills a little gap, then the 7580 / 7572 spot down into 7554 (a 30-point zone I am lukewarm on), and finally the 7516 weekly, which poses some problems. I do not want to see us get back below 7580 if price pushes below 7700 — that needs to hold if we are going to maintain our real bullish stance higher. If we get down into 7516, I would be concerned, because at that point everything above becomes resistance and just another hurdle to get back above; we could easily get rejected, stay in that massive eight-week range, and get sucked right back in.
🚨 VIX Analysis: The 13.60 Floor & The Knee-Jerk Risk
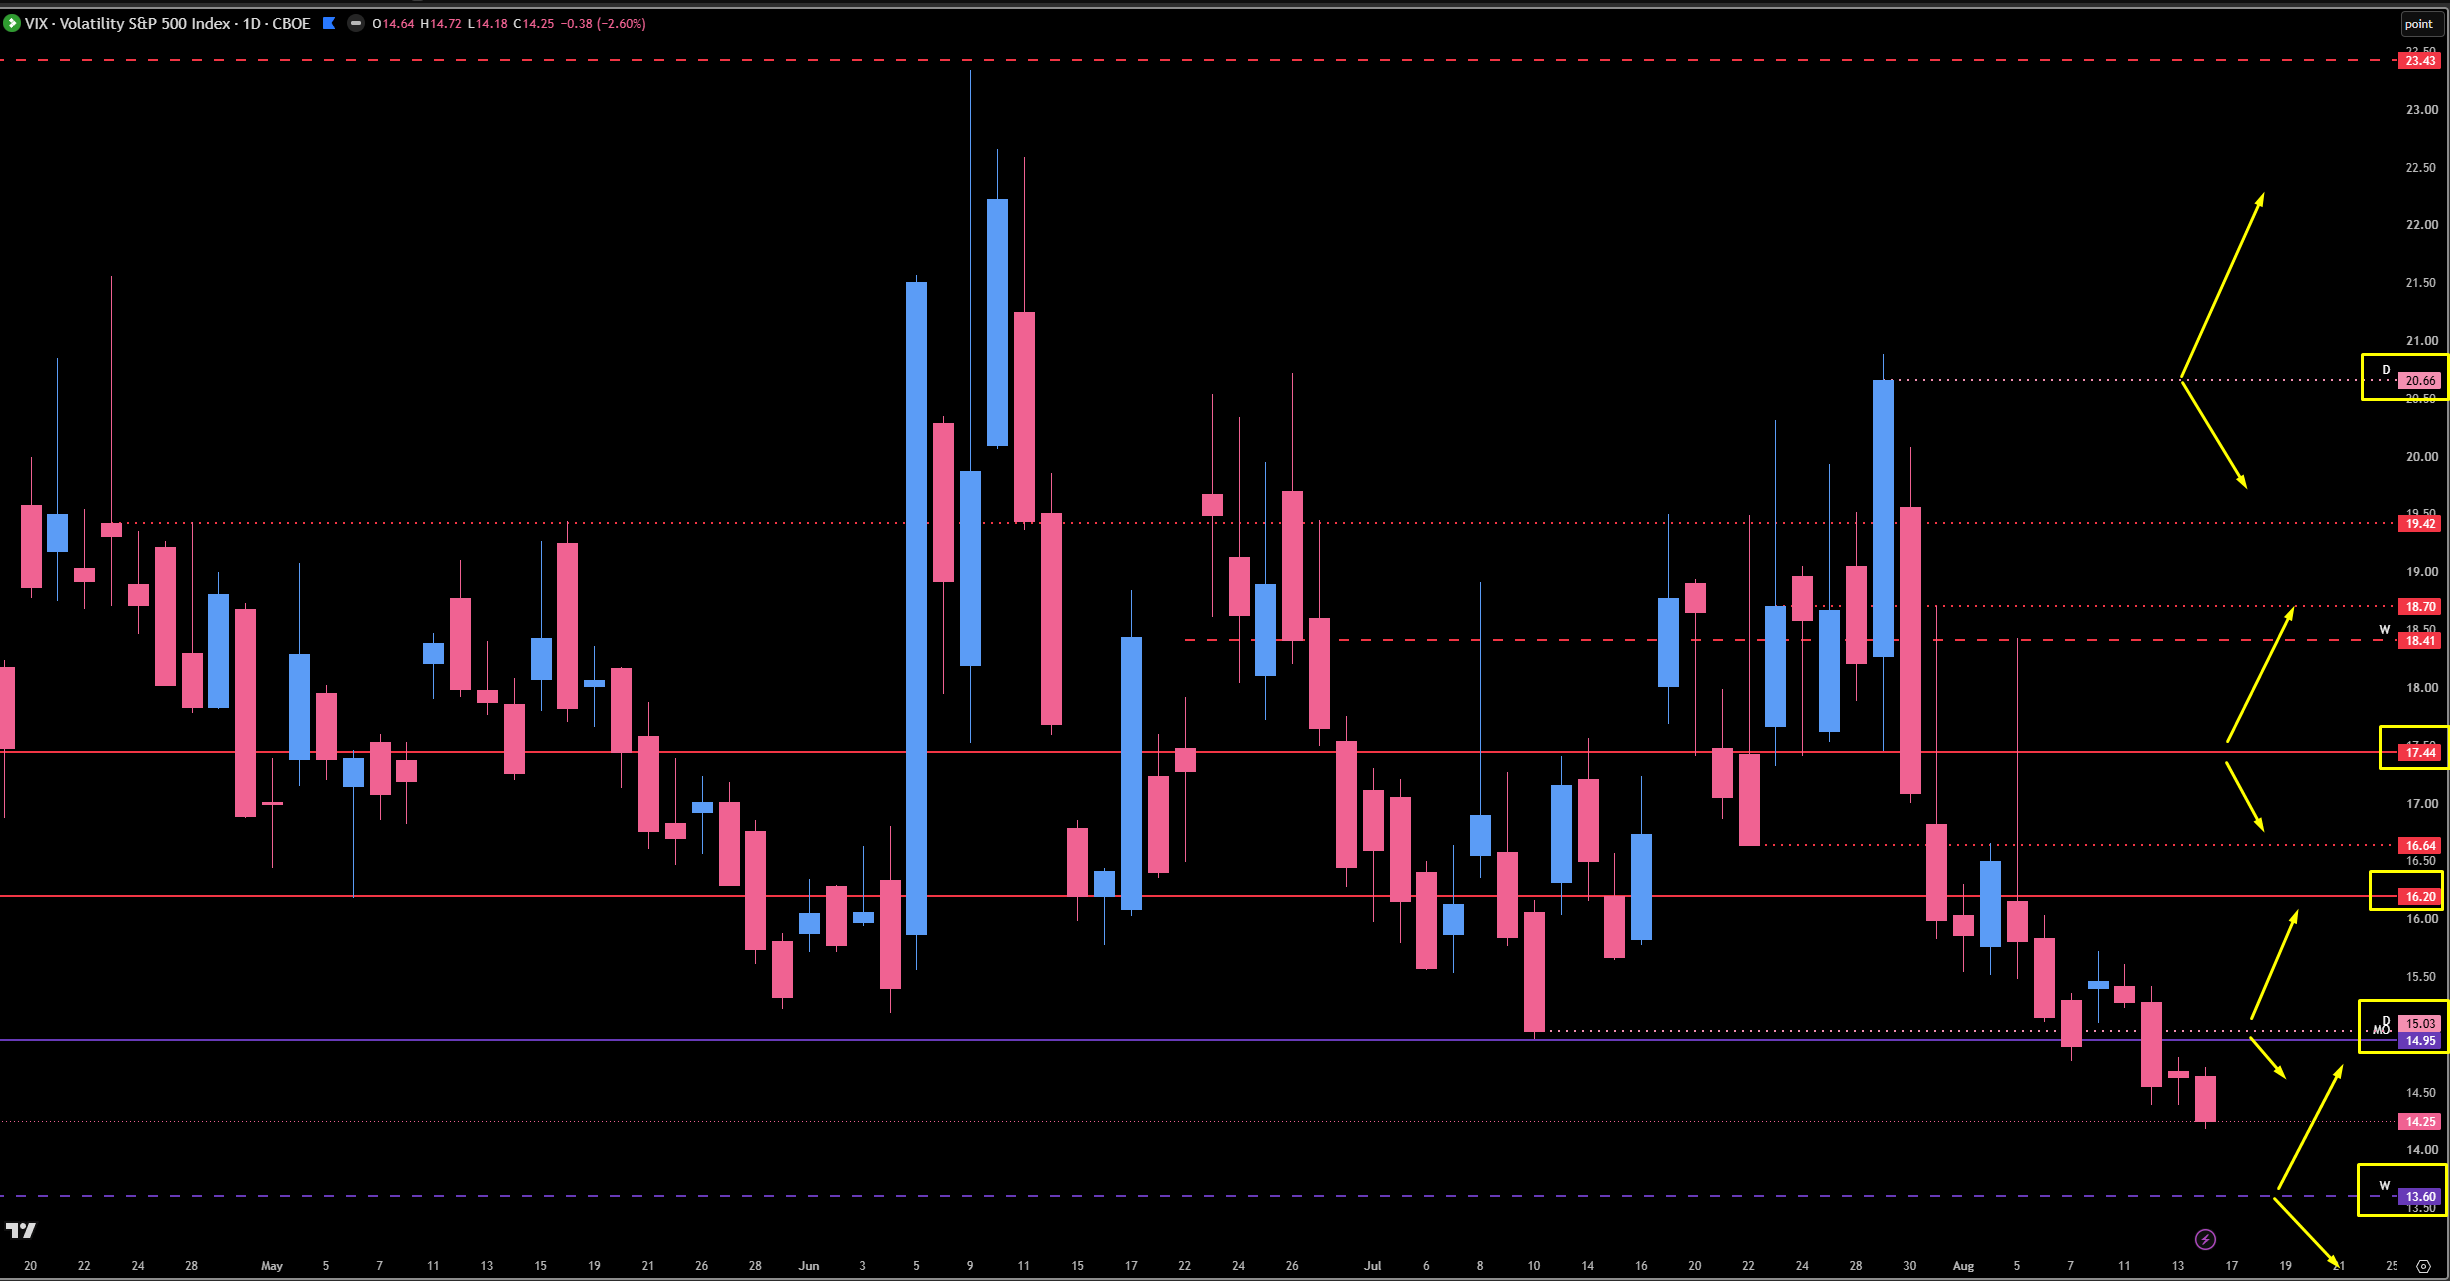
This thing is so suppressed. I am actually going to put out an article today that is not bearish — please keep that in mind. I am aware we are trending at all-time highs, and I am not bearish by any means. But all I am referring to is this: when VIX gets this low and we are cruising to all-time highs, we are due for a knee-jerk reaction off of VIX. They could easily send the S&P down 1% to 2%, slicing through all kinds of levels, only to get bought right back up again. This is a very healthy ordeal, guys — I am simply showing you because I do not want anyone to be complacent and think we can only go long and that is the only thing to look forward to.
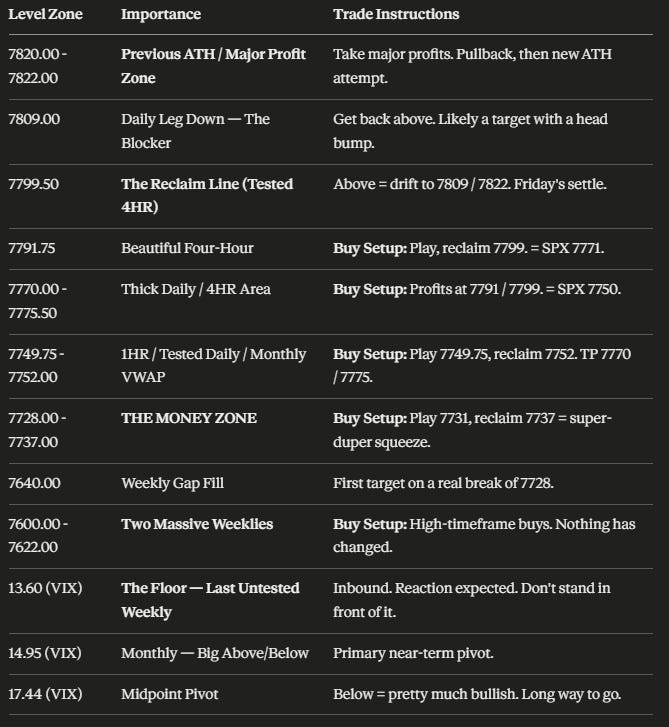
The Floor — Last Untested Weekly: 13.60. This is my last untested weekly support, and I do truly believe this area is going to get a reaction. 13.60 is inbound. If it happens, do not stand in front of the indices if VIX starts to really take off from down here.
The Big Above/Below: 14.95 (Monthly). This is going to be our big pivot to get above or below. 13.60 is the floor and 14.95 is the big above/below for the near-term picture.
The Midpoint Pivot: 17.44. As we have said before, this remains our big midpoint pivot — as long as we stay below it, we are pretty much bullish. We have a long way to go before that happens.
The 20% Math: An easy 20% pop from down here could take us all the way back into the $18 range — which would still easily be sold off and would take the indices right back up higher. So the pop is not the end of the world; it is just normal market mechanics. When this thing gets too far down, it will rebalance out, which obviously plays with the indices and sends them down — only for us to have another fantastic buying opportunity.
🎯 Detailed Actionable Trade Plan (ES Futures)
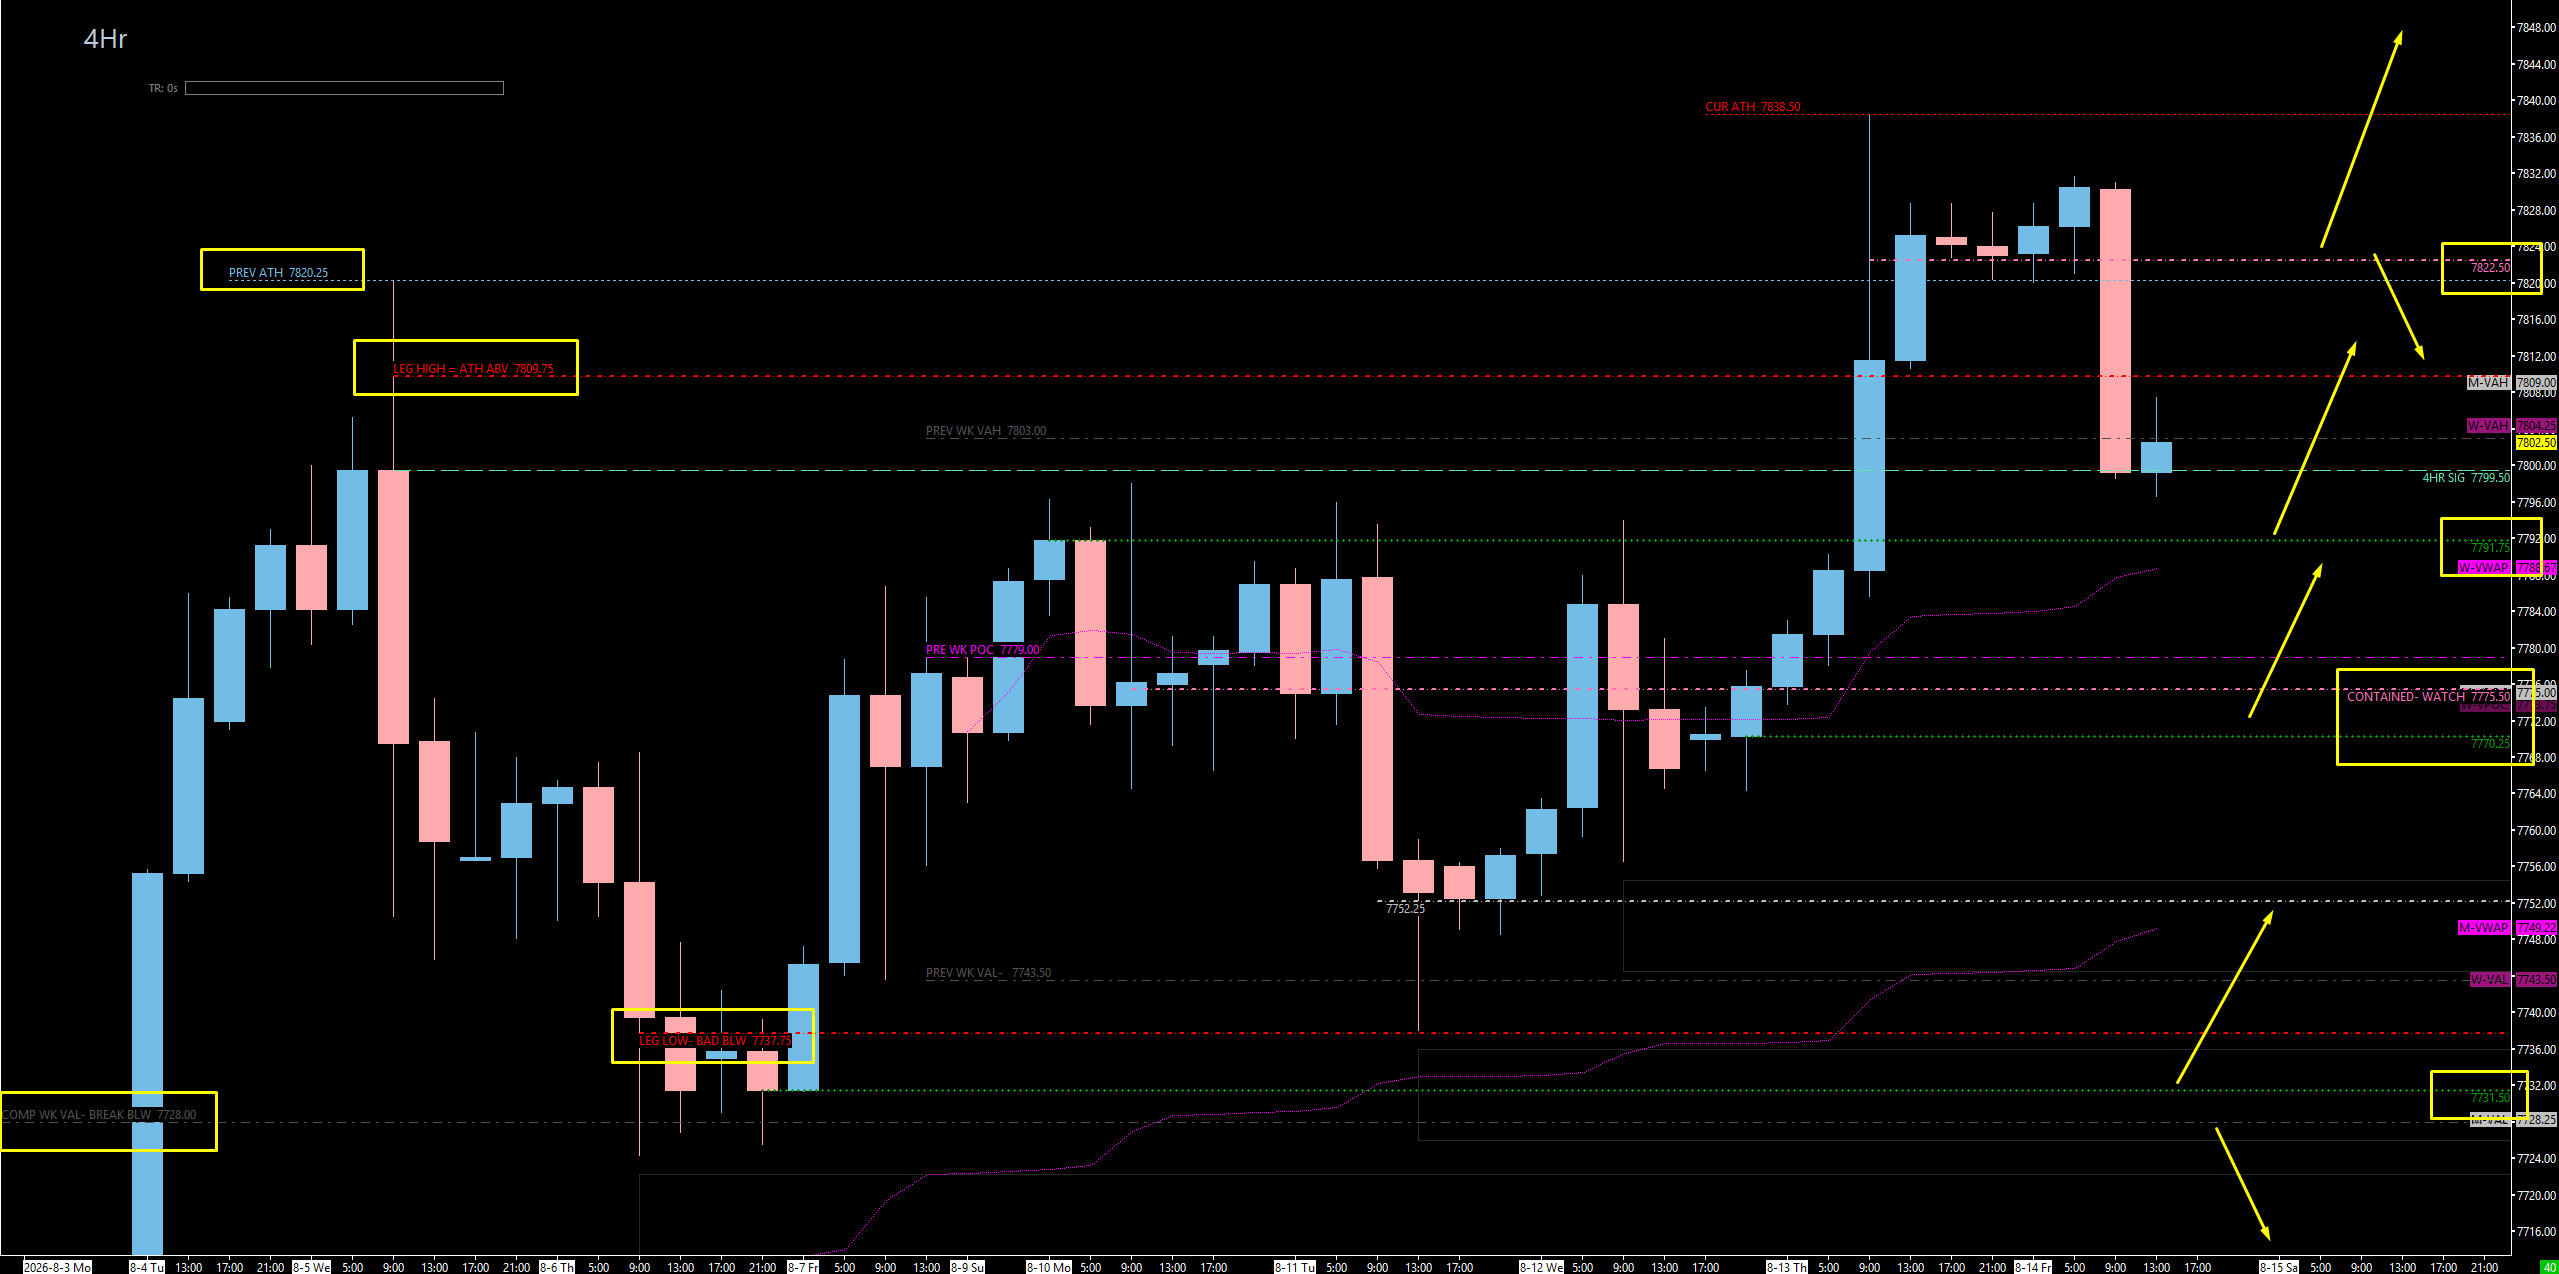
We are looking for buys with a defined ladder and one line where it all goes bad. The reclaim line is 7799.50 — the significant tested four-hour price settled directly on Friday. Above it, we drift back toward 7809 and the big profit-taking zone at 7820 - 7822. Below, we work the ladder: 7791.75 first, then the thick 7770 - 7775.50 daily/four-hour area, then the 7749.75 - 7752 one-hour and monthly VWAP confluence, and finally the money zone at 7728 - 7737, where the 7731 four-hour with a 7737 reclaim trigger is the setup I like most on the whole board. Things go south underneath 7728 — and they go south very fast.
🔴 Key Resistance Zones & Setups
The Reclaim Line — Significant Four-Hour: 7799.50
7799.50 (Tested Four-Hour — Friday’s Settle).
Context: This is the big one that has already been tested. We actually played it on Thursday for the push higher on the retest, and then ultimately they settled directly on it on Friday. It is our significant four-hour, and it is the gate for everything above.
Actionable Setup: If 7791.75 below is going to play, we want price to get back above 7799. Once we are back above this significant four-hour, we could potentially drift higher, back above 7809 and potentially all the way up to 7822.
The Blocker — Daily Leg Down: 7809.00
7809.00 (Daily Leg Down — Support Lost).
Context: This is going to be an interesting blocker for us. It is clearly support lost here, and it is a daily leg down. My only thing is that we are still up on all timeframes — so this may just be a target with a small head bump, or at least that is what my process tells us it should be.
Actionable Setup: I want to get back above 7809 on the long from below. Treat it as a level to clear rather than a place to fade, given the trend structure.
The Major Profit Zone — Previous All-Time High: 7820.00 - 7822.00
7822.00 (Upside Target), 7820.00 (Previous All-Time High).
Context: This is a very important spot. If you recall, on Friday we basically touched 7820 and stayed above it all night long in a very tight 10-point range, and ultimately they broke it and came down. That makes it a proven pivot.
Actionable Setup: Take Profits: I am going to take major profits here at 7822 and 7820, look for a little pullback, and then obviously try to get a new move into all-time highs. This is the objective for the long ladder below.
🔵 Key Support Zones & Setups
The First Buy — Beautiful Four-Hour: 7791.75
7791.75 (Four-Hour).
Context: We have a beautiful four-hour right here that I am not going to be quick to jump out of the car on. This is the same spot that lines up with my SPX daily at 7771 — they align nicely.
Actionable Setup: Buy Setup: If 7791.75 is going to play, we want price to get back above 7799. From there, drift higher back above 7809 and potentially all the way to 7822 and 7820 for major profits.
The Thick Area — Daily & Four-Hour: 7770.00 - 7775.50
7775.50 (Daily), 7770.00 (Four-Hour).
Context: If we move underneath 7791.75, we do have this thick area. These levels should be familiar to most of you because we talked about them in the plan and in the Inner Circle — we were looking for this area to get played before the big push up on Thursday, which did not happen. But that is okay, because if it plays now, we could still potentially work it. This is the middle spot that lines up with the 7750 area on SPX.
Actionable Setup: Buy Setup: Look for this daily/four-hour combo to play on a pullback into value. Profits come at 7791 and 7799 on the way back up.
The Monthly VWAP Confluence: 7749.75 - 7752.00
7752.00 (Tested Daily), 7749.75 (One-Hour), plus the Monthly VWAP and a Naked Point of Control.
Context: You guys know I do not love one-hour timeframes, but I am going to show you this one regardless because I actually like this spot. The 7749.75 one-hour lines up with the monthly VWAP and also with a naked point of control we had, and I have a tested daily at 7752 sitting right with it. On SPX, this is the level that corresponds to the 7728 area.
Actionable Setup: Buy Setup: If the 7770 area does not hold and we come down, I want to see 7749.75 play and get back above 7752. I am taking major profits around 7770 and 7775, and then letting my runners come up into 7791 and 7799 where I will take more, and then looking for runners to take me higher.
THE MONEY ZONE — The Squeeze Trigger: 7728.00 - 7737.00
7737.00 (Tested Daily — Played Perfect), 7731.00 (Last & Final Untested Four-Hour), 7728.00 (Previous Weekly Value Area Low).
Context: This is the one. 7731 is our last and final untested four-hour, and that low was made last Tuesday on the move that took us to all-time highs. Right above it sits the 7737 daily that played perfect — the exact level we called last Sunday and touched to the tick. And 7728 is the big value area low. On SPX, this is the 7709 final untested daily that got missed. I really like this level, and the reason is because we have a beautiful trigger.
Actionable Setup: Buy Setup: What we want to see happen is 7731 play, get back above 7737, and then obviously continue our progression up, up, up, up. If 7731 plays and we reclaim 7737, this could squeeze super-duper hard. In my opinion, this is the best setup on the board — and if they hold this and reclaim, we go right back up and it keeps us inside this massive balance area produced over the past two weeks.
Warning: Things do go south underneath 7728 — and they go south very fast. That is the line. Below it, we are into the inefficiency and the plan changes entirely.
The Weekly Gap Fill: 7640.00
7640.00 (Weekly TPO Gap).
Context: If we lose 7728, we come down and clean up the gap right at 7640 — the one that was created on that big push. Below 7728 is a massive inefficiency that runs all the way down here and truly even lower.
Actionable Setup: This is the first structural target on a real break of the value area low. Use it as an objective, not a place to catch the knife.
The Two Massive Weeklies: 7600.00 - 7622.00
7622.00 (Weekly + Daily Confluence), 7600.00 (Weekly + Daily Confluence).
Context: Directly below the gap we have two massive weeklies at 7622 and 7600, and these levels should be very familiar to you — we have covered them in the past two or three Weekend Reviews and nothing has changed. I wanted to show them on the weekly timeframe so you get an idea of what is really in store from the higher standpoint if we do break below 7728. We also have daily confluence at both of these. These are really nice levels.
Actionable Setup: Buy Setup: If we come lower, this is the area we are all about. These are the high-timeframe buys that would anchor a deeper pullback, and I would consider that move very much welcome.
📌 Cheat Sheet – Key Levels Recap
🧠 Final Thoughts
I have given you the major levels to play, and the read is clean. We are balance on balance at all-time highs, up on every timeframe, in a positive gamma environment, coming off ridiculously low relative volume in the middle of summertime trading. That is the perfect cocktail for sleepy-time trading — so be patient and let the structure come to you. Right now we are rotating from the edge right back into value, which reduces the odds of a big immediate move, but the ladder is defined: 7791.75 first, then the thick 7770 - 7775.50 area, then the 7749.75 / 7752 monthly VWAP confluence, and then the money zone. If 7731 plays and we reclaim 7737, this could squeeze super-duper hard — that is the setup I like most, and it is the one I will be watching for. Above, 7799.50 is the reclaim line, 7809 is the blocker, and 7820 - 7822 is where I take major profits.
Below 7728, it all goes bad and it goes bad fast — we clean up the gap at 7640, and then we are all about that much lower area at 7622 and 7600 that we have covered in the past two or three Weekend Reviews. Nothing has changed there, so go back and take a look if you want the full breakdown. Those are the high-timeframe buys, and honestly, a move into them would be very much welcome.
One last emphasis, and I want to be crystal clear: I am not bearish. I am looking for buys. We are up on all timeframes. I am just telling you to exercise caution, because VIX is extremely low, and when it gets this low, simple market mechanics say it needs a rebalancing. A fierce 20% pop in VIX would not be uncommon — a Trump tweet, a geopolitical event, whatever it may be, could send the market down 1% to 2%, ultimately for us just to buy it up again. I have seen this happen dozens of times, and it catches people off guard. I have seen people lose accounts, lose funded accounts, lose real money, because the market just seems to slice through every level. Do not get in front of this market if it starts to get like that. Be prepared, be patient, let it do its thing, and look to buy it — especially on the bounce, or let it bounce and retest, and then you know we have got it.
You guys enjoy the rest of your Sunday and I will see you tomorrow. Cheers, and let’s go conquer the markets.
Until next time—trade smart, stay prepared, and together we will conquer these markets!
Ryan Bailey, VICI Trading Solutions.
📊 Indicator String
Copy and paste the levels below into your S&P Edge Levels indicator to automatically plot today’s key levels on your chart:
7809.00|D|D
7799.50|Tested 4HR|T4
7791.75|4HR|4H
7775.50|D|D
7770.00|4HR|4H
7752.00|Tested D|TD
7749.75|1HR|1H
7737.00|Tested D|TD
7731.00|4HR|4H
7728.00|P.W. VAL|GD
7622.00|WK|W
7600.00|WK|W


