

Welcome back everybody. It is March 15th and it is time for the Weekend Review. We had an amazing week last week as we have been leaning short for three weeks now and we just absolutely crushed it the whole way down. Congratulations to everyone who took advantage of the trade plans — I know everybody who has been DMing me has been really happy about the levels. As many people continue to think this market is going to go up, we had it right. We’re still pointed down, and we still are.
However, let me just say this: I have reason to believe we’re going to come down much farther. The data says we will. However, we also have near-term data that says we should be expecting a pop. So we’re going to go over all of that today — long-term data, short-term data, VIX, SPX, and ES. Hang on tight because this is going to be a lot of information.
A Note on This Week’s Market:
Long-Term Data: On February 4th, I put out the “70% Warning — History Says the S&P 500 Will Crash This Year” post near all-time highs. The data based on the midterm cycle going back 30+ years shows a 70% chance of an 18.7% average max drawdown. This has happened in 12 out of 17 midterm cycles. We are currently only 5% off the all-time highs, which means we still potentially have another 10-13% to go to the downside. I’ve just published a new post today — “The 30-Year Market Pattern Nobody Wants to Talk About” — which I will link inside this post. It’s certainly worth the read.
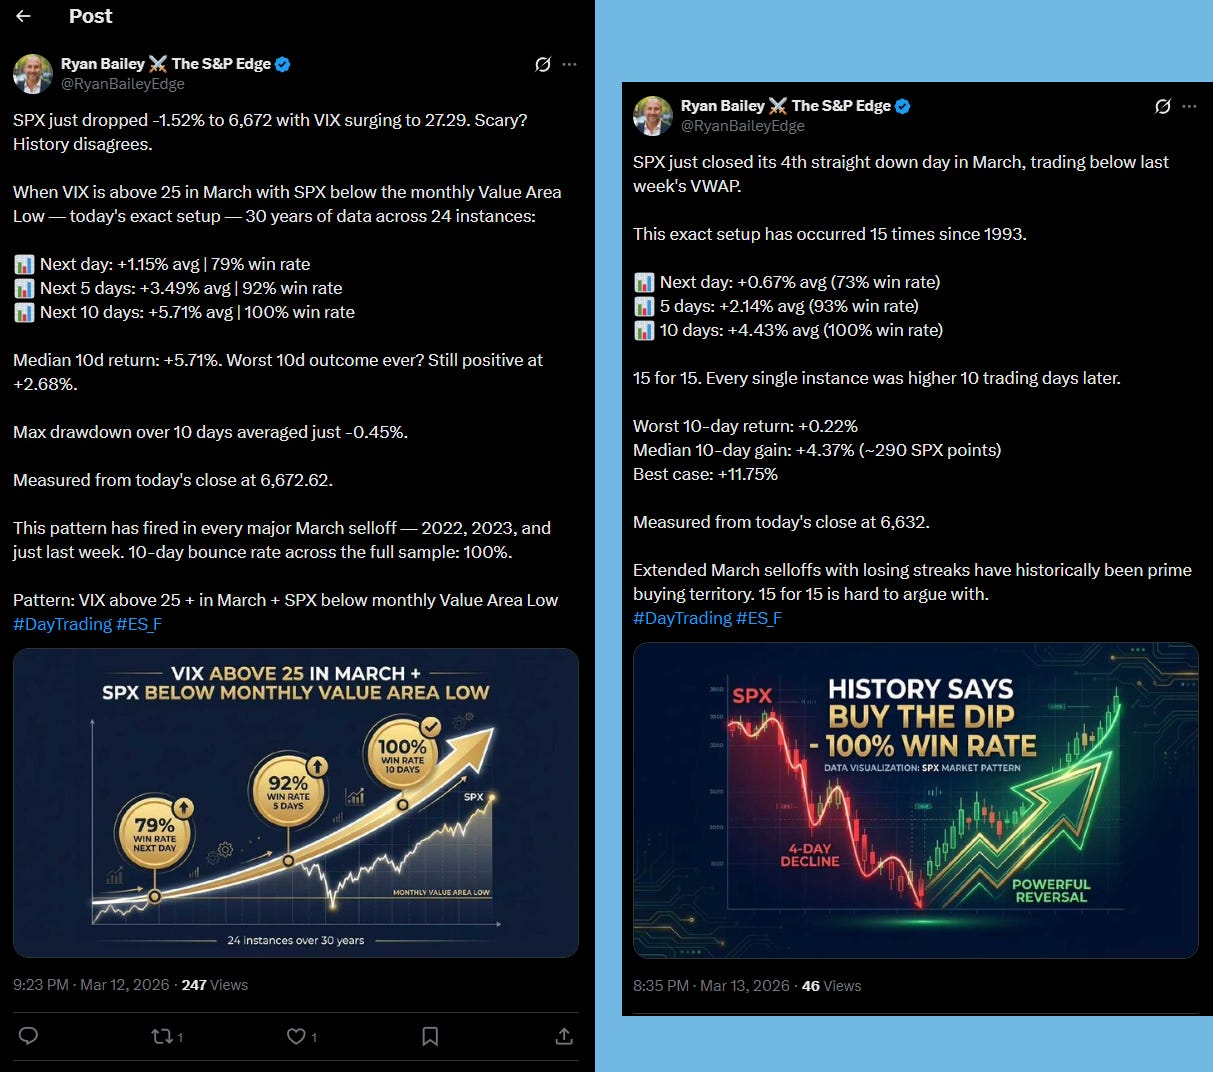
Short-Term Data: Based on Friday’s close at 6632, this was the fourth straight down day in March trading below last week’s VWAP. We’ve seen this setup occur 15 times since 1993. Over the next 5 days, we have a 93% win rate with an average up of +2%, and a 100% win rate (15 for 15) with an average of +4.43% higher. Even the worst-case 10-day gain was +0.22% — meaning it was still positive every single time. With 100% win rates, it’s hard to ignore this data.
Weekly Range: Last week we moved 154% of our 10-week average range, which was an incredibly impressive move. Our average daily ranges have been approximately 125 points, and on Friday alone we moved 112 points. We are only about 100 points from the leg low — that’s literally one day’s worth of movement.
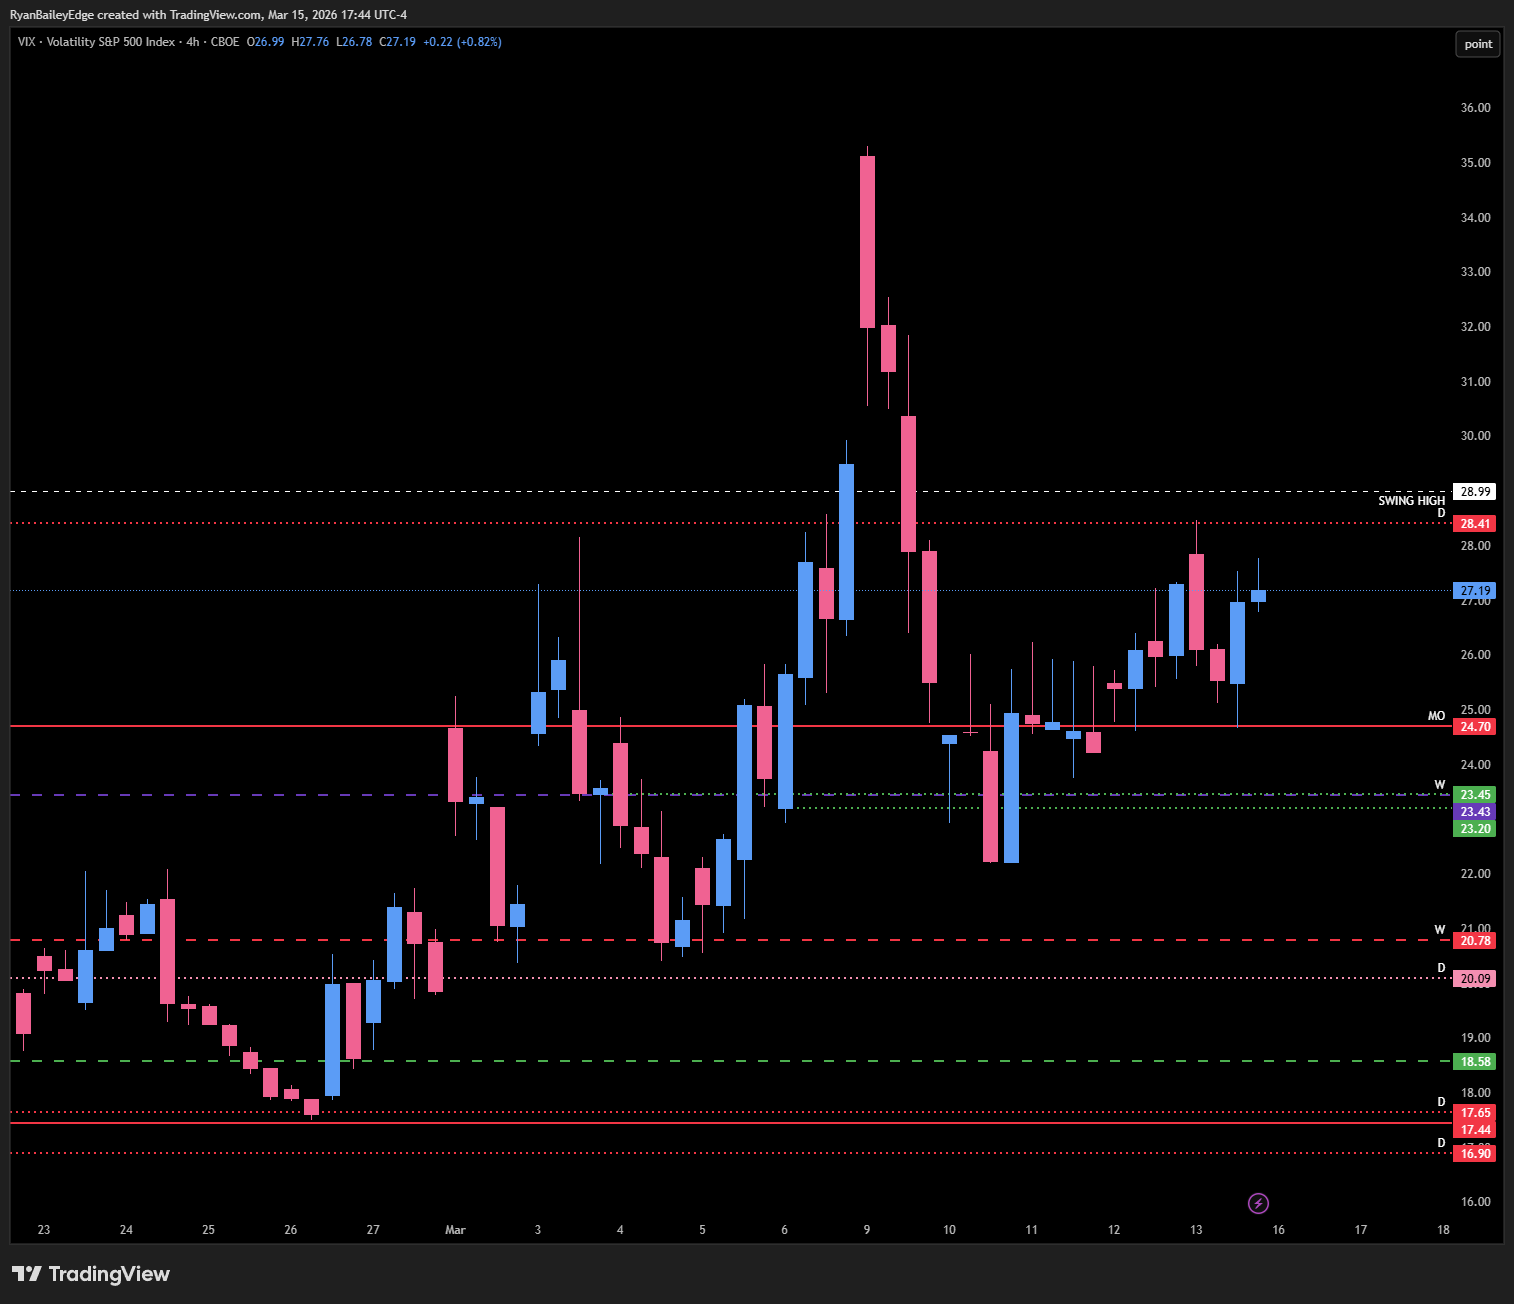
Gamma: We remain in Negative Gamma territory as VIX continues to push above our 24.70 Monthly. Dealers are still hedging to the downside, and with the amount of range we’ve been putting in, anything can happen in this environment.
Trend: Downside. Three red weeks in a row, and we had four straight red days to close out the week. We have not gained support on any timeframe. However, we are in massive oversold territory on every single technical indicator, and the near-term data suggests a pop is coming. We just need to find some liquidity first — and I believe the leg low sweep will provide exactly that.
🧠 Current Market Context
The Midterm Cycle, The Oversold Bounce & The Leg Low Mission
Here’s the big picture. We have a 70% probability based on 30+ years of midterm cycle data that we are going to pull back 18.7% from the highs this year. The average year-end return in these cycles is still +1.7%, which means we pull back hard but ultimately rebound — setting up a potentially fantastic buying opportunity for all of us. It doesn’t matter whether it’s Republican or Democrat — these patterns repeat because midterms bring uncertainty into the market, and the market hates uncertainty. Once things settle, it rebounds.
The 30-Year Market Pattern Nobody Wants to Talk About Right Now

If you’ve been trading long enough, you develop a healthy respect for patterns. Not because the market is scripted — it’s not — but because human behavior tends to repeat, especially when the same catalysts show up on a predictable schedule.
Now, here’s where it gets interesting. Even though the long-term data says we can still come down another 10-13%, our short-term data paints a different picture for the near term. The data I posted Thursday showed that with VIX where it is in March across 30 years, we had a 92% chance of being up 3.4% and a 100% win rate of being up 5.7% over the next 5-10 days from Thursday’s close. The new data from Friday’s close at 6632 is even more compelling — 93% win rate over the next day with an average of +2%, and 100% win rate (15 out of 15 instances) over 5 days with an average of +4.43% higher. The worst case over 10 days was still positive at +0.22%, and the best case was +11%. My estimate is we probably land somewhere between 2.5-4% — especially as we sweep this leg first.
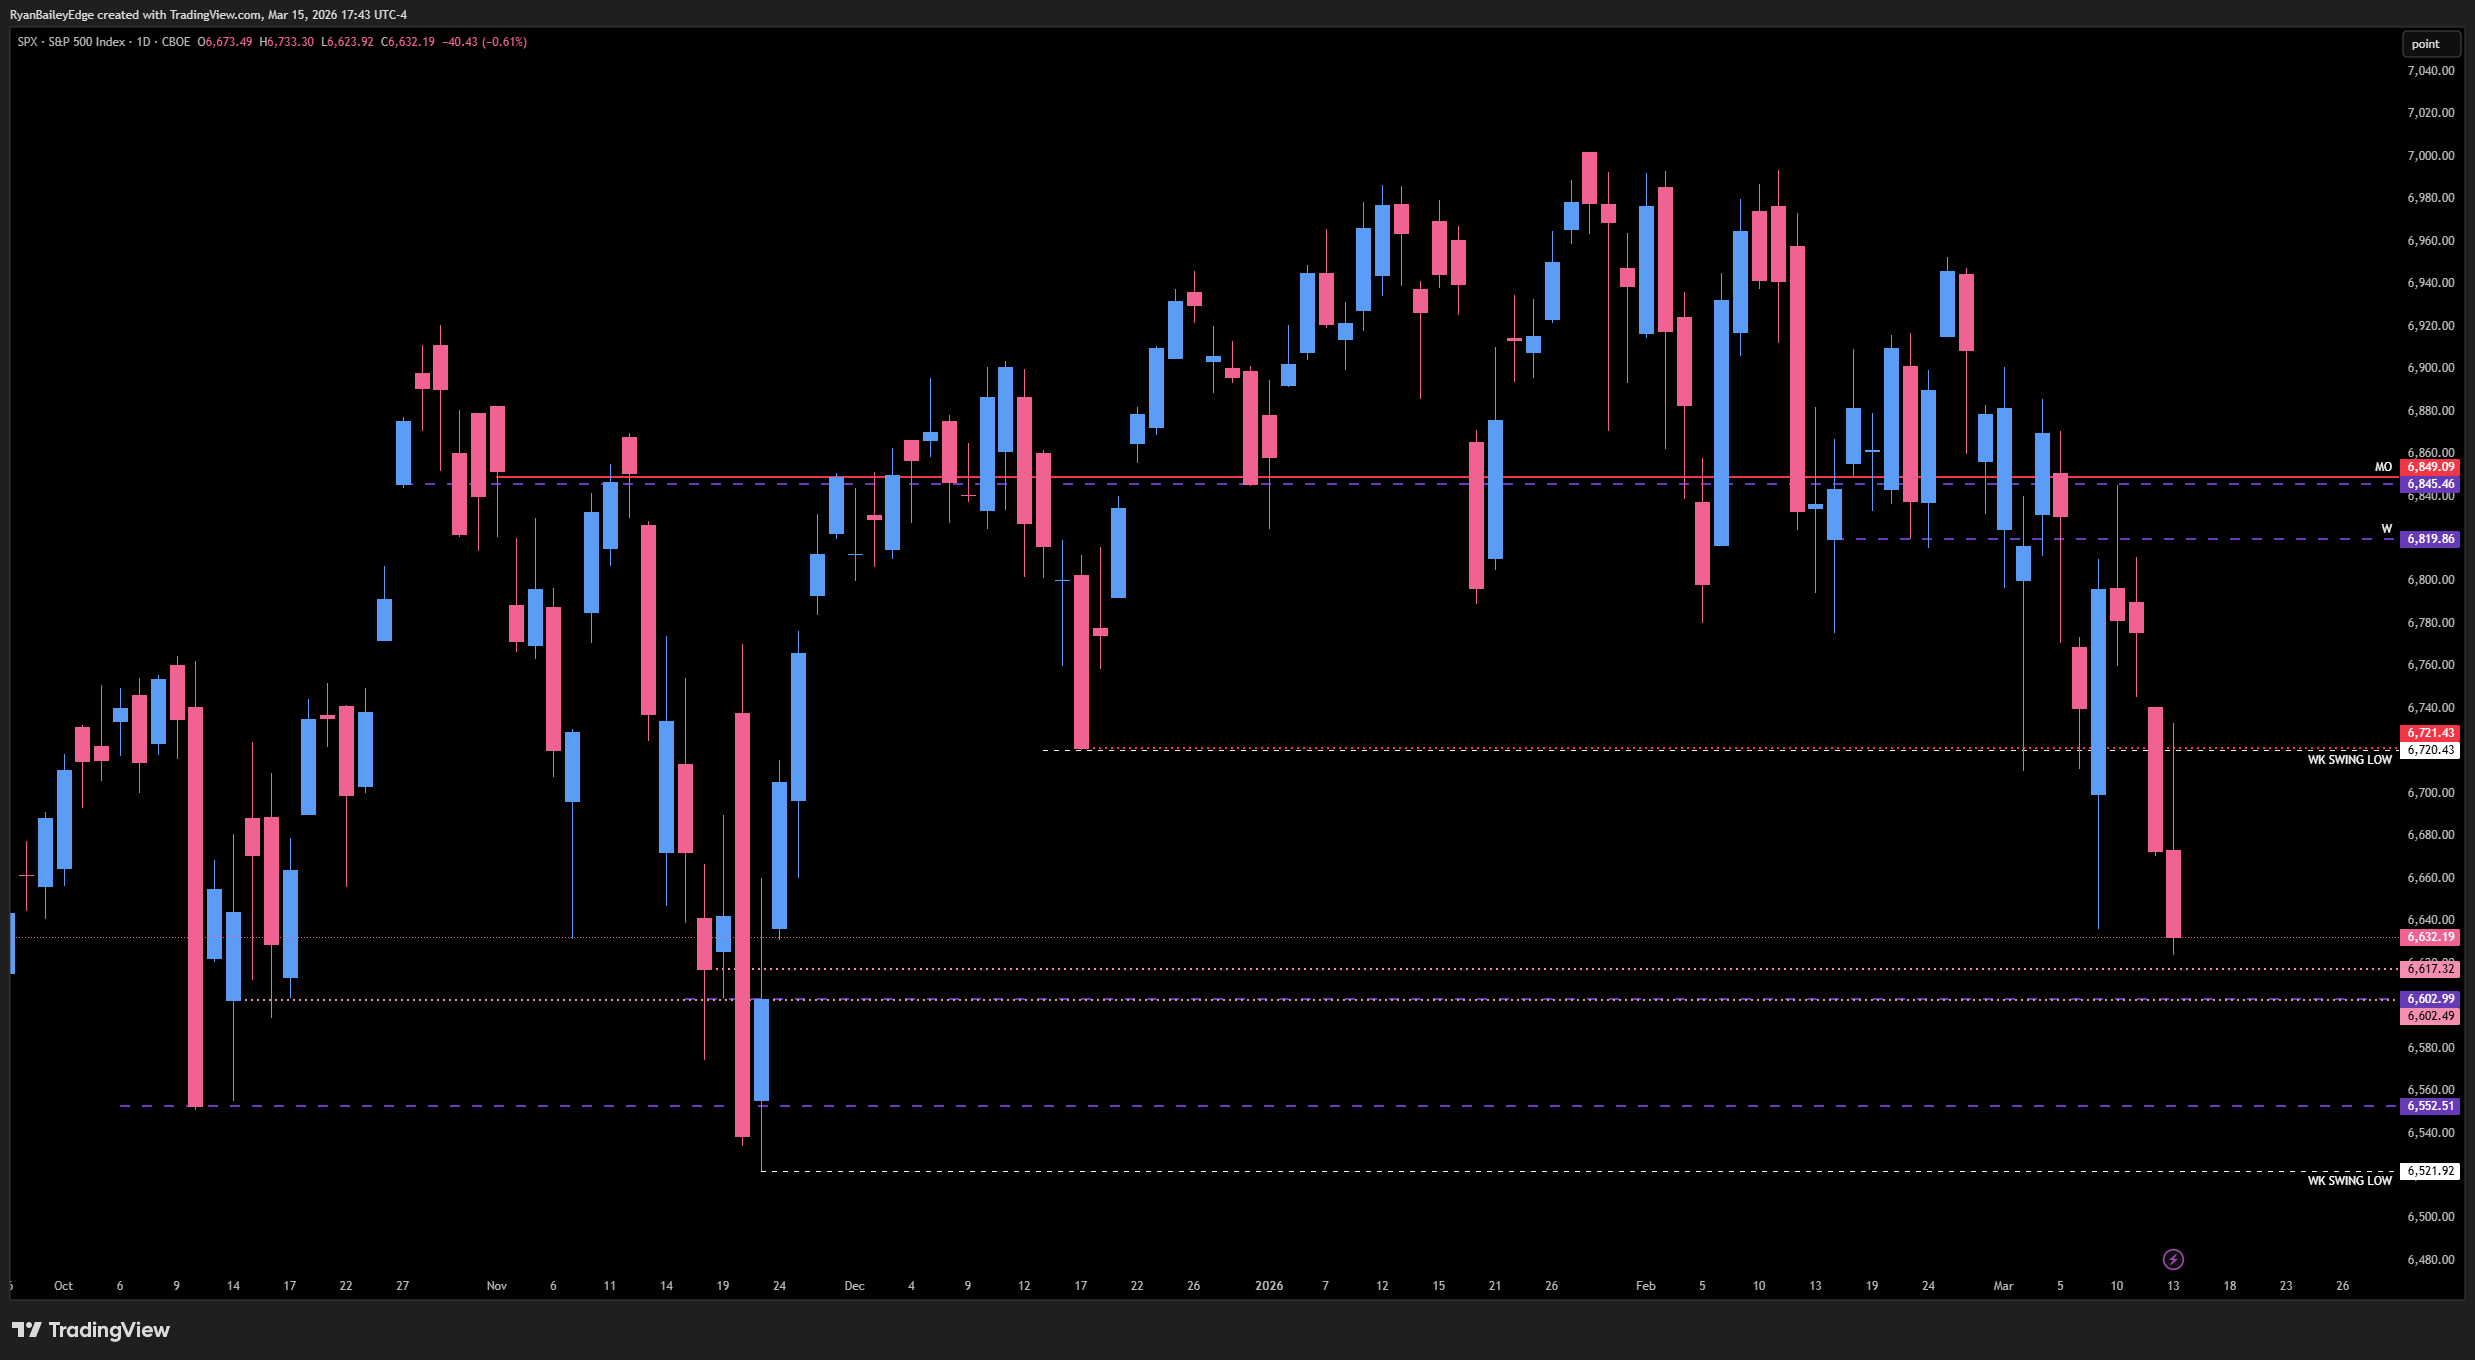
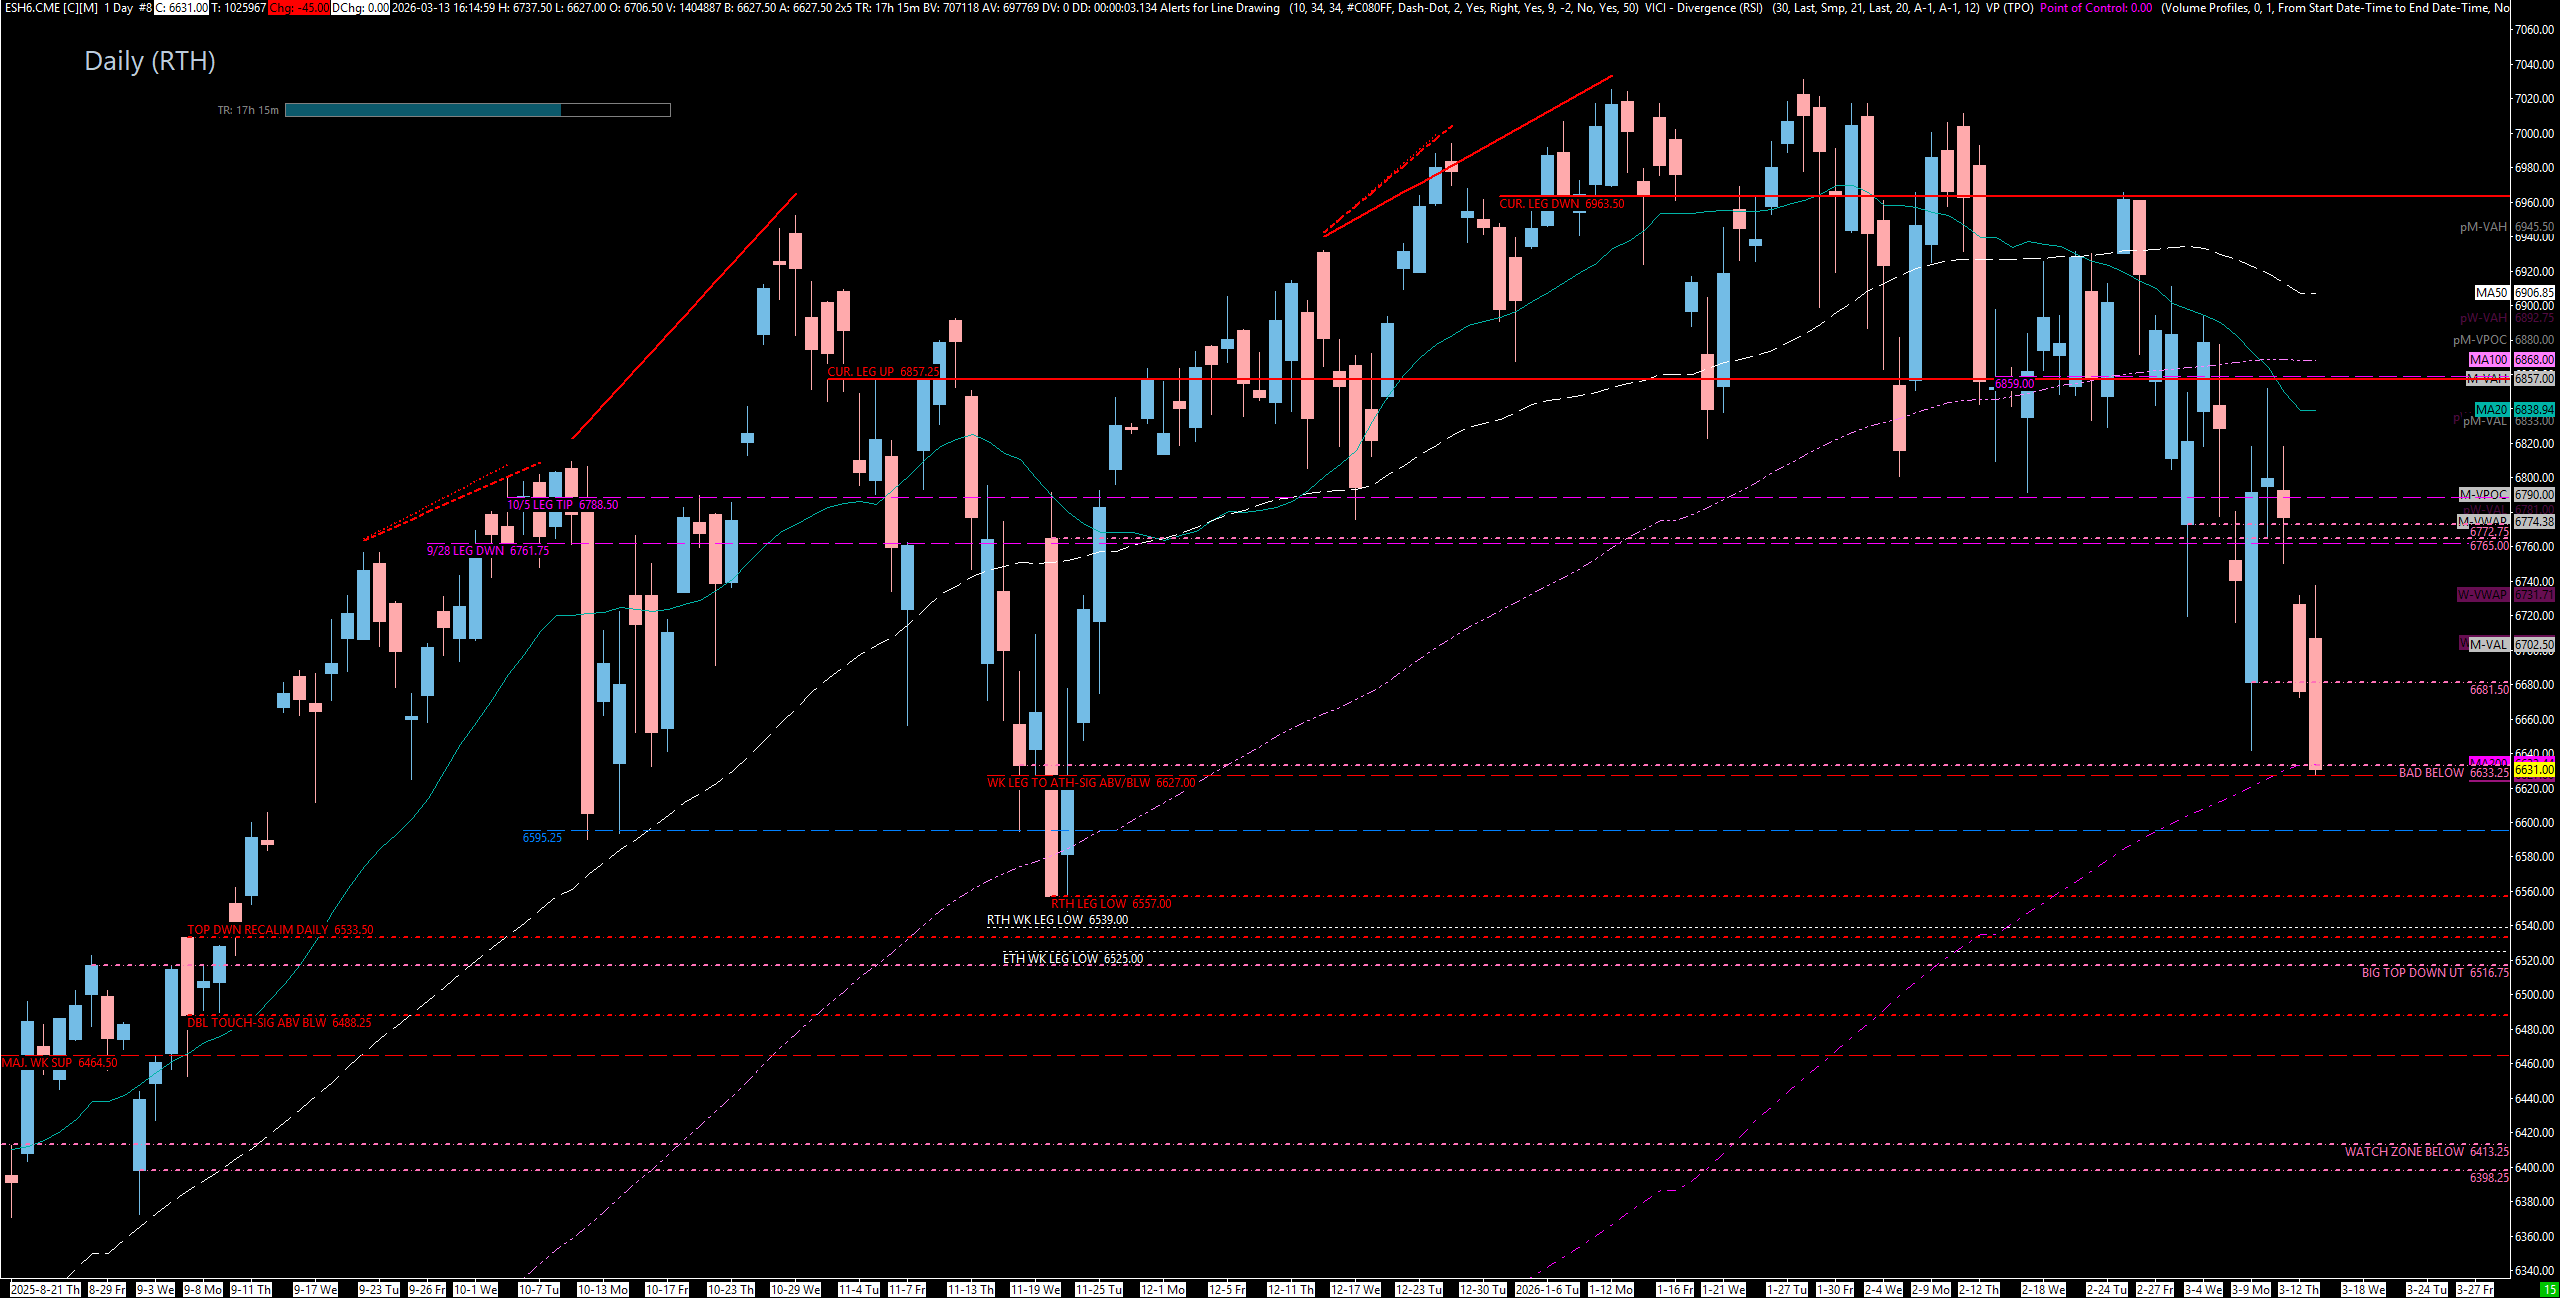
Looking at SPX, it is still continuing its traverse lower and truly looks like it’s seeking the leg low for a potential sweep. We have support at 6602 (the 6600 psychological handle) and the 6550s about 50 handles below that. Ultimately, I am targeting new lows underneath 6521 on SPX. However, if they play the 6600 area and get back above 6617, we could squeeze much, much higher. On the daily timeframe, we stayed below the 6721 Daily and continued the momentum to the downside. This is a massive leg in — this is the leg that took us to the all-time highs — so I do expect some potential support in here.
🚨 VIX Analysis: The 28.41 Ceiling & The 24.70 Pivot
VIX has been a tremendous tool for us this week. We played the 28.41 Daily perfectly on Thursday night in the overnight session, and it has been cascading down since. Here’s how I’m structuring the VIX for the week ahead:
The Ceiling Cap (28.41 - 29.00 zone): The 28.41 Daily and the 29.00 previous swing high create a 50-cent zone that is our major above/below ceiling. As long as VIX stays above this zone, we’re going to continue to get massive suppression on the ES. When they punched above this area previously, VIX really went — so this is a critical spot to monitor. Above 29.00, the indices will get crushed.
The Monthly Midpoint (24.70): The 24.70 Monthly has been our big above/below pivot for weeks now. On Thursday and Friday, they played this level perfectly — popping above it and then coming back down. Below 24.70, VIX starts to come down pretty fast, and the indices will pop up nicely. This remains our main tiebreaker.
The Untested Weekly (23.43): I do believe we could sweep down to this 23.43 Weekly level and get a play here. This is still untested in my opinion, and if VIX holds here and starts to break higher, that may be all we get for the little pop that I think is coming. However, if we push below 23.43, the indices are going to continue to push higher and higher until VIX gets back down to the $20 handle — which we’ve been talking about for some time.
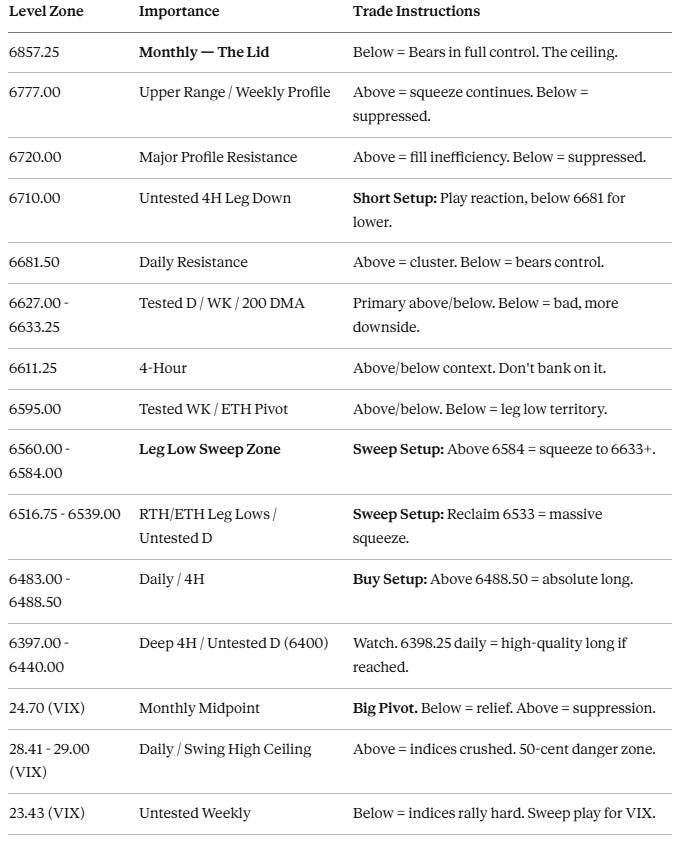
🎯 Detailed Actionable Trade Plan (ES Futures)
We are still pointed down and we have not gained on any timeframe. However, we are in massive oversold territory with the data suggesting a near-term bounce. The mission is clear: I believe we need to sweep the leg low at 6584 and potentially down to 6525 to find the liquidity needed for the pop. Above 6681, things get thick with resistance. The weekly profile resistance at 6720 and the upper range at 6777 are our major overhead levels. Use the 6633/6627 daily/weekly combination as your primary above/below context, and the 6595 ETH weekly as your secondary pivot.
🔴 Key Resistance Zones & Setups
The Daily Resistance / Above-Below: 6681.50
6681.50 (Daily — closed below Thursday, now resistance).
Context: We closed below this level on Thursday, which meant we were fairly destined to make new lows on this leg — and they did on Friday at the close. Above 6681, we come into a massive cluster of resistance that is thick. Getting back above this level would be the first sign of a potential shift.
Actionable Setup: A push above 6681.50 with acceptance opens the door to the 6710 area. Below here, we remain firmly in the bears’ control.
The Untested 4-Hour Leg Down: 6710.00
6710.00 (Untested 4-Hour — leg down level).
Context: I really, really like this spot. This is the 4-Hour leg down for the current move, and it’s untested. Depending on where we open, this could be a fantastic level to play for a short. I would love to not sweep the leg, pop up here, play this for a reaction, and then go back down.
Actionable Setup: Short Setup: If price pops up to 6710 and reacts, look for a move back below 6681.50 for continuation lower. Once we get back underneath 6681, momentum is strongly in our favor to the downside.
The Major Profile Resistance: 6720.00
6720.00 (Major Weekly Profile Resistance).
Context: This is our major resistance on the weekly profile. If we push above 6720, we will start to fill in the large inefficiency above. On Friday, the buyers tried to push through this area and were just unable to get the job done. Below 6720, we remain suppressed.
Actionable Setup: Above 6720, we target the upper range. Below 6720, we continue to stay suppressed and look for the leg low sweep.
The Upper Range / Weekly Above-Below: 6777.00
6777.00 (Upper Range Target / Weekly Profile Level).
Context: This area should be familiar to everyone — this is a huge spot that we played above/below this week on the way down and on the way up. Above this, we continue to move higher. Below this, we continue to stay suppressed.
Actionable Setup: This is our upper range target if the squeeze materializes. Watch for above/below context here — a push above 6777 opens the door to significantly higher levels.
The Monthly / Weekly Area: 6857.25
6857.25 (Monthly — how many times have we talked about this).
Context: This is the massive Monthly/Weekly area we’ve been talking about for weeks. They smacked this level almost perfectly and have been coming down strong ever since. Ultimately, as long as we stay below here, the downside progression continues.
Actionable Setup: This is the lid on everything. Below 6857.25, the bears remain in full control.
🔵 Key Support Zones & Setups
The Tested Daily / Weekly / 200 DMA: 6627.00 - 6633.25
6633.25 (Tested Daily), 6627.00 (Tested Weekly).
Context: We’ve talked about the 6633/6627 combination multiple times. We closed below this area on Friday, which means this is now technically resistance. An open below here would be really bad and would confirm further downside. The 200-day moving average is right here as well. However, we are using this as our primary above/below context.
Actionable Setup: A push back above 6633 with acceptance could set up a run to 6681. Below here, we continue to push lower toward 6595 and ultimately the leg lows.
The 4-Hour Level: 6611.25
6611.25 (4-Hour).
Context: We’ve closed below 6633, so this level is technically below us now. I wouldn’t count on it doing too much, but it exists and we will see what happens.
Actionable Setup: Use for above/below context only. Not a level I’m banking on for a significant reaction.
The ETH Weekly / Above-Below Pivot: 6595.00
6595.00 (Tested Weekly — ETH level).
Context: This ETH weekly played in the Globex session previously when we came down and retested the big spot below. We’re going to keep an eye on this as a great above/below pivot. This is also in the area where I think we still need to fill in the rest of the profile in RTH.
Actionable Setup: Watch for above/below context. A push below 6595 brings us into the leg low sweep territory.
The Leg Low Sweep Zone: 6560.00 - 6584.00
6584.00 (Weekly VAL — exact low last week), 6560.00 (Tested support zone).
Context: I absolutely think we’re going to sweep this area and come back up. The 6585 Weekly VAL was the exact low last week, and I’ve been calling for this sweep. The buyers couldn’t get the job done the first time — they sure aren’t going to get it done the second time. We need to sweep the lows to get some liquidity. The 6560 area is technically tested and nothing has been gained, but I think this is a possible catalyst for a pop.
Actionable Setup: Sweep Setup: If they play the 6560 area and get back above 6584, we could squeeze. Above 6633, we squeeze at least to 6681. This is worth being patient on — the sweep is where the magic happens.
The RTH / ETH Leg Lows: 6516.75 - 6539.00
6539.00 (RTH Daily Leg Low), 6533.50 (Tested Daily), 6525.00 (ETH Leg Low — true sweep target), 6516.75 (Untested Daily).
Context: This is where I think we’re ultimately headed from a weekly timeframe perspective. The RTH leg low sits at 6539 and the true sweep target is the ETH low at 6525. We have a Tested Daily at 6533.50 and an Untested Daily at 6516.75 down here. If we sweep this leg and start to reclaim the Daily at 6533.50, this thing could squeeze super hard — all the way back to 6633, then 6681, potentially 6772, and if not all the way to 6857.
Actionable Setup: Sweep Setup: Look for the sweep below 6525 and a reclaim above the Daily at 6533.50 for a massive squeeze. Get back above 6539 and this thing goes. The data says we have a 100% win rate of being higher over 5 days — and this is where the liquidity comes from.
The 4-Hour / Daily Long Setup: 6483.00 - 6488.50
6488.50 (Daily), 6483.00 (4-Hour).
Context: If we push below the leg lows, this is the spot I’m looking to buy. They double-tapped this area, and if they play it and get back above the Daily at 6488.50, this is an absolute long. This would squeeze for sure.
Actionable Setup: Buy Setup: If 6483 plays and gets back above 6488.50, this is a high-conviction long entry. Target the leg low area above for the squeeze.
The Deep Support / 4-Hour Targets: 6397.00 - 6440.00
6440.00 (4-Hour), 6398.25 (Daily — untested, lowest untested on massive move up), 6397.00 (4-Hour).
Context: I’m not going to take it out too far, but I wanted to show you what’s down here. The 6413 area is a watch for me — not super excited about it. But I really like the 6398.25 Daily. It was the lowest untested level on the massive move up, and there’s some 4-Hour confluence in there. And look at the number — basically 6400, right? Round numbers, people. It just so happens they always work out like that.
Actionable Setup: If we get this far down, the 6398.25 Daily is the level I like a lot. There’s 4-Hour confluence here, and the round number psychology at 6400 makes this a potential high-quality long setup.
📌 Cheat Sheet – Key Levels Recap
🧠 Final Thoughts
We have been coming down for three straight weeks, and we just absolutely crushed it on the short side. The data is clear on two fronts: long-term, the midterm cycle gives us a 70% chance of pulling back 18.7% from the highs, and we’ve only come down about 5% so far — meaning there’s potentially another 10-13% to go. Short-term, we are oversold on every single indicator, and the data gives us a 100% win rate of being higher over the next 5 days with an average of +4.43%. These two things are not contradictory — we pull back, we bounce, and then we potentially pull back further. That’s how markets work.
I believe the leg low sweep at 6584 and potentially down to 6525 is where the liquidity comes from for this bounce. Once we sweep those lows and start to reclaim, this thing could squeeze significantly — back to 6633, 6681, potentially 6772 or higher. The key levels to watch: 6681 is our first major resistance above, 6633/6627 is our primary above/below, and 6595 is our secondary pivot. On VIX, keep the 24.70 Monthly as your tiebreaker and watch the 23.43 Weekly for a potential sweep and hold.
I personally won’t be trading the Sunday session unless we’ve already swept and started to reclaim — then I’ll be tempted to get long and hold a swing for a nice ride back up. You’re going to see a lot more statistical data coming out of VICI Trading Solutions and the S&P Edge — this is valuable stuff, and it gives us a real edge. Make sure you check out the posts I published this week. I look forward to conquering the markets with you this week. It’s going to be a more volatile week, and I think we’re going to get both downside and upside plays. The trade plan will be in your inbox Tuesday at 8:30 AM.
Until next time—trade smart, stay prepared, and together we will conquer these markets!
Ryan Bailey, VICI Trading Solutions.
📊 TradingView Indicator String
Copy and paste the levels below into your S&P Edge Levels indicator to automatically plot today’s key levels on your chart:
6857.25|MO|M
6710.00|4HR|4H
6681.50|Tested D|TD
6633.25|Tested D|TD
6627.00|Tested WK|TW
6611.25|4HR|4H
6595.00|Tested WK|TW
6533.50|Tested D|TD
6516.75|D|D
6488.50|D|D
6483.00|4HR|4H
6440.00|4HR|4H
6398.25|D|D
6397.00|4HR|4H
