

Good afternoon everyone, and happy Sunday — it is time for another Weekend Review, and we are coming off a phenomenal week. Last week was absolutely insane with so many back-to-back hits, it was incredible. Big salute to Team Vici and all the members in the Inner Circle — we have had people piling in lately, coming in to learn the craft, learn the process, and put up some real chips, and I could not be more excited. We had a really solid close on Friday, and I think all-time highs are looking like they are in the cards. We are going to get into all three today: VIX, SPX, and ES. I think we are going to have a big week — a nice long grindy one — and I have some really key areas to walk through.
🎓 WEBINAR — Funded Trader Blueprint | Thursday, July 16th at 7:00 PM Before we get into the action, make sure you sign up for the Funded Trader Blueprint. I only run this webinar once a month, and it is all about how to leverage prop firms, the right copier I feel everyone should use, and my exact system for making it happen. There is a ton of information in here on the process and the precise steps to leverage small money to potentially make big money — spending $1,000 of your own capital to potentially make $10,000 a month on other people’s money is always attractive and always lucrative, and I will give you all the tips to make it happen. It is this Thursday, July 16th at 7:00 PM. Register here → https://pages.vicitradingsolutions.com/funded-trader
A Note on This Week’s Market:
News: We had some geopolitical news over the weekend with Iran and everything — this may put us below, I do not know for sure. Based on what we are looking at right now, the structure is bullish, but monitor the open carefully for any weekend-driven gaps or shakes.
Structure: The weekly TPO shows us in a massive multi-week balance that has drifted sideways, but we are now pushing up as we close the week at the highs. We are forming a massive wedge with higher lows and accepting value as we climb — this wedge is dying to break out, and it looks that way on the candlesticks too.
Range: Expect a long, grindy week. The big balance area has led to an acceptance of value, which allows buyers to push the market up confidently. We have not made an all-time high yet, but all signs are pointing to it.
VIX: VIX closed the weekly beneath 15.32 — a big sign of weakness — and is drifting lower, potentially all the way toward 13.60. That is a tailwind for the indices, but be cautious: down in the 14-13 handle, knee-jerk reactions can spike VIX and send the indices down fast.
Trend: Up. We finally got a super solid weekly close above 7599 on ES, which in my process gives us a high probability of making a new all-time high at 7648.75. This was the exact clue I gave last week. The process points up — but they have only left us a couple of support levels to buy before things go bad, so respect the spots.
🧠 Current Market Context
The Wedge Breakout & The Weekly Close Above 7599
We come into the week of July 13th on the verge of a genuine breakout. After four or five weeks of balancing back and forth in the same weekly range — all these pops and drops while we really were not going anywhere — we finally got the big kicker: a super solid weekly close above 7599 on ES. In my process, that tells me we now have a high probability of making a new all-time high at 7648.75. The massive balance has produced an acceptance of value that lets buyers push confidently, and the weekly TPO is forming a beautiful wedge of higher lows dying to break to the upside. My process is pointing us up.
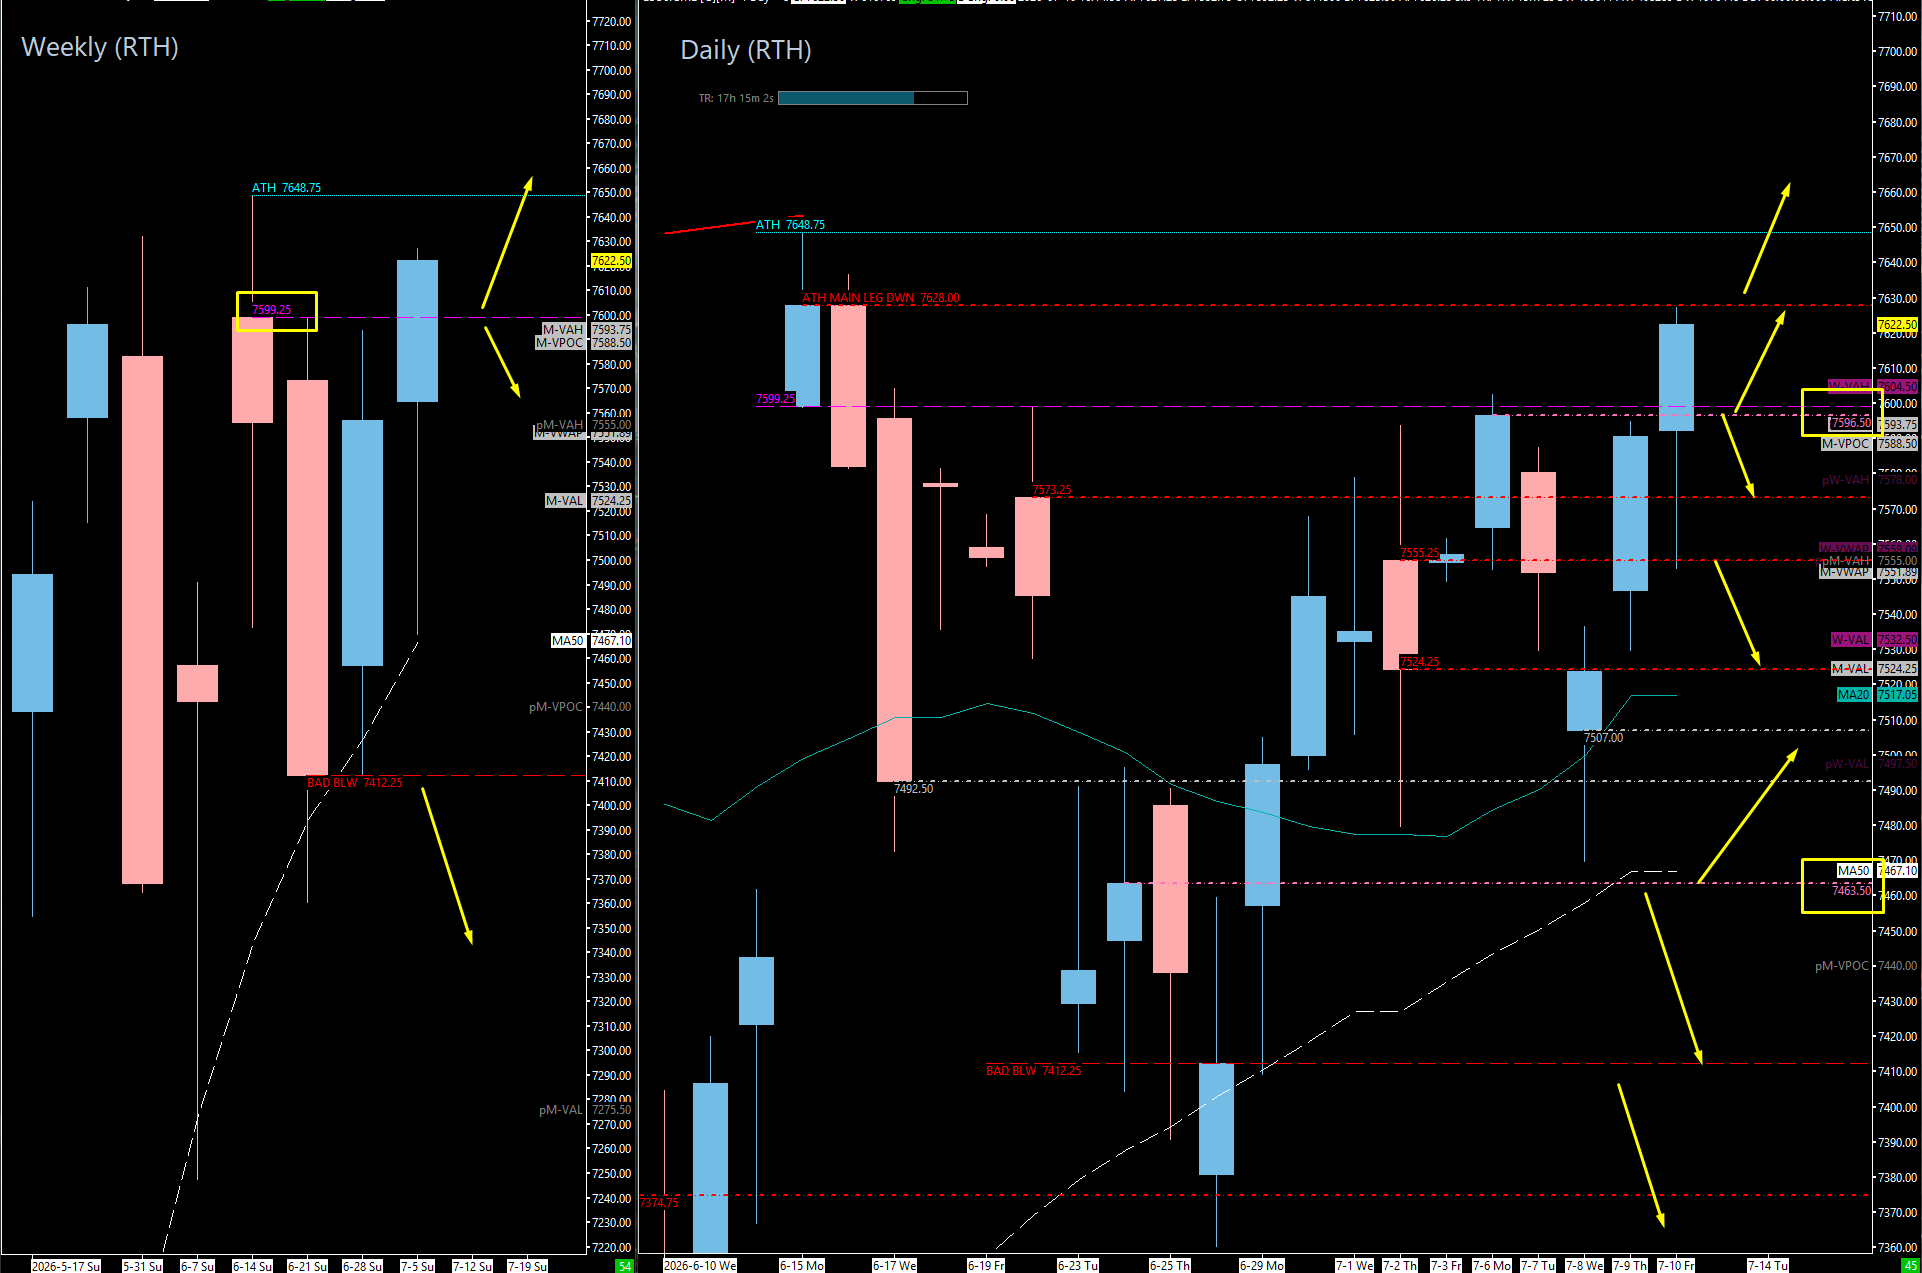
On SPX, we looked at this Thursday and Friday and assumed we would get catapulted to all-time highs — and here we are, essentially right up at the weekly we talked about at 7582, with the four-hour at 7585 right beside it. This is our big resistance right now, and we pushed right into it at the close, touching our upside target perfectly for an incredible Friday finish. A push above 7582-7585 sends us through to all-time highs, because there is simply nothing left untested above. On the support side, the big daily is 7554.29 — this is my last untested support, it lines up beautifully with the ES spot, and it is truly what we need to hold above to continue momentum higher. If 7554 fails, we do not have much until we come down about 50 points to 7500, which would have to hold and then reclaim 7506 to make progression back higher. 7500 is the make-or-break — it is an untested daily but not my favorite — and below 7500, it all goes bad on the indices, with things shifting fast and the big four-hour at 7478 (which we played multiple times last week) becoming real trouble to reclaim.
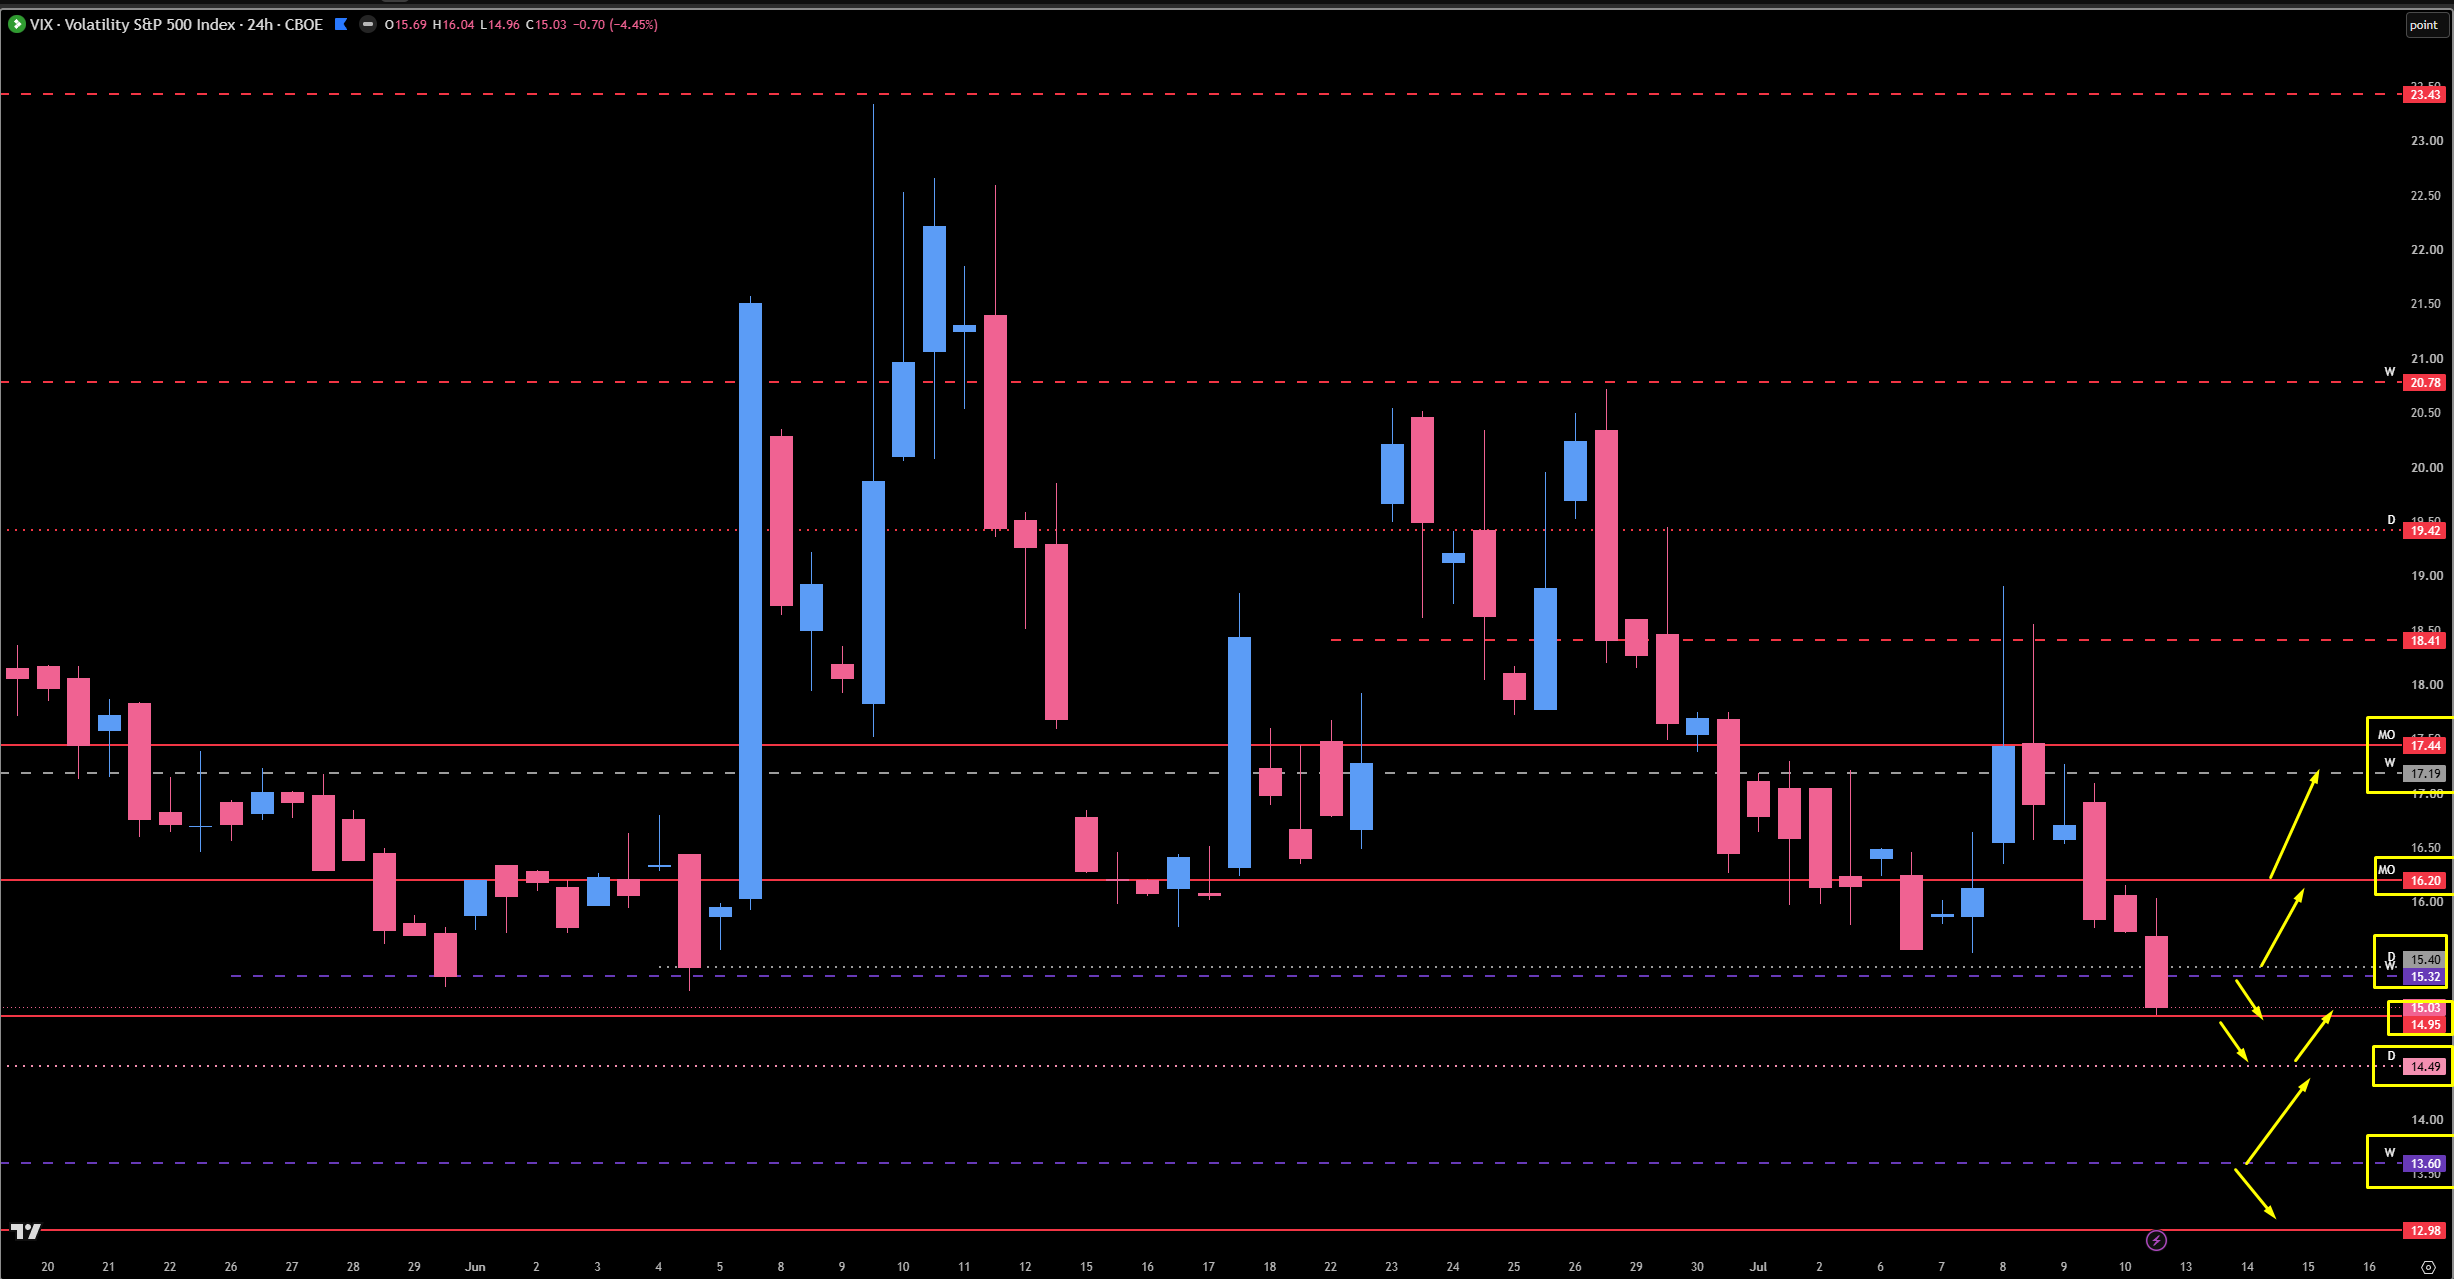
On ES, the picture rhymes perfectly. The key levels to burn into your memory banks: the Previous Weekly Value Area High at 7602 and the Previous Weekly Point of Control at 7586.75 — these two are going to be absolutely massive. Underneath 7562, we truly start to get into big-time trouble, and the 7525-7527 area — which we played multiple times and held — is the Previous Weekly Value Area Low, where everything goes bad below. The breakout confluence lines up almost to the tick: our old weekly at 7599 now sits within three points of the 7602 value area high. This is a very defined week — we know exactly what to play to continue higher and exactly where it all goes bad.
🚨 VIX Analysis: The 14.49 Daily Support
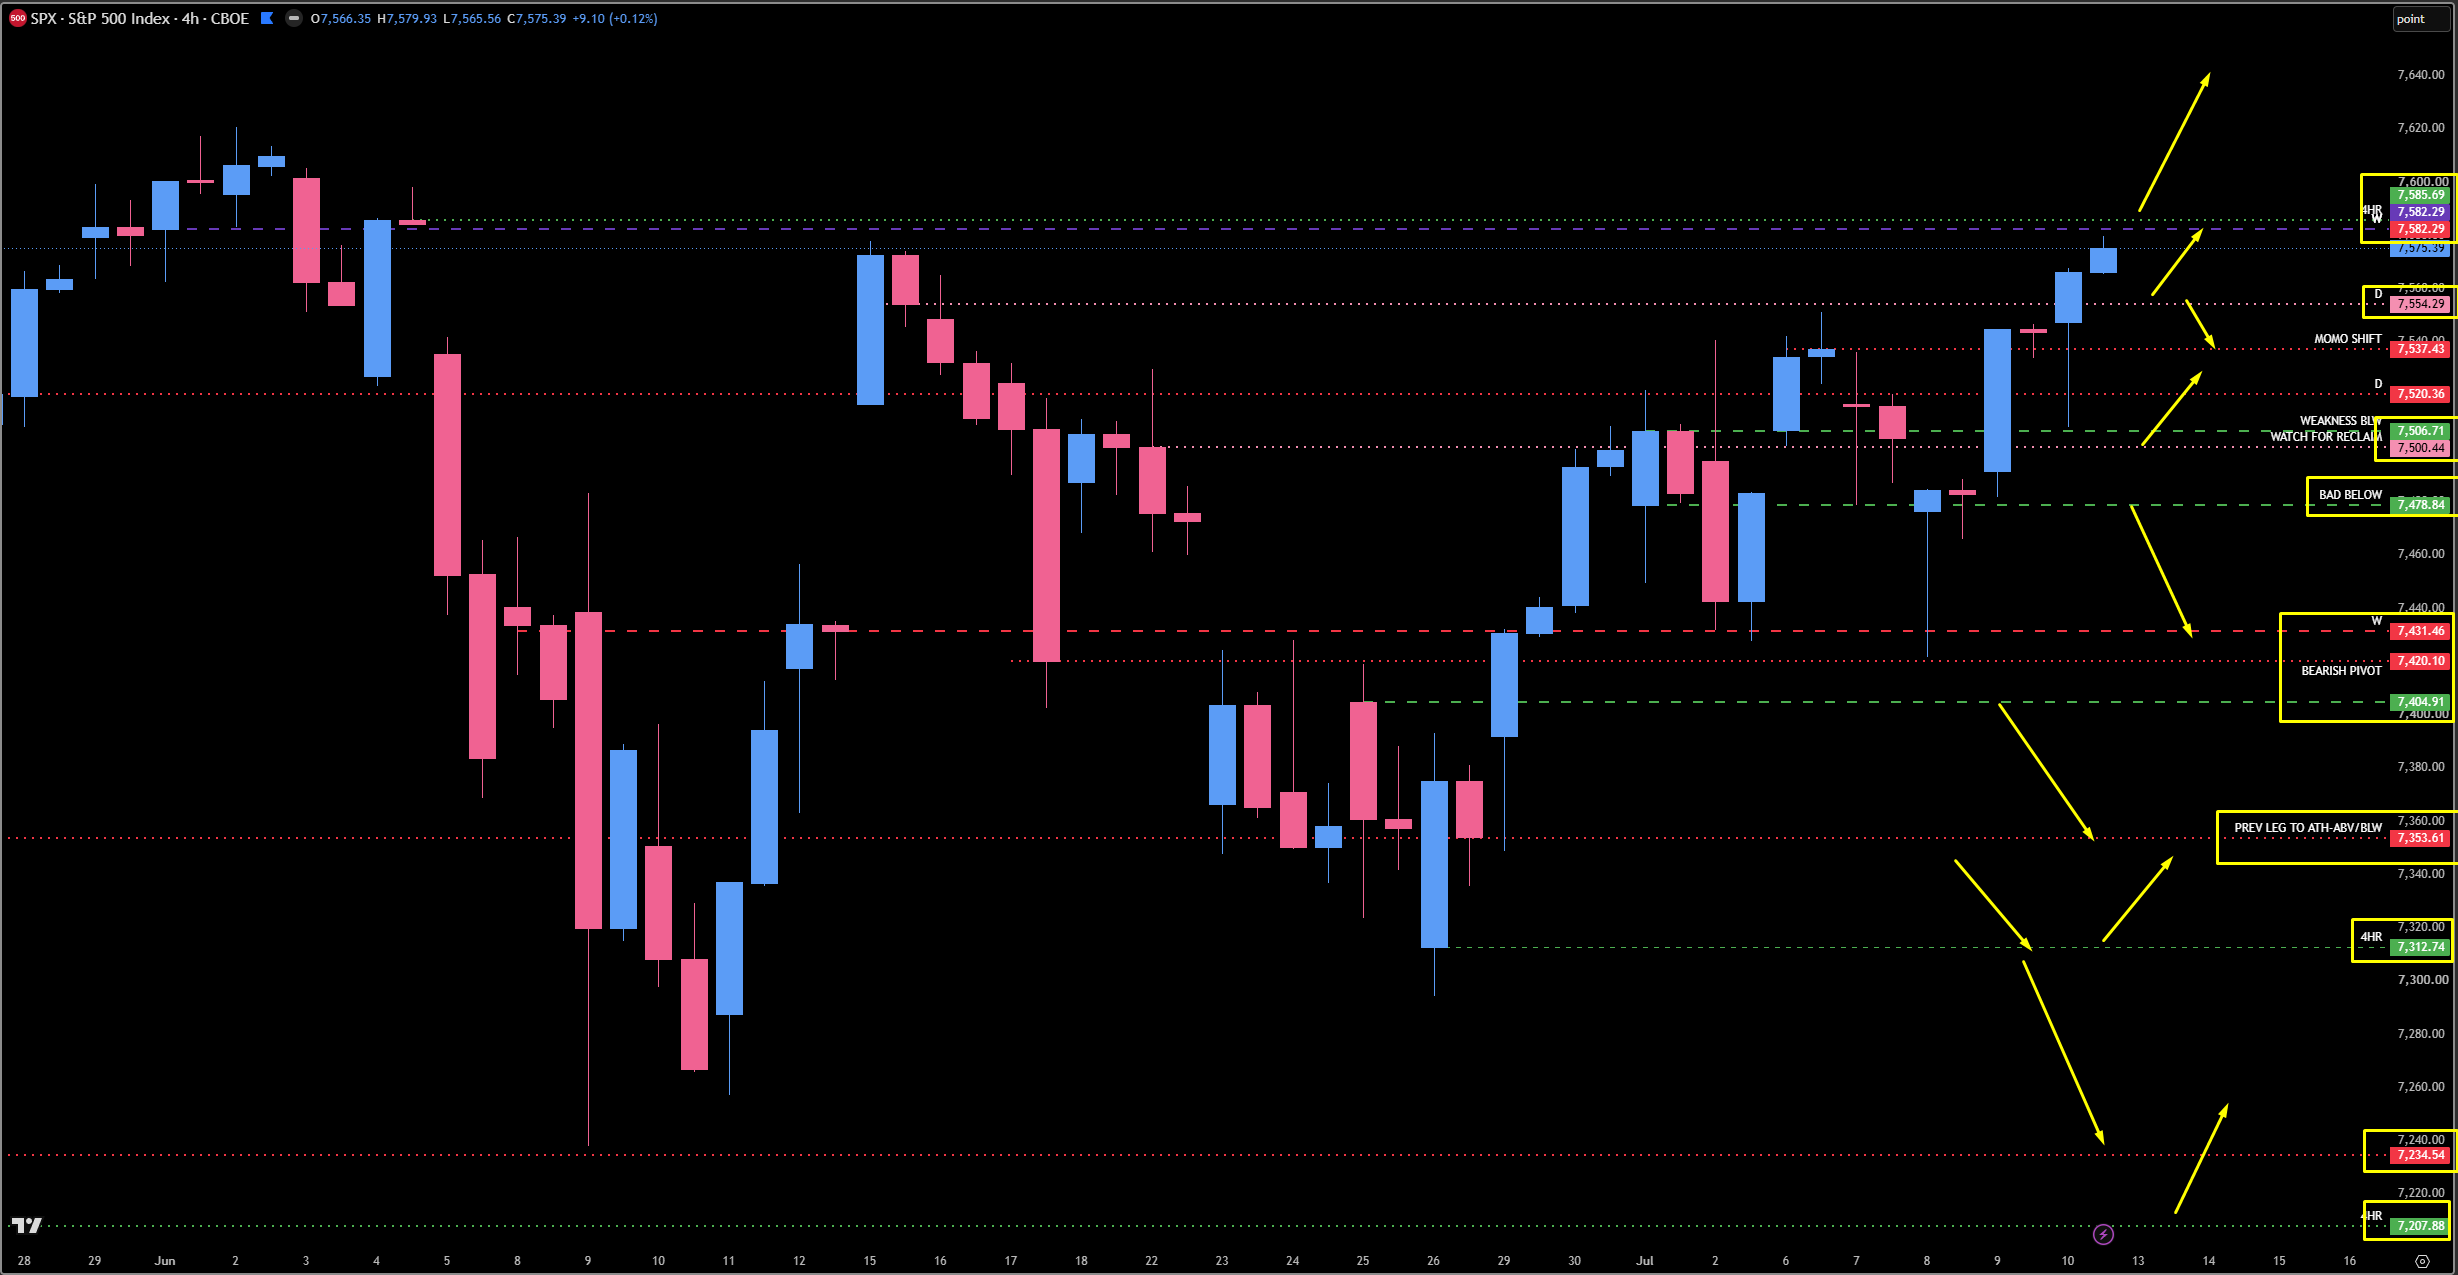
VIX is a monster of a mess right now, but the message is clear: it is progressing down and showing real weakness. We smacked the big weekly a few weeks ago, popped up to hit 20.78 two Fridays ago, popped again to hit 18.41, and have been coming down ever since. Most importantly, we closed the weekly beneath 15.32 — the big prior push-up level — which is a significant sign of weakness. We have already come down and touched the 14.95 monthly, which played really to the tick.
The Suppressed Drift: As long as we stay underneath 15.32 (now untested resistance from the backside) and the 15.03 monthly, VIX continues to drift lower — potentially all the way down into the 13.60 area from a weekly standpoint. Now that we are under this big leg to the high, there is a lot of downside potentially left, which keeps the tailwind on the indices.
The First Support: 14.49 (Daily). This is our first area of support and it is going to be a biggie. I am looking for 14.49 to play and get back above the 14.95 monthly and ultimately the 15.32 weekly if VIX is going to resume its progression higher — they could even sweep these lows and come back over for a pop. However, if 14.49 only gives a small reaction, that can send the indices down pretty fast — 50 to 100 points, no big deal.
The Caution Zone: When we get down into the 14-13 handle, it gets sketchy and we have to be very careful. This is a byproduct of over-complacency near all-time highs: VIX drifts down, then a little geopolitical news hits, VIX spikes 10-20%, and the indices crash down only to get bought back up. Knee-jerk reactions immediately send the indices down with an inverse VIX spike — do not treat a low VIX as a reason to be complacent.
🎯 Detailed Actionable Trade Plan (ES Futures)
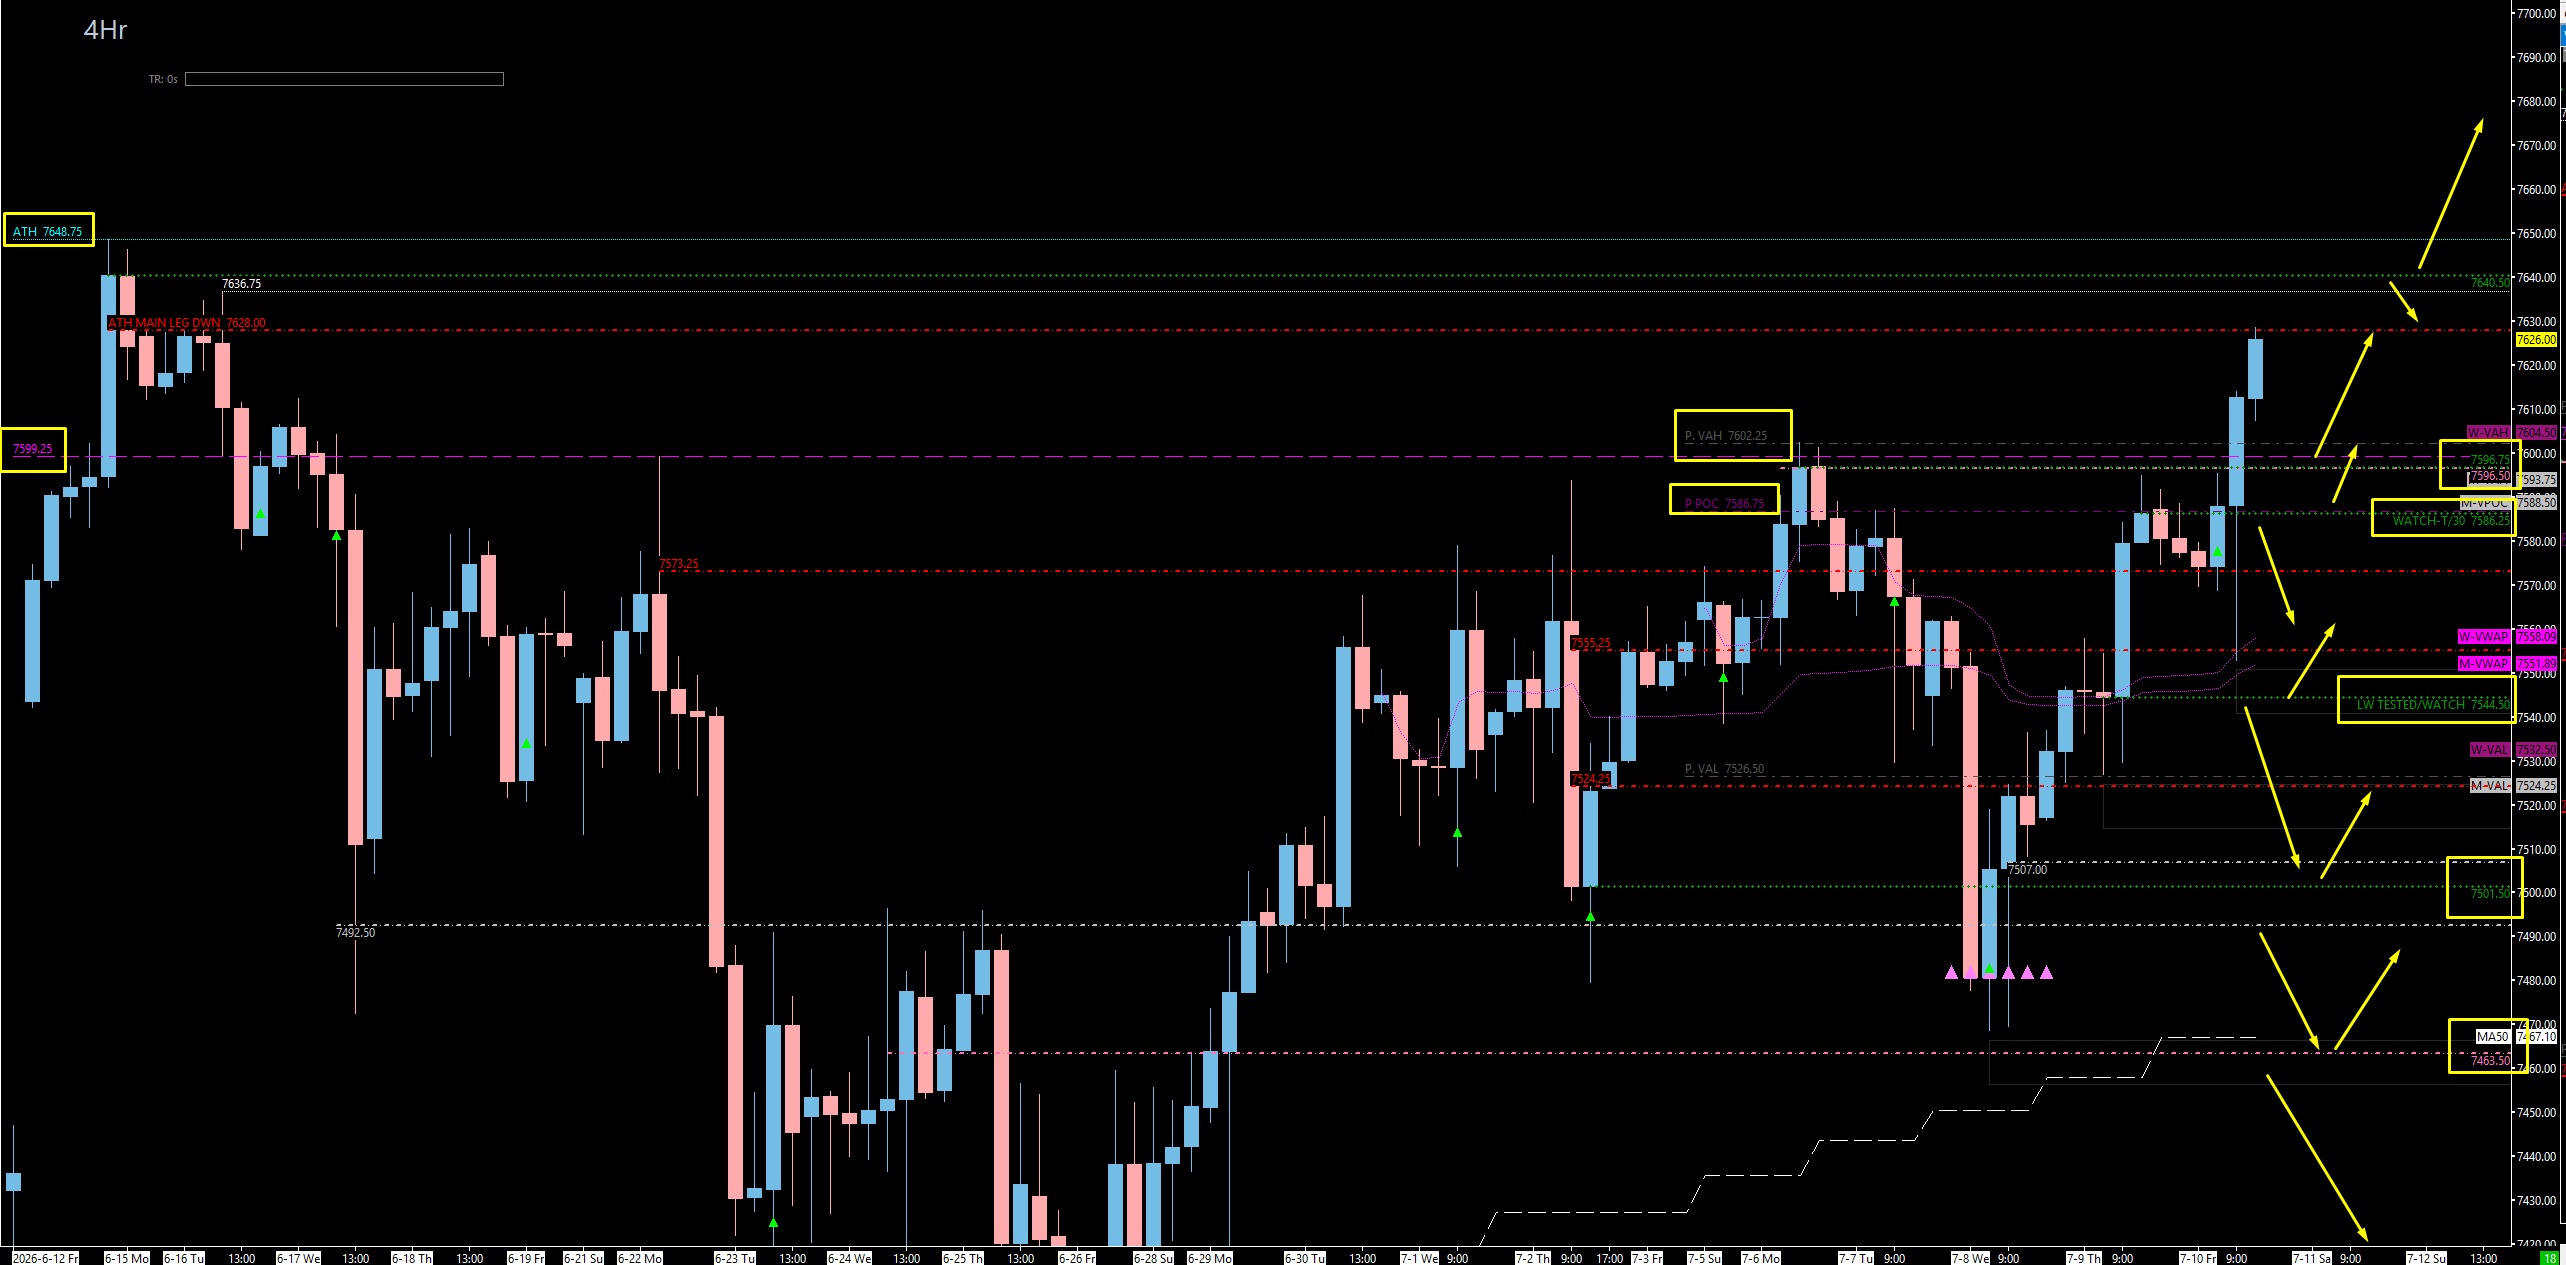
This is a defined, bullish week with the wedge poised to break. The process points up off the weekly close above 7599, targeting the 7628 main leg down first and ultimately new all-time highs at 7648.75. The entire bullish thesis rests on one major support confluence: 7596.50 - 7602 — a stack of daily, four-hour, weekly, and Previous Weekly VAH that is the only untested area of support and the true line we need to hold. Below there, we lean on the 7586.75 Previous Weekly POC and the 7586.25 four-hour, then it thins out fast down to the 7544.50 four-hour, the 7525-7527 Previous Weekly VAL, and ultimately the first untested level below at 7463.50.
🔴 Key Resistance Zones & Setups
The Main Leg Down: 7628.00
7628.00 (Tested Daily — Main Leg Down From All-Time High).
Context: This is the big daily I have written off a bit in the past, but the picture has changed: now that we have closed above 7599 and gained on the weekly and the daily (with the 7596.50 leg down gained), I believe we make new all-time highs regardless. That said, I do not want to be complacent, because this is truly our main leg down from the all-time high — the highest tested leg on the board. Technically speaking it is tested, but I would be cautious because it could get a reaction.
Actionable Setup: Short Setup / T1: I do think this area gets a smack and comes down, bringing us right back into the 7596.50-7599.25 support. Treat 7628 as your first target (T1) on the way up and a probable reaction zone. A clean acceptance above turns 7628 into resistance-turned-support and opens the door to fresh highs.
Warning: Do not chase blindly through 7628 — it is the main leg down and deserves respect on the first touch.
The New All-Time High Target: 7648.75
7648.75 (Projected New All-Time High).
Context: This is the exact level my process projects off the weekly close above 7599 — a high probability of a new all-time high here. This is our T2 target and the doorway to price discovery mode.
Actionable Setup: After a reaction at 7628, the 7596.50-7599 support should launch us back to 7628 for T1 and ultimately 7648.75 for T2 — new all-time highs and price discovery. We do not need it to make sense; we just need to make dollars and follow the chart.
🔵 Key Support Zones & Setups
The Big Major Support — Massive Confluence: 7596.50 - 7602.00
7602.00 (Previous Weekly Value Area High), 7599.25 (Tested Weekly), 7596.75 (Four-Hour), 7596.50 (Daily — Only Untested Support).
Context: This is the whole ballgame on the support side and my favorite spot on the board. We have a daily at 7596.50, a four-hour at 7596.75, the weekly at 7599.25, and the Previous Weekly VAH at 7602 all stacked together — and the 7596.50 daily is my only untested area of support. This level is super fat: look at how many times 7599 sent us down prior. It gave us a gorgeous test from the bottom side, and we have every reason to believe 7596.50 through 7599 provides a fantastic reaction.
Actionable Setup: Buy Setup: This is the true major support we need to hold. On a back-test, look for a reaction here and a reclaim to continue the progression up — a hold here should send us right back to 7628 (T1) and ultimately new all-time highs (T2). This is the same concept I gave on SPX with 7554.
Warning: If 7596.50-7599 does not hold, we could potentially come all the way down to 7463.50, because everything between here and there is tested. This is the line in the sand for the bullish thesis.
The Previous Weekly POC & 4-Hour: 7586.25 - 7586.75
7586.75 (Previous Weekly Point of Control), 7586.25 (Four-Hour — Technically Untested).
Context: Directly below the major confluence sits the 7586.75 Previous Weekly POC — and look how many times it has played from the bottom side; it is getting real love. Right at it is another four-hour level at 7586.25, which is technically untested.
Actionable Setup: Buy Setup: If the top confluence gives way, watch 7586.25 to play and get back above roughly 7599 for continuation higher. Just watch it to make sure it holds — the POC love below is encouraging, but require the reclaim before trusting it.
The Trouble Line & LW 4-Hour: 7544.50 - 7562.00
7562.00 (Big-Time Trouble Below), 7544.50 (Four-Hour — Long-Wick Tested).
Context: Underneath 7562 is where we truly start to get into big-time trouble on the indices. Below that, the only thing I have is a four-hour at 7544.50, and it is a long-wick tested level — a wick ran through it — so it is on my chart to watch, not to jump out of the car for.
Actionable Setup: Conditional Long: If 7544.50 plays, I will wait for us to get back above 7555 to get long. Underneath this, it gets ugly and it gets ugly real fast.
Warning: Below 7544.50, the support thins dramatically. Do not force longs here without the reclaim.
The Previous Weekly VAL: 7525.00 - 7527.00
7527.00 (Previous Weekly Value Area Low), 7525.00 (Zone Low).
Context: This is the 7524-7527 area we played multiple times and held — the Previous Weekly Value Area Low. As you can imagine, everything goes bad underneath that.
Actionable Setup: Treat 7527 as the final structural floor of the balance. A sustained break below flips the entire bullish thesis and opens the door to the untested level far below.
Warning: Everything goes bad underneath 7527. This is the level that ends the breakout story if lost.
The First Untested Below: 7463.50
7463.50 (Daily — First Untested Level Below 7596).
Context: This is the first untested level underneath the 7596 confluence — everything between here and there is tested. If we lose the major support and cannot hold the VAL, this is where we come, based purely on what is tested and untested.
Actionable Setup: Conditional Long: A flush into 7463.50 would be the first genuinely untested high-timeframe buy on a deep pullback. Look for a first-touch reaction, but understand that getting here means the breakout thesis has failed.
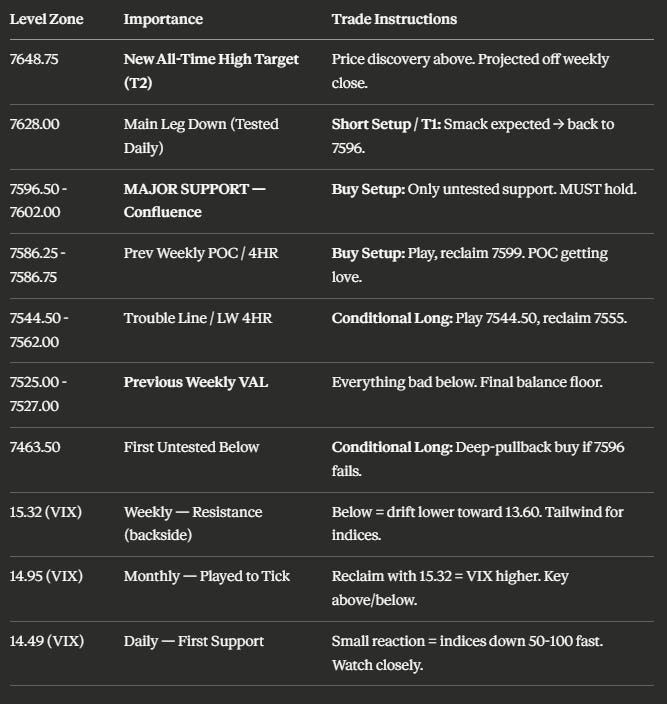
📌 Cheat Sheet – Key Levels Recap
🧠 Final Thoughts
This is a very defined week, and I love the way this chart looks. We have been in a massive balance for four to five weeks, and we are now starting to push higher after buyers accepted value — we are potentially on the verge of breaking this wedge out to new all-time highs. The big kicker was the super solid weekly close above 7599, which in my process gives us a high probability of tagging 7648.75 for a new all-time high. The path is clean: a reaction at the 7628 main leg down is the first target (T1), and then new all-time highs are T2 and price-discovery mode. We do not need to know why the market does what it does — we just need to follow the chart and make dollars.
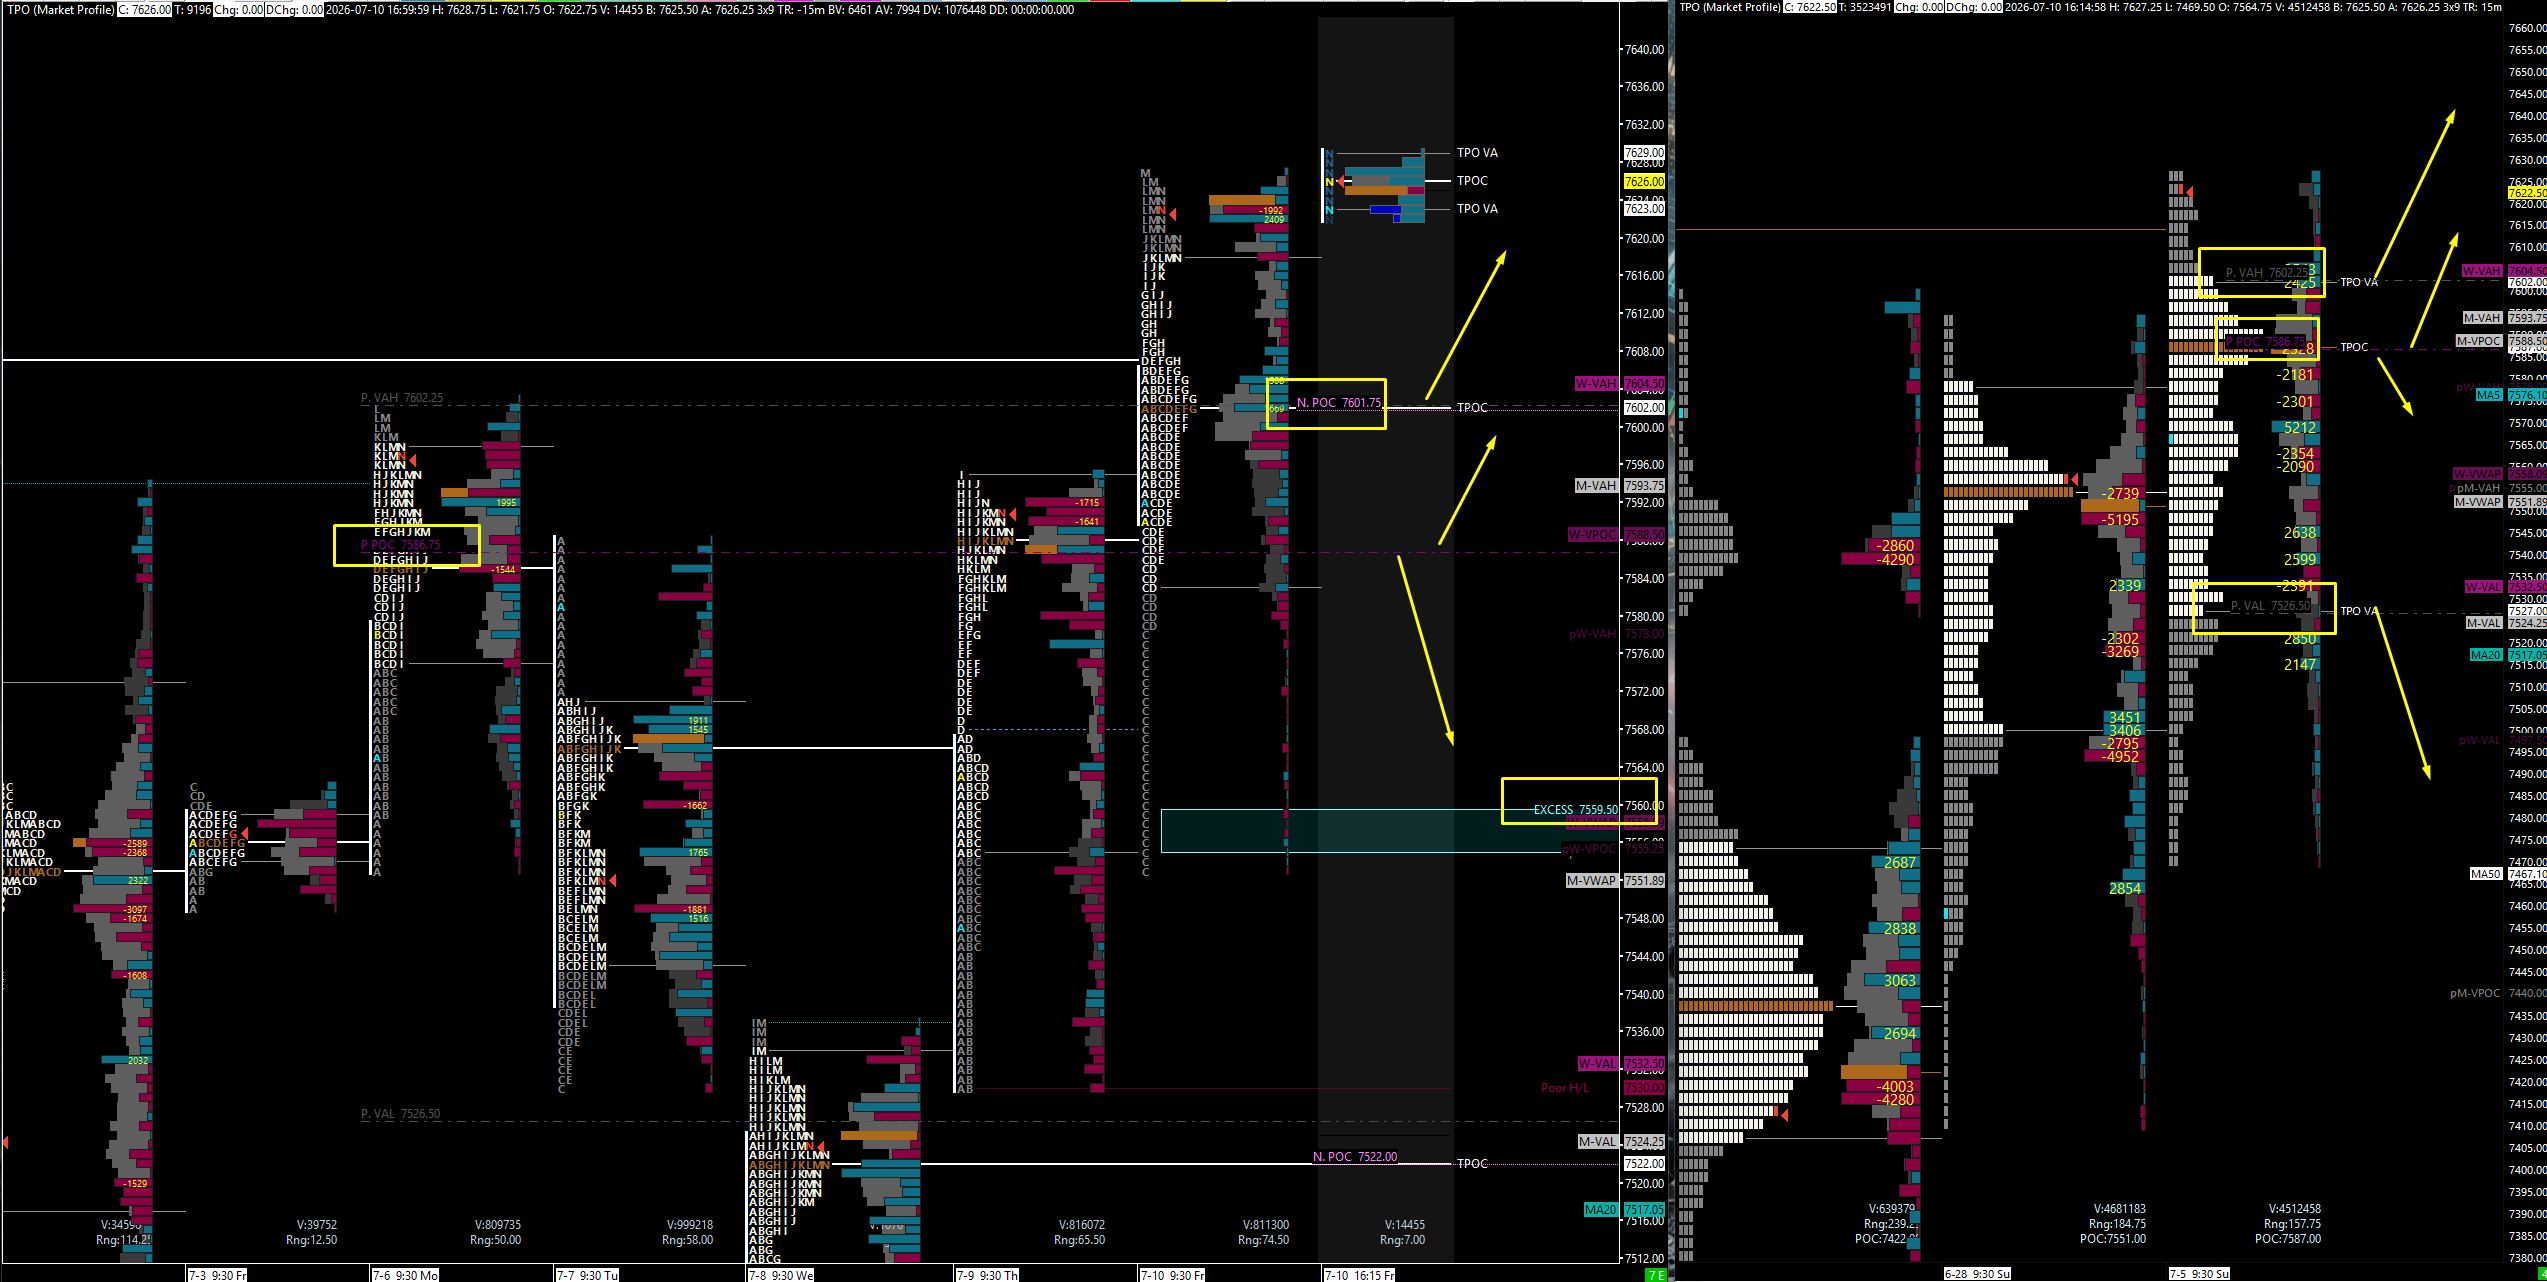
Everything hinges on the 7596.50 - 7602 major support confluence — a daily, four-hour, weekly, and Previous Weekly VAH all stacked together, and my only untested area of support. Hold it and we keep trucking higher; lose it and we lean on the 7586.75 Previous Weekly POC, then it thins fast down to the 7544.50 four-hour, the 7525-7527 Previous Weekly VAL where everything goes bad, and ultimately the first untested spot at 7463.50. On SPX, mirror it with 7554 as the main bet and 7500 as the make-or-break. Keep VIX as your barometer: it closed weak below 15.32 and is drifting toward 13.60, which favors the upside — but do not get complacent down in the 14-13 handle, because a knee-jerk reversal off 14.49 can send the indices down fast. Stay patient, respect the confluence, and let this breakout prove itself.
Make sure you sign up for the Funded Trader Blueprint this Thursday at 7 PM — spending a thousand of your own to potentially make ten thousand a month on other people’s money is always lucrative, and I will give you all the tips. I will see you at 5 PM tomorrow for the post-market breakdown, and all my homies in the Discord room and Inner Circle bright and early in the morning as we conquer the week.
Until next time—trade smart, stay prepared, and together we will conquer these markets!
Ryan Bailey, VICI Trading Solutions.
📊 TradingView Indicator String
Copy and paste the levels below into your S&P Edge Levels indicator to automatically plot today’s key levels on your chart:
7640.50|4HR|4H
7628.00|Tested D|TD
7602.00|P.W. VAH|GD
7599.25|Tested WK|TW
7596.75|4HR|4H
7596.50|D|D
7586.25|4HR|4H
7544.50|Tested 4HR|T4
7527.00|P.W. VAL|GD
7463.50|D|D


