

Welcome back everyone, and happy Weekend Review. I hope everyone had a fantastic weekend — we had another July 4th three-day holiday, which was phenomenal for me. I absolutely loved the chance to let the batteries charge, spend time with the family, touch some grass, and work around the house. There is so much more to life than these charts, even though they seem to consume us, so I hope you got out there and spent some time on yourself and the things that need to get done.
With that being said, we find ourselves in a very critical position once again. As you guys know, I have been talking about this 7573 area on ES for some time — the big massive resistance that has kept us suppressed. As of this writing on Sunday, we are still very much below it. But here is the wrinkle: they have smacked this area about three solid times and have not sent us down yet. So are they going to continue the downside move, or are we going to make a push for all-time highs? That is yet to be determined. What we do know is that there are significant levels in play, and we are going to use VIX as our tiebreaker to make an educated move. I am going to keep it very skinny today — just VIX and ES — and let you get back to your Sunday.
A Note on This Week’s Market:
News: We just came off the July 4th three-day holiday, so keep an eye on the open for any developments that built up over the long weekend. Anything can happen into Monday, especially given how coiled and fragile this structure is right now.
Structure: The weekly TPO shows us in a massive multi-week balance — last week was completely contained within the prior week, and our closing price sits literally at the 6/14 week’s point of control. We have five overlapping weeks of back-and-forth rotation, which has wiped out a ton of price action and left the support below extremely rare and thin. This makes picking a direction genuinely difficult and forces us to lean hard on the process.
Range: We are accepting value at the highs, and if they want to continue pushing higher, they can. But we have been in rotation for a long time, so the read is not clean — this is a chop-and-decide environment, not a runaway.
VIX Tiebreaker: VIX is suppressed below the 17.44 / 17.19 midpoint and drifting into the 16.20 monthly, which gives me a bullish lean for the indices. But VIX has not been giving the pops needed to send the indices down and fix back up, and we are watching for a potential reversal at the lows. This is the tiebreaker for direction all week.
Trend: Fragile. We are still below the 7573 make-or-break, unable to gain on the daily or four-hour timeframes. I have a bullish lean on suppressed VIX, but it is not confirmed — and everything goes bad underneath 7458.50, where there is very little support left beneath us.
🧠 Current Market Context
The 7573 Make-or-Break & The Five-Week Balance
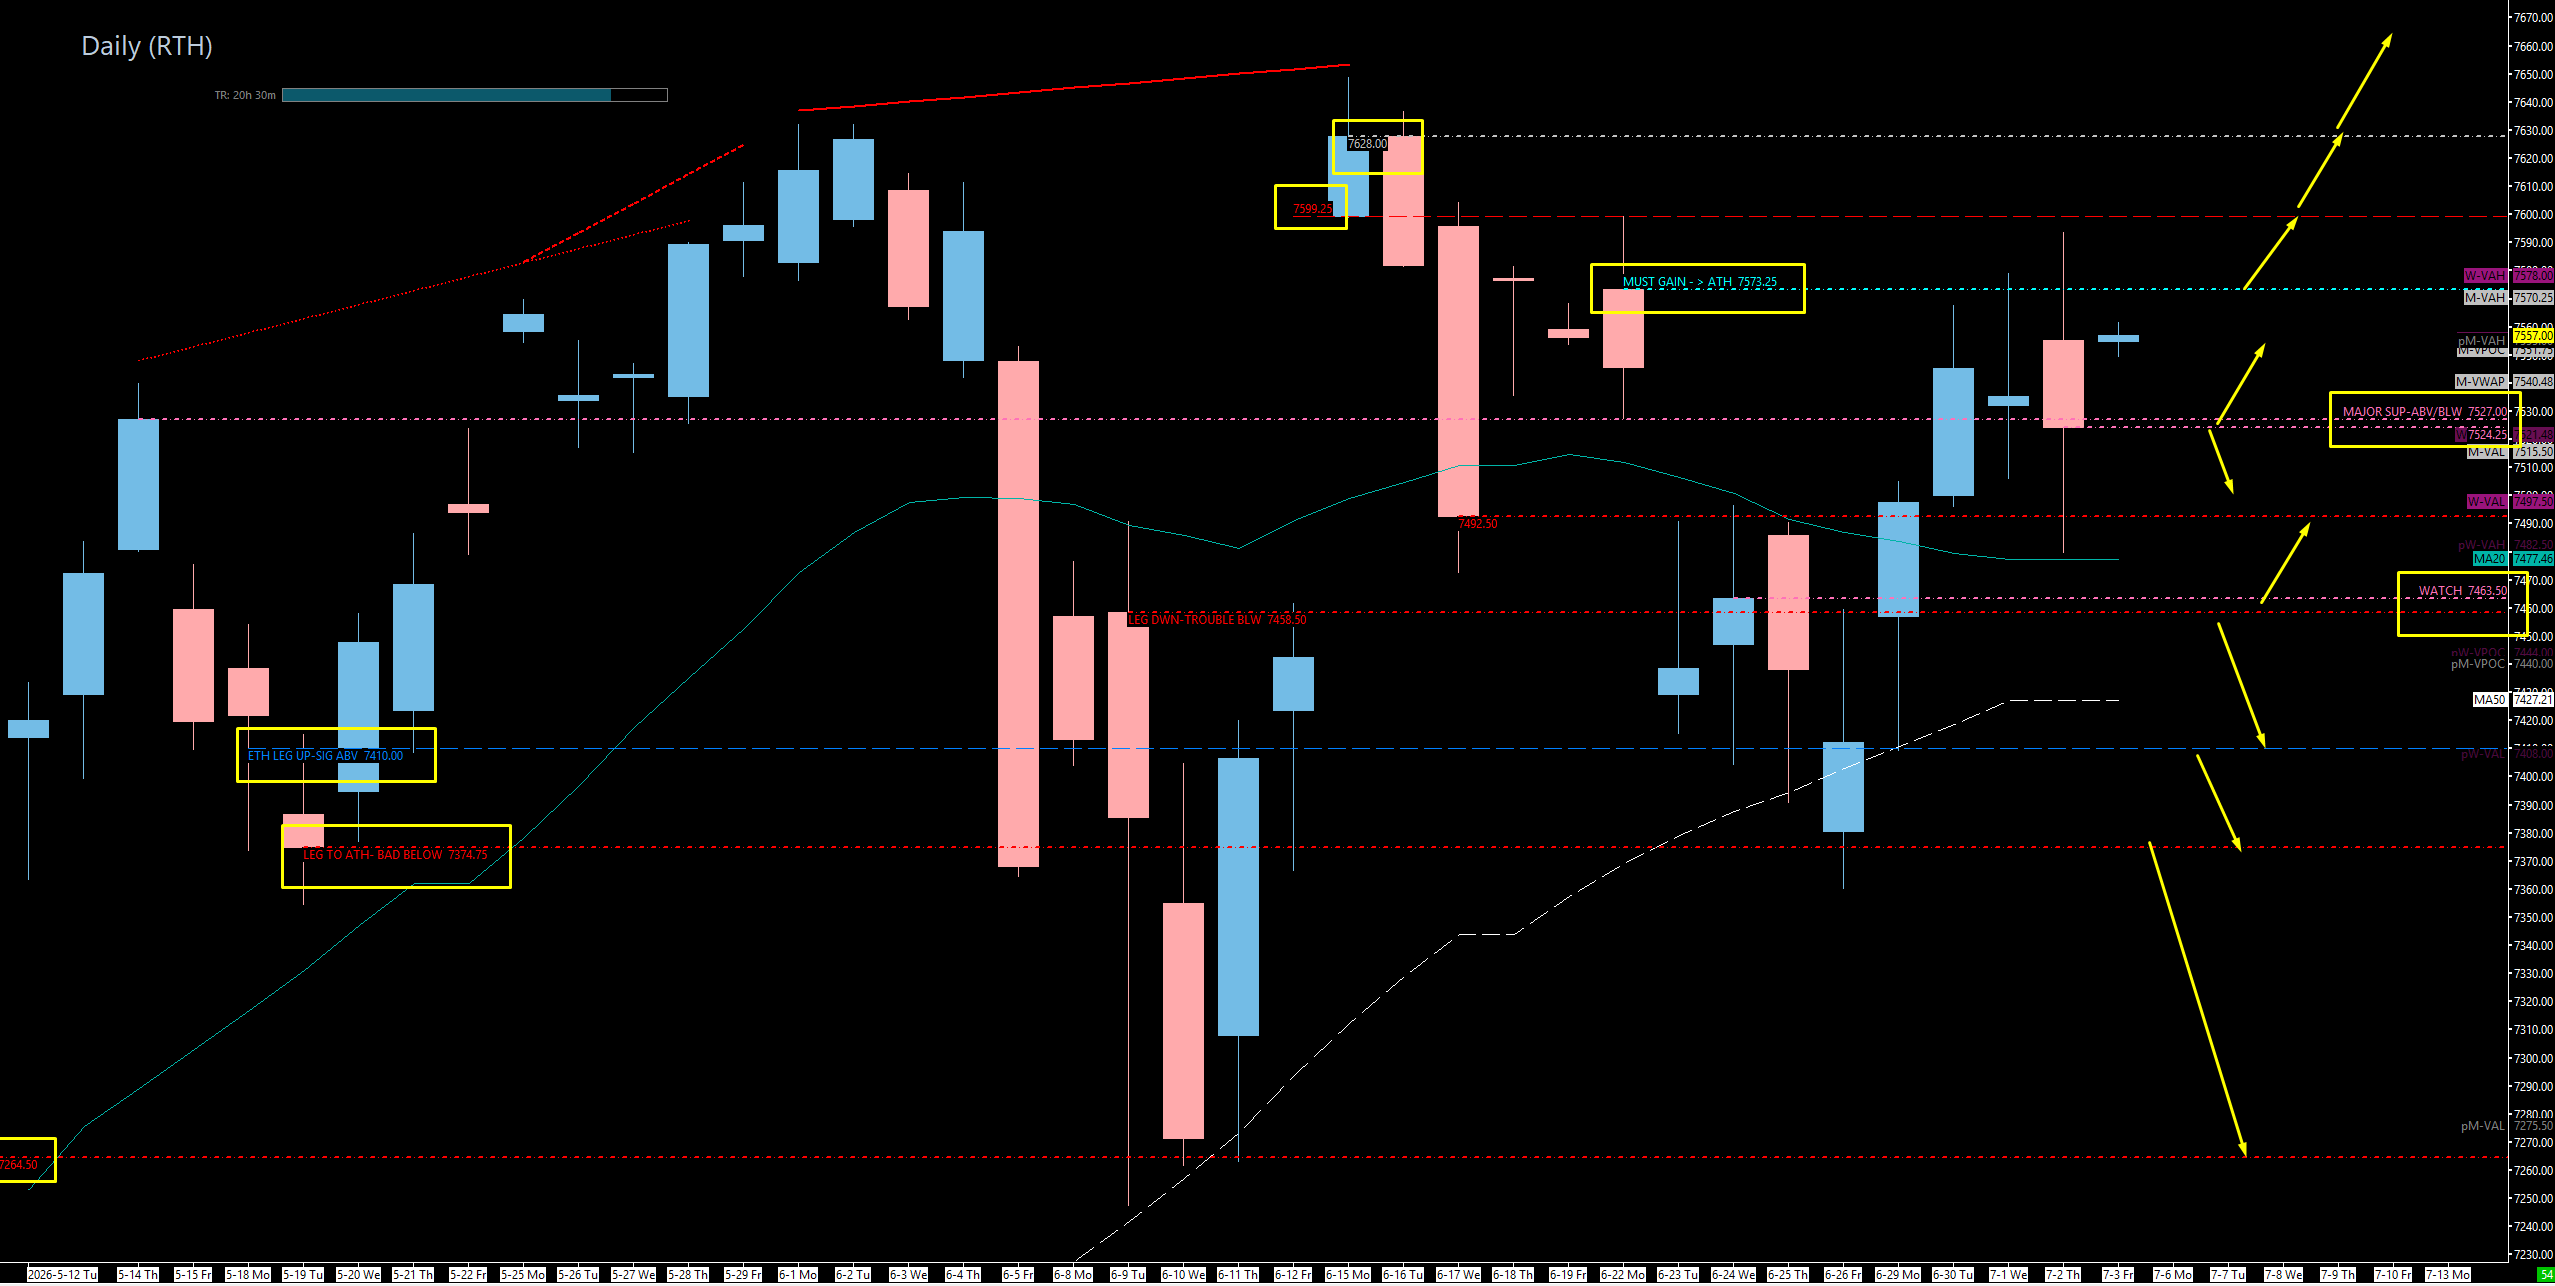
We are sitting in one of the most critical, coiled-up positions we have seen — a true make-or-break that has defined the entire last week of trading. The 7573 daily is our leg-down inception, and we have smacked it over and over, playing it three times without price being able to push higher. Let me be clear: if price cannot push above 7573, we will end up coming down. But they have been up here multiple times and still failed to push it lower, so this cuts both ways. This is where everything either goes back to all-time highs or it all goes bad — and it is truly our big decision point.
The weekly TPO tells the difficult part of the story. Last week’s price action was completely contained within the previous week, and we closed right at the 6/14 week’s point of control. We now have roughly three — technically as many as five — overlapping weeks of balance stacked on top of each other, and all that back-and-forth rotation has wiped out a large amount of the underlying price action. That is important: it leaves the support below extremely thin. We are accepting value at the highs and could push higher if they want it, but the extended rotation does not give a clean directional picture, which is exactly why we lean on the process and our tested-versus-untested framework rather than trying to force a call.
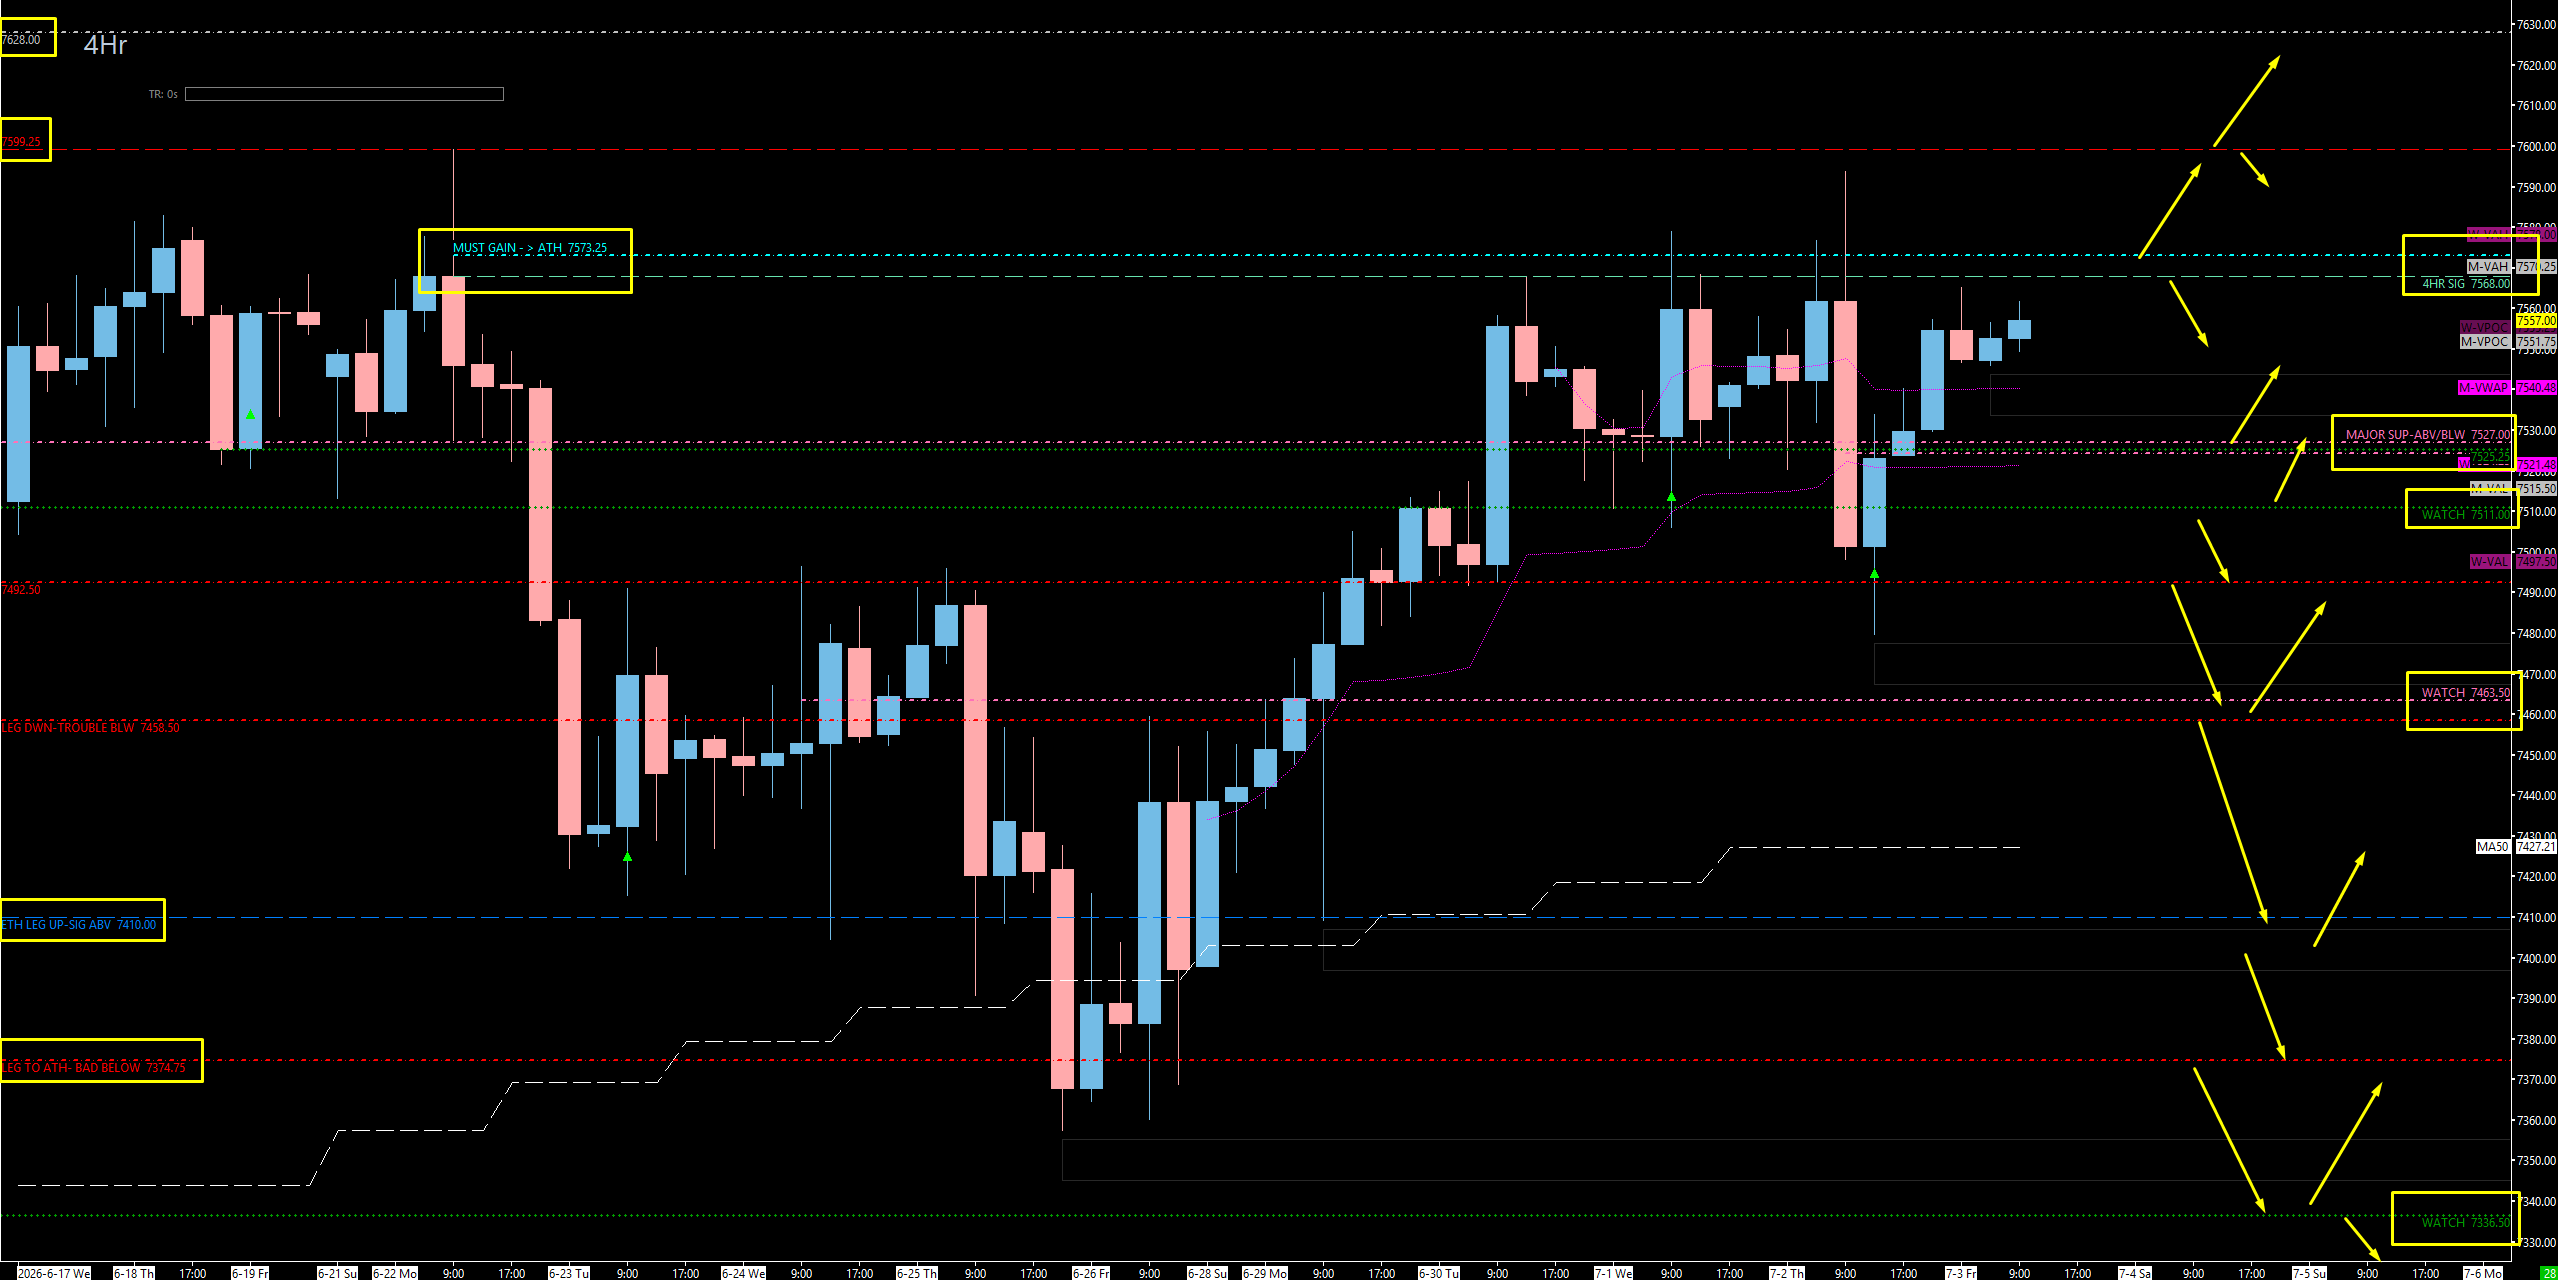
Here is my honest read: I have a bullish lean because VIX clearly looks suppressed — but we still have not gained on the daily timeframe, which concerns me, and there is weakness showing on the four-hour. In fact, we cannot even gain on the four-hour right now; the 7568 level has rejected five or six attempts to close above it, we got slammed down on Thursday and lost four-hour support, and we still cannot close the current four-hour above roughly 7561. So I do not want to give the false perception that everything is great and we are automatically making higher highs — I do not know that. I am leaning on suppressed VIX, but this remains a huge make-or-break pivot. We truly need a daily close above 7573 to cement the daily leg and say we are up on all timeframes.
🚨 VIX Analysis: The 17.44 Midpoint Pivot
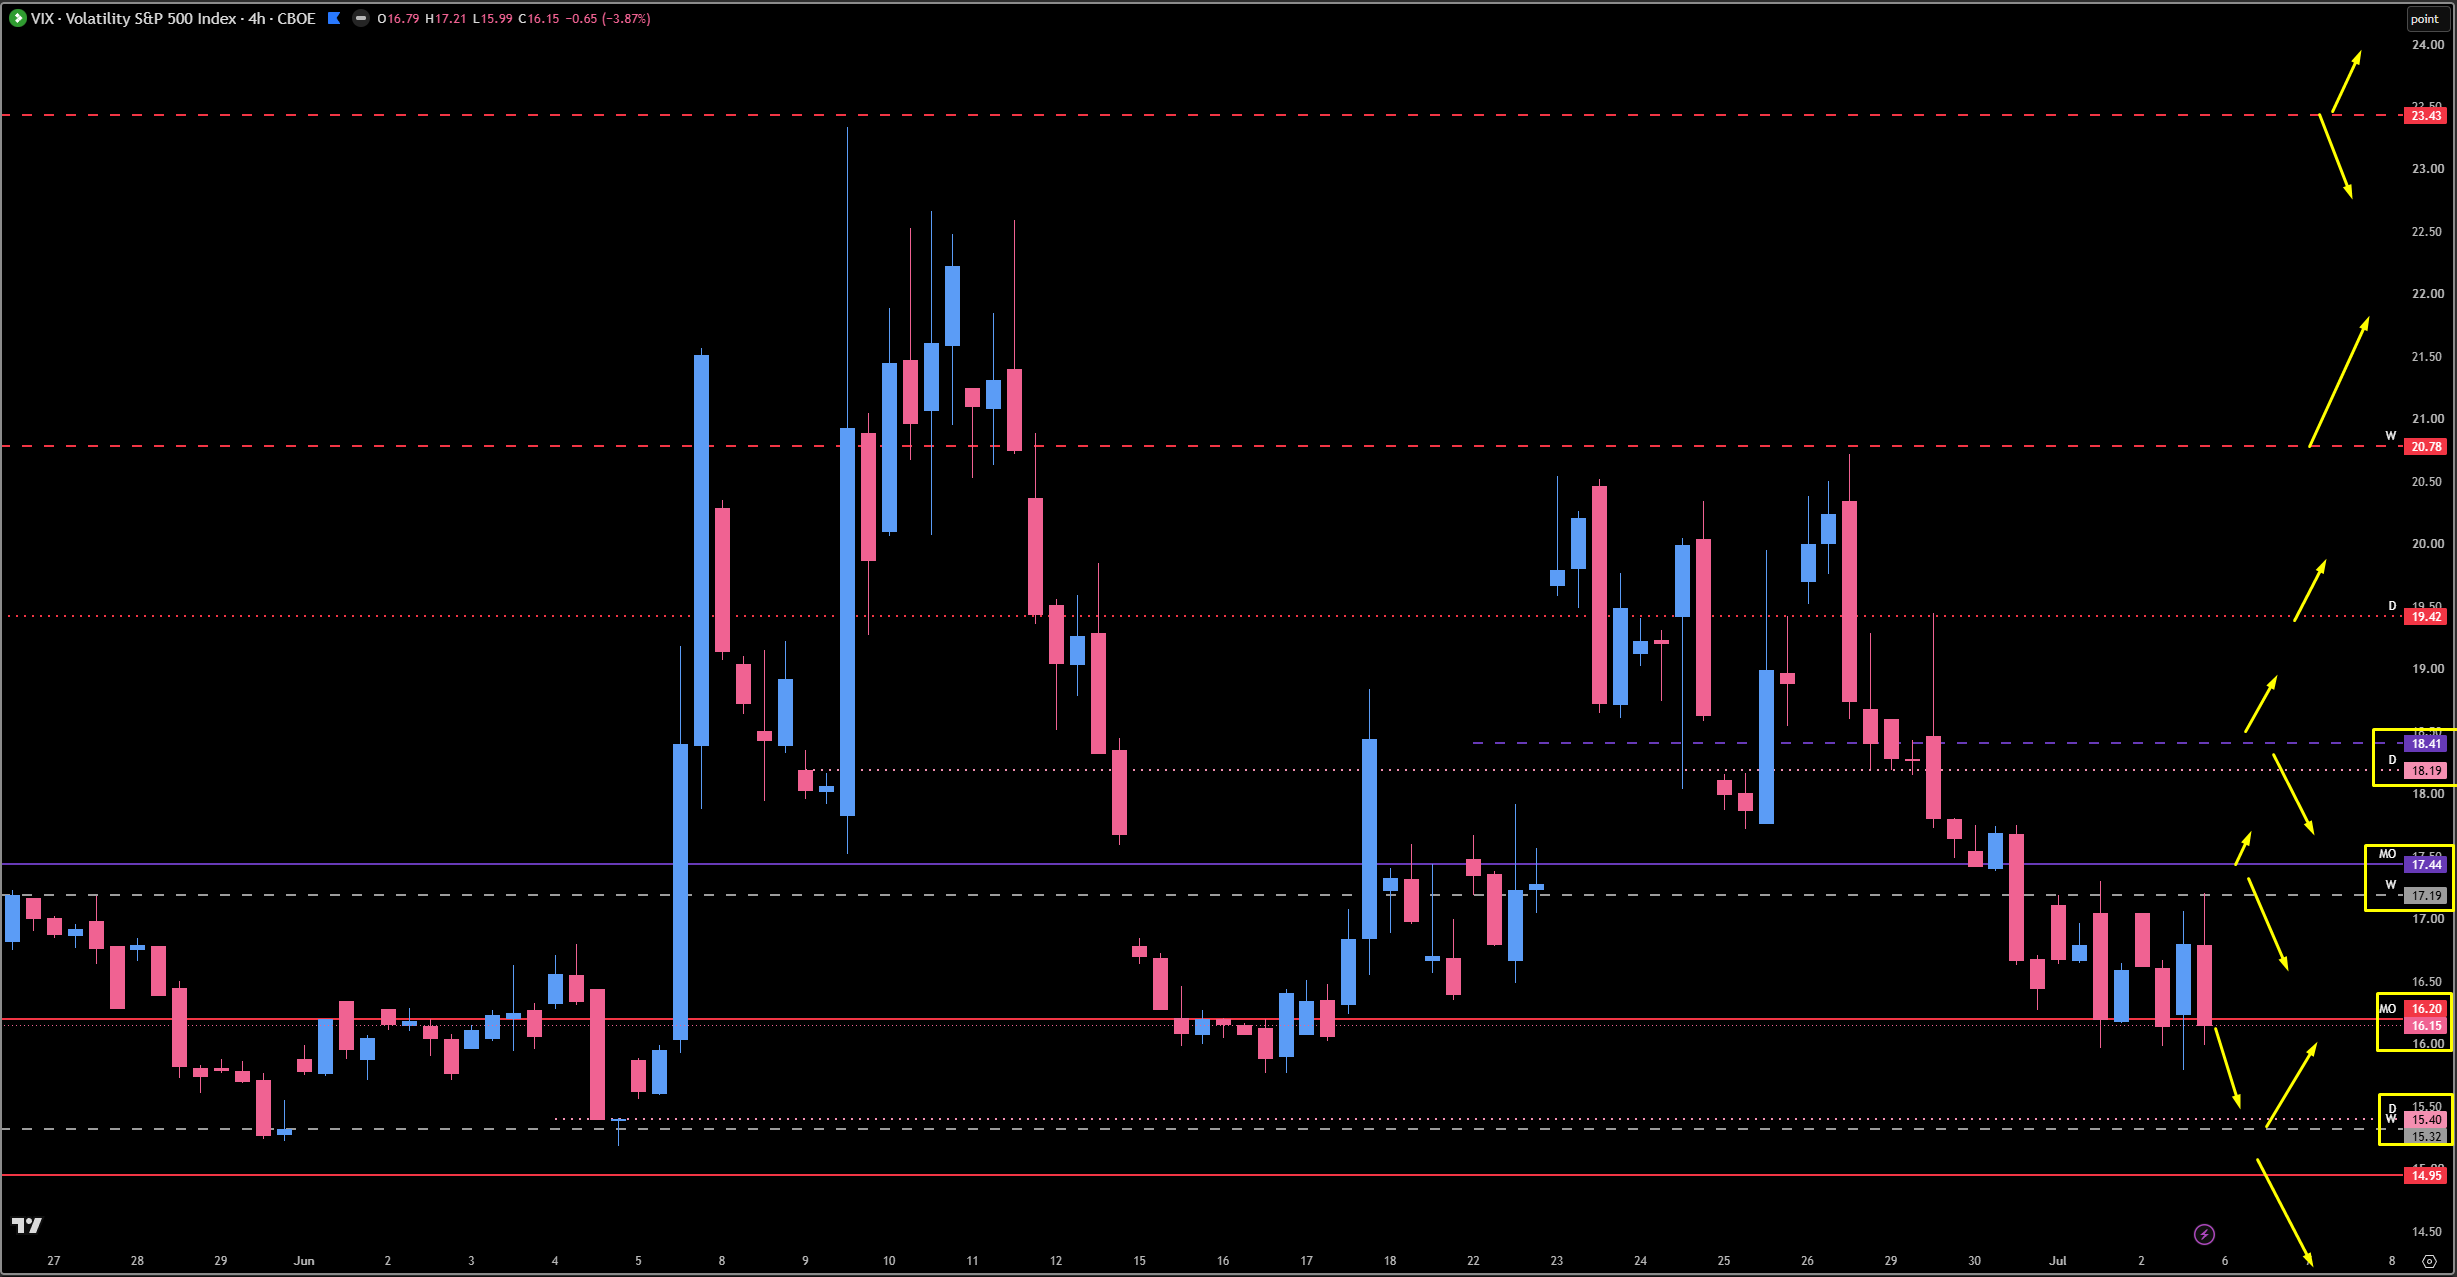
VIX is our tiebreaker this week, and the structure is telling a suppressed story. Last week we smacked the 20.78 weekly, which let us down all week, then back-tested the 19.42 we have talked about, and ultimately ended up below the 17.44 / 17.19 midpoint pivot — the major resistance that kept VIX suppressed and pointed to the downside.
The Midpoint Pivot: 17.19 - 17.44 (Major Above/Below). This is where everything goes up or down. They still have not touched 17.44, which could technically point us to the downside on VIX. As long as VIX stays below this zone — as it currently has — the indices keep their tailwind.
The Ceiling: 18.19 (Untested Daily) and 18.41 (Untested Weekly). If VIX pushes above 17.44, it comes into these two untested areas — a big decision point. VIX will either smack here and come all the way back down, or push above 18.41, at which point there is no untested resistance left and it could just push, push, push. This ceiling should keep a lid on things and keep us pointed lower on volatility.
The Suppressed Drift & The Reversal Watch: VIX has pushed all the way down into the 16.20 monthly and is holding, but it is not giving the pops needed to send the indices down. It certainly seems like VIX wants to continue drifting lower, which gives the indices a tailwind higher. But underneath 16.20, I am watching a very important spot: the 15.40 untested daily (with a tested weekly at 15.32 nearby). Every time we get into the 14-15 handle on VIX, we can expect some sort of reaction — this is just the market being efficient when things get out of line. Do not treat a low VIX as a reason to be complacent. If we come down into 15.40, I would be looking for a potential VIX reversal, which would send the indices down. A reclaim of 15.40, 15.80, and 16.20 would push VIX back up toward the 18.19-18.41 resistance. Don’t look a gift horse in the mouth here — the indices are still extremely fragile with very little support underneath.
🎯 Detailed Actionable Trade Plan (ES Futures)
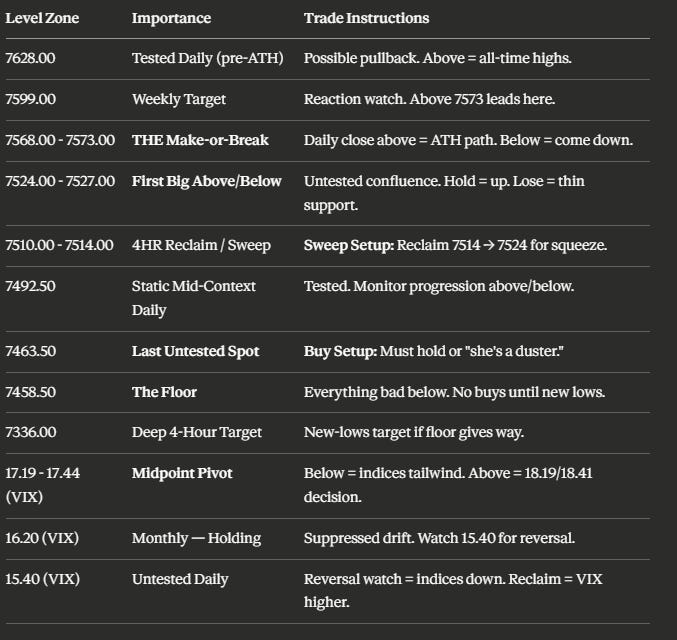
This entire week hinges on 7573 with VIX as the tiebreaker. A daily close above 7573 cements the daily leg, points us to the 7599 weekly and ultimately all-time highs. Below it, we are technically suppressed, and the first big above/below is the untested 7524-7527 confluence. Hold there and we push back up; lose it and we work down through the static 7492.50 to the last untested spot at 7463.50. Underneath the 7458.50 floor, it all goes bad — there is nothing untested for a long time, and no reason to look for buys until we make new lows toward 7336.
🔴 Key Resistance Zones & Setups
The Make-or-Break Breakout: 7568.00 - 7573.00
7573.00 (Very Tested Daily — Leg-Down Inception), 7568.00 (Tested Four-Hour — Significant).
Context: This is the whole ballgame. The 7573 daily is our leg-down inception, and it is very, very tested at this point — we have pushed up into it three times and failed. The 7568 four-hour sits right with it and has rejected five or six attempts to close above it while still holding. Above this cluster is truly our breakout spot that could send us much higher. This is where everything either goes back to all-time highs or it all goes bad.
Actionable Setup: We truly need a daily close above 7573 to cement the daily leg again and confirm we are up on all timeframes. If we stay above 7573 and accept value, we push into the 7599 weekly and ultimately all-time-high territory — there is nothing left untested above this area.
Warning: If price cannot push above 7573, we end up coming down. We still have not gained on the daily or four-hour, so respect this level and let VIX break the tie before committing.
The Weekly Target: 7599.00
7599.00 (Weekly).
Context: We got close to this weekly last week but did not quite reach it. Above 7573, this is the next stop on the path to all-time highs.
Actionable Setup: A push and acceptance above 7573 targets 7599 directly. Watch for a reaction here, but a clear break above keeps us pointed toward fresh price discovery.
The Last Daily Before ATH: 7628.00
7628.00 (Tested Daily).
Context: Above the 7599 weekly, the last daily sits at 7628. It is tested, so we might get a little pullback here, but beyond it we are into all-time highs.
Actionable Setup: Expect a possible pullback on the first touch of 7628; an acceptance above opens fresh all-time-high territory.
🔵 Key Support Zones & Setups
The First Big Above/Below — Untested Confluence: 7524.00 - 7527.00
7527.00 (Daily — Untested From Top Down), 7525.00 (Four-Hour), 7524.00 (Daily — New Leg).
Context: This is our first true, highly confluent untested area and the first big above/below below current price. The 7527 daily is untested from the top down, and if it is not 7527, they have created a new daily leg for us at 7524 — either way, the 7524-7527 daily/four-hour combo is a massive area. This is the immediate line that decides continuation.
Actionable Setup: Hold 7524-7527 and we continue back up toward the 7573 make-or-break. Lose it and we drop into the thinner support below. This is your first key above/below on any pullback.
The Four-Hour Reclaim & Sweep Zone: 7510.00 - 7514.00
7514.00 (Daily — Reclaim Level), 7511.00 (Four-Hour), 7510.00 (Weekly — Sweep Candidate).
Context: If we lose the 7524-7527 combo, we come down and play the 7511 four-hour — not one of my favorite spots, but it is there and it is untested. They may also sweep the 7514 daily and the 7510 weekly and pull a reclaim for a little squeeze.
Actionable Setup: Sweep Setup: If 7511 is going to play and hold, I want to see it get back above 7514 and ultimately the dailies at 7524-7527 for the push higher. Watch for a sweep-and-reclaim of 7510-7514 as the squeeze trigger. Below 7511, there is nothing else untested on the four-hour.
The Static Mid-Context Daily: 7492.50
7492.50 (Tested Daily).
Context: This is a static daily we use to monitor progression — it is not untested, but it played quite a few times, so it gives us good above/below context between the confluence zone and the last untested spot below.
Actionable Setup: Use 7492.50 as an above/below progression marker. Below it, we open the door to the last untested spot at 7463.50.
The Last Untested Spot: 7463.50
7463.50 (Daily — Last Untested).
Context: This is a level I found and, by all process means, it is untested — a daily leg at 7463.50 that could very well play and play well. Once we get under 7492, this is where we come, and it is my last untested spot. Underneath this, it gets really ugly and it gets ugly fast, because I have nothing left untested for a long time.
Actionable Setup: Buy Setup: If price works down to 7463.50, this is the last high-quality untested long on the board — look for a reaction. But 7463.50 has to hold, otherwise she’s a duster.
Warning: Below 7463.50, we are into the floor with nothing untested behind it. Do not lean on anything beneath this without confirmation.
The Floor — Everything Goes Bad Below: 7458.50
7458.50 (Tested Daily — The Major Floor).
Context: Our big major floor has shifted from 7492.50 ultimately down to 7458.50. Underneath 7458.50, it all comes down — we have nothing left untested. This is the level that separates a fragile-but-holding structure from a full breakdown.
Actionable Setup: They must maintain above the 7524-7527 confluence for immediate continuation higher, but 7458.50 is the true floor. A settle below it means there is no reason to be looking for any more buys for quite some time.
Warning: Everything goes bad underneath 7458.50. No more buy-hunting until we make new lows on this leg all the way down toward the 7336 four-hour or even lower.
The Deep Target: 7336.00
7336.00 (Four-Hour — New-Lows Target).
Context: If we push below 7463.50 and lose the 7458.50 floor, we could come all the way down to visit this four-hour at 7336 — the next real spot as we make new lows on the leg.
Actionable Setup: Reference target for the breakdown scenario. This is where we would start looking for the next high-timeframe reaction if the floor gives way.
📌 Cheat Sheet – Key Levels Recap
🧠 Final Thoughts
I wanted to keep this one really clean and simple, because it truly comes down to just a couple of key component levels and one tiebreaker. We are in a critical, coiled-up spot after five weeks of overlapping balance that has wiped out the price action and left the support below extremely thin. The 7573 daily is the make-or-break — a daily close above it cements the daily leg, sends us to the 7599 weekly, and opens the door to all-time highs. As long as we stay below it, we are technically suppressed, and the 7524-7527 untested confluence is the first big above/below on a pullback. Below there, we work through the static 7492.50 to the last untested spot at 7463.50 — and underneath the 7458.50 floor, it all goes bad, with no reason to hunt buys until we make new lows toward 7336.
The tiebreaker is VIX. It looks suppressed below the 17.44 / 17.19 midpoint and is drifting into the 16.20 monthly, which gives me a bullish lean and a tailwind for the indices to push above 7573 for continuation higher. But do not get complacent — if VIX comes down into the 15.40 untested daily, I am watching for a reversal that would send the indices right back down, and this structure is extremely fragile with very little underneath us. We will let VIX tell us whether we drift lower and break out above 7573, or whether we get a reaction at the VIX lows and come down to pick up buyers. It is hard to say — but that is exactly why we have the plan and the process: stick to untested levels, or monitor progression above and below what is tested but significant.
I have given you all the tools and guidance you need to conquer the markets coming into Monday. I look forward to seeing every one of you in the live stream in the Inner Circle first thing Monday morning, and then the post-market breakdown at 5 o’clock tomorrow.
Until next time—trade smart, stay prepared, and together we will conquer these markets!
Ryan Bailey, VICI Trading Solutions.
📊 TradingView Indicator String
Copy and paste the levels below into your S&P Edge Levels indicator to automatically plot today’s key levels on your chart:
7628.00|Tested D|TD
7599.00|WK|W
7573.00|Tested D|TD
7568.00|Tested 4HR|T4
7527.00|D|D
7525.00|4HR|4H
7524.00|D|D
7514.00|D|D
7511.00|4HR|4H
7510.00|WK|W
7492.50|Tested D|TD
7463.50|D|D
7458.50|Tested D|TD
7336.00|4HR|4H

