

Happy Sunday everyone. Today is Sunday, March 22nd, and what an absolutely dominant week we just had. We hit all of our short targets — every single one of them. As many of you know, I have been short for weeks, essentially riding the small pops up but ultimately fading the higher touches so we could move down and sweep the leg lows. And that is exactly what happened.
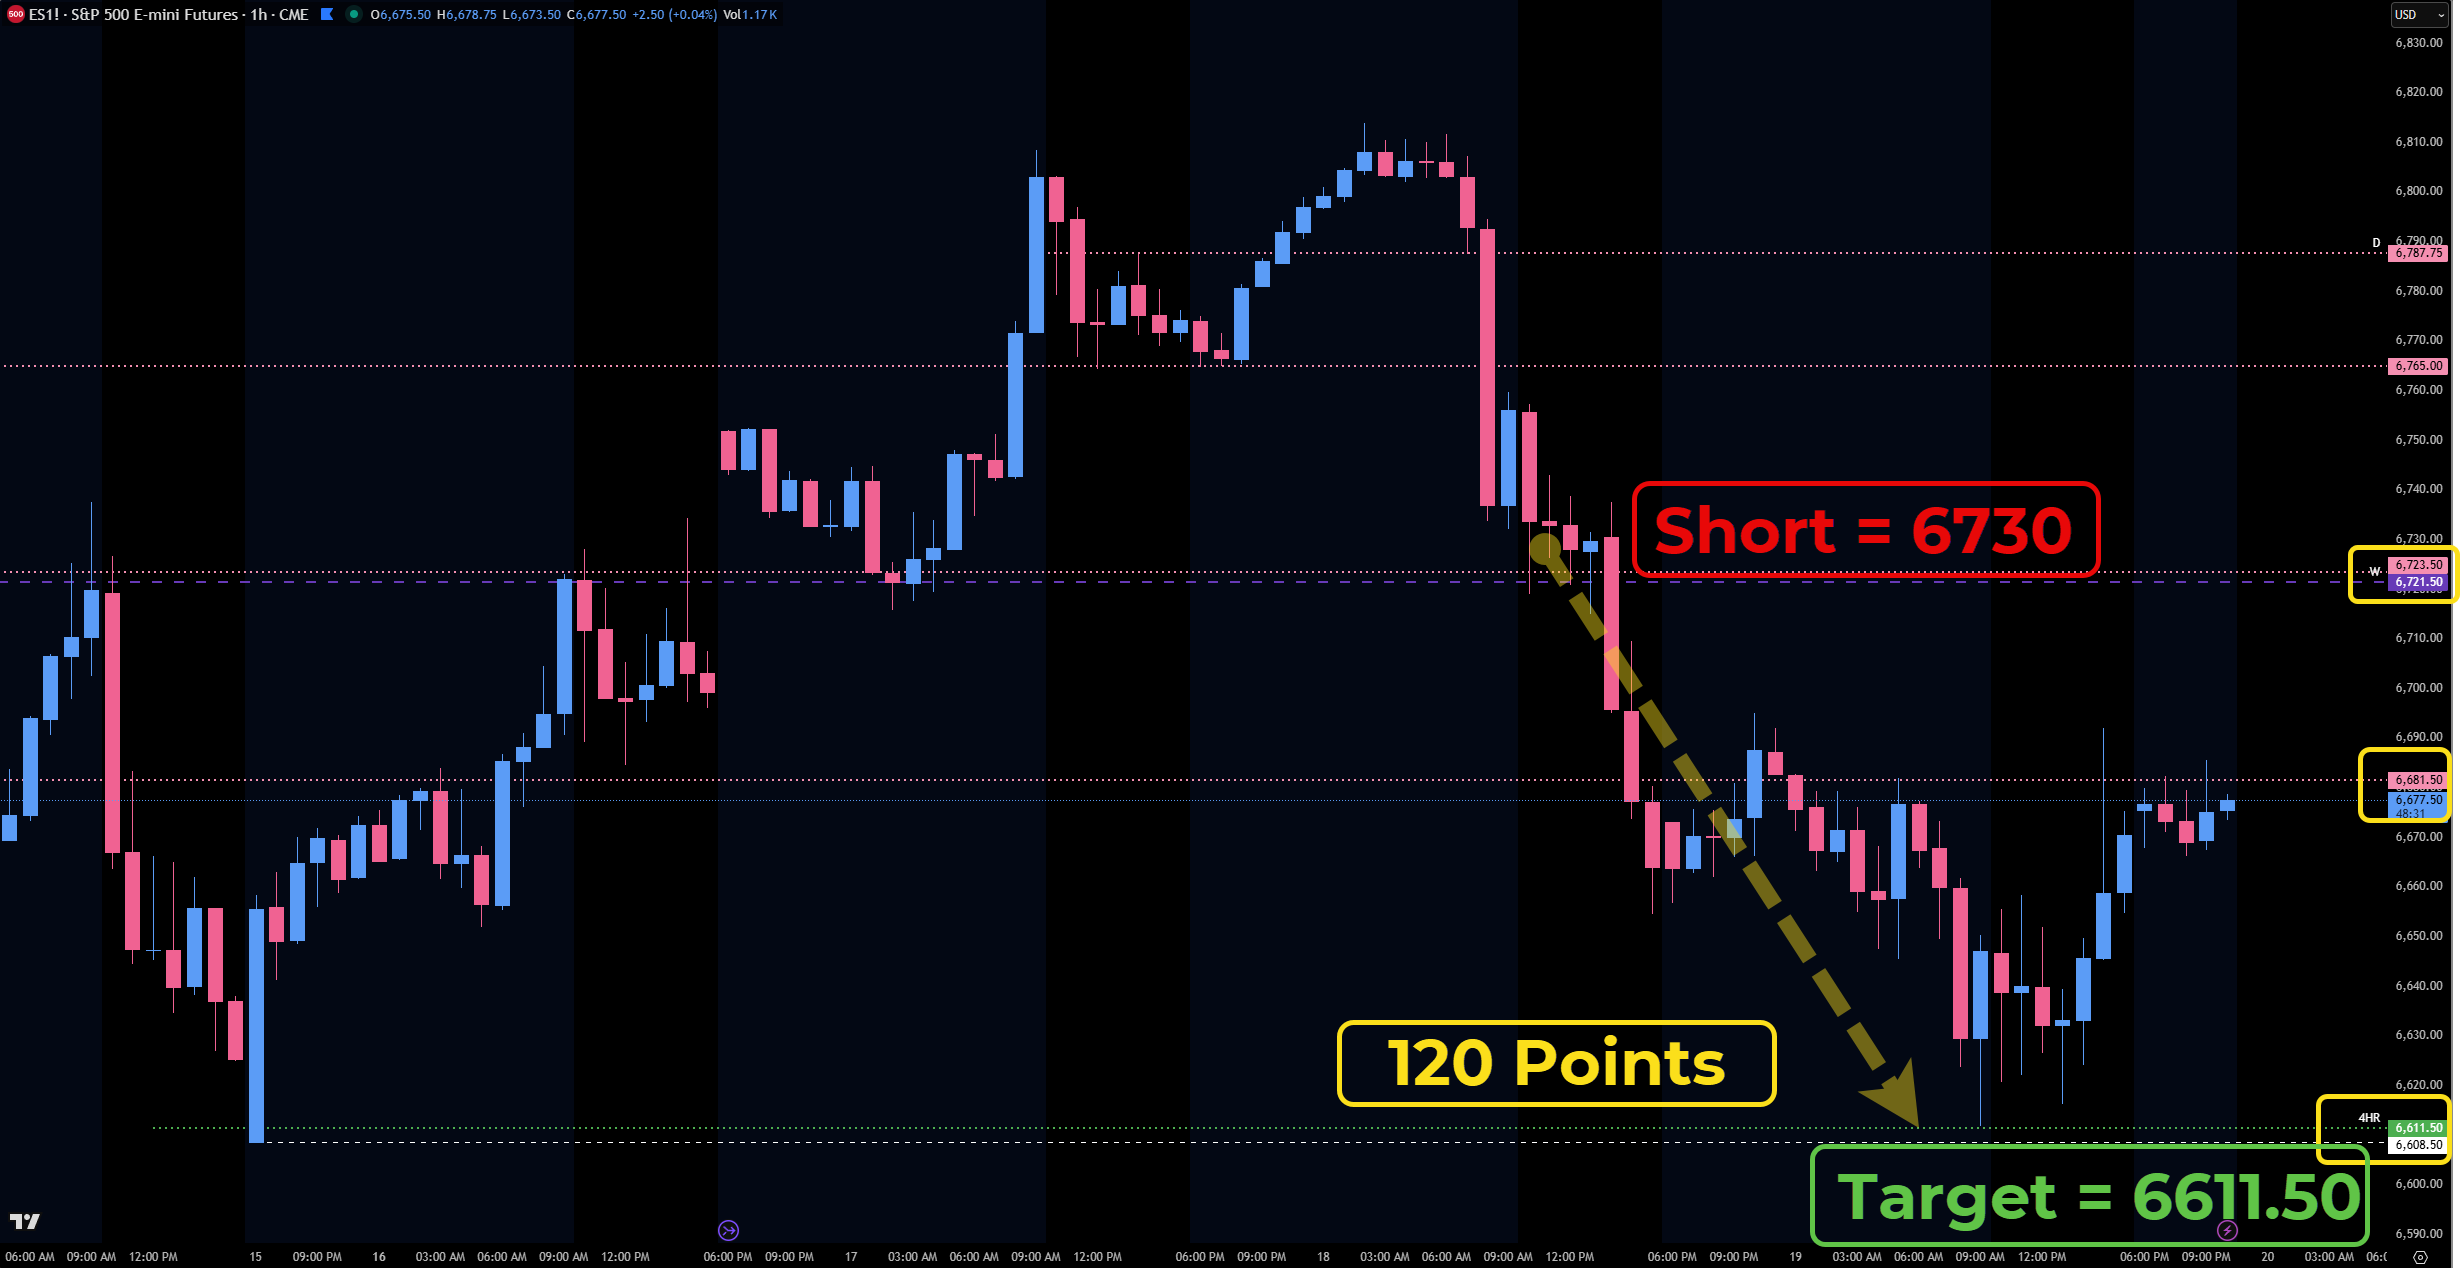
We called out the short on FOMC day for everyone in the Discord room and in the Substack — we took it from 6730 all the way down to 6611, paying 120 points very handsomely. For those of you in the Discord room and post-market breakdown subscribers, we were able to cash in over 400% on SPY options just by holding this overnight. An absolute banger of a trade. And then our ultimate high-timeframe short target — the sweep of the monthly and weekly leg low at 6525 — played to the tick. They went through this level by one or two ticks, grabbed the liquidity, and then popped up almost 65 points after hours. We called every target on the way down — 6627 first, then 6584, and ultimately 6525. Congratulations to everyone who rode this with us. Now the question becomes: what happens next?
I am still very much bearish on the ES overall. However, that does not mean we will not pop and squeeze. We have a tendency to sweep these leg lows, grab liquidity, and pop back up for hundreds of points — and that is exactly what we saw on Friday. I do believe we could have a nice squeeze ahead of us this week, and I am going to break down exactly what needs to happen for that to play out and what happens if we push lower.
A Note on This Week’s Market:
Data: 18 oversold conditions fired simultaneously on Friday — something that has only happened twice in 30 years. The data shows a high probability of a pop over the next 10 days, with the worst 10-day return in this setup being approximately 3%, which takes us right back up to the 6700 area on SPX. Additionally, 92.6% of the time in this setup, price reclaimed the monthly fair value (point of control) within 10 days — that sits at 6707 on SPX right now. High-timeframe data never overrides the process, but it is a significant tailwind to our squeeze thesis.
 Ryan Bailey ⚔️ The S&P Edge@RyanBaileyEdgeOnly TWICE in 30 years have 18 oversold conditions fired simultaneously — and today is one of them. SPX dropped 1.51% to 6,506. VIX spiked 11% to 26.78. RSI sits below 30. Price is below both the 50 AND 200-day MA, below the lower Bollinger Band, below monthly Value Area Low,
 12:04 AM · Mar 21, 2026 · 72 Views
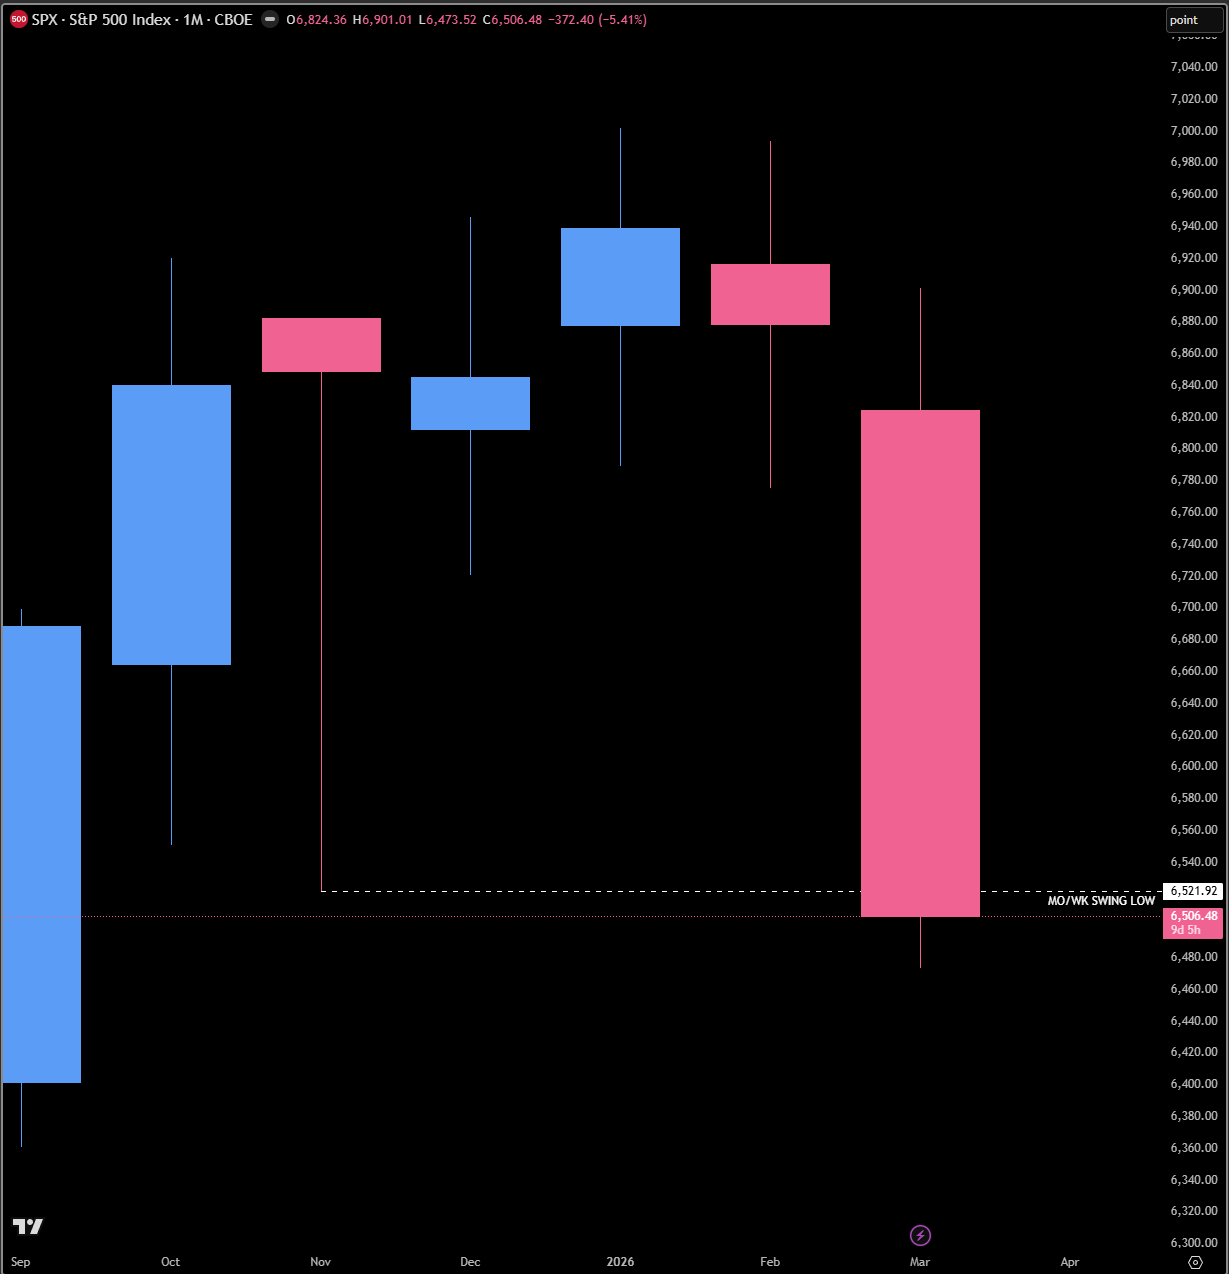
Range: We have already swept the largest swing low on the monthly and weekly timeframes for both SPX and ES. Price closed at 6575 on the cash session Friday and is currently sitting above the 6581.50 Daily on the ETH session through Globex. The range this week will depend heavily on whether we can reclaim our major weekly levels.
Gamma: We remain in a Negative Gamma environment. VIX has been unable to gain on the daily or four-hour timeframes, which is pointing toward potential weakness on VIX and potential strength on the indices. However, negative gamma means anything can happen — stay nimble.
Trend: Downside overall. We are still very much pointed to the downside structurally. However, the liquidity sweep of the leg lows is a significant event that historically leads to multi-hundred-point pops. I am watching for a squeeze this week but using our key above/below levels to confirm direction. If you cannot make a new high and cannot gain support, you have to go lower and sweep the lows to grab buyers and try again — well, they just did exactly that.

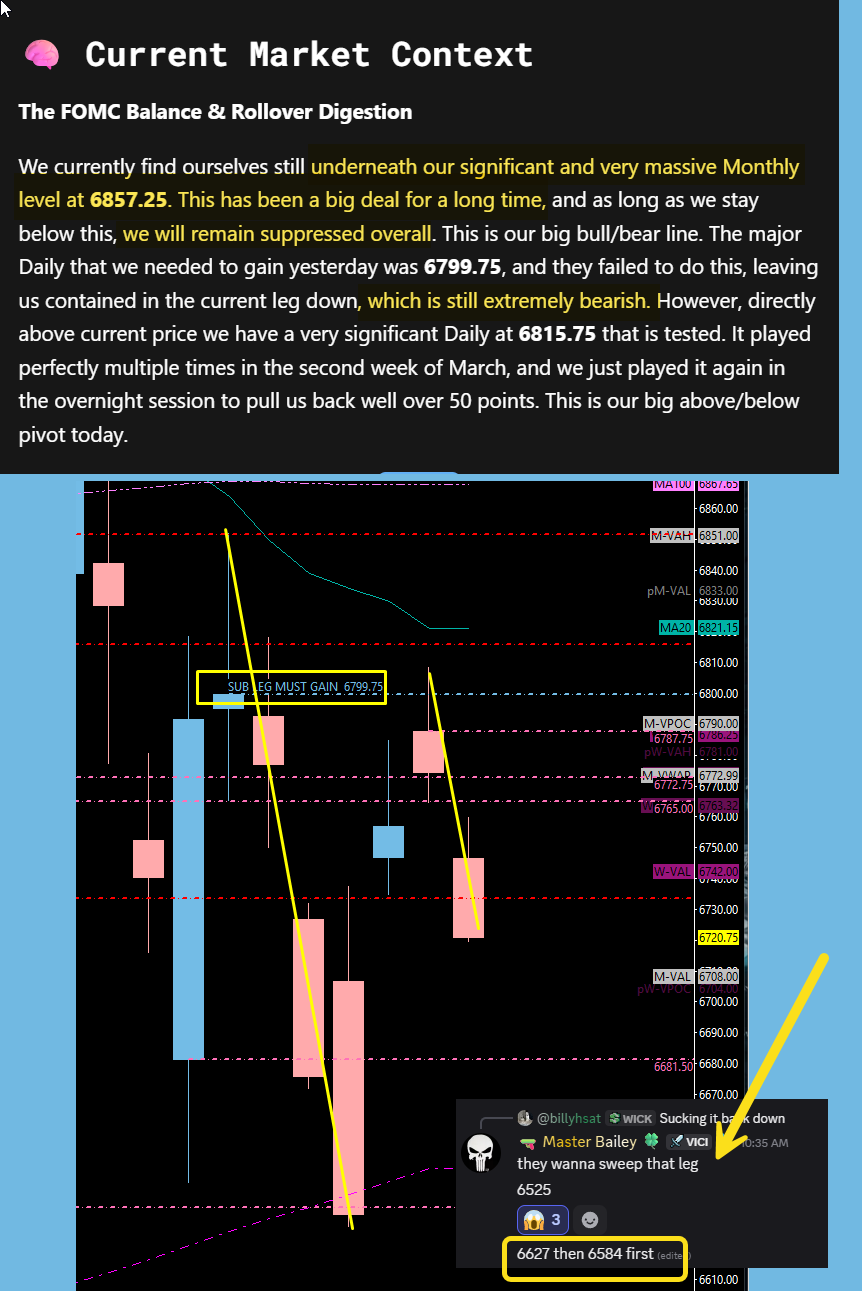
🧠 Current Market Context
The Leg Low Sweep & The Squeeze Thesis
We have now swept the very largest swing low on the monthly and weekly timeframes for both SPX and ES. This was our ultimate high-timeframe short target, and it played perfectly. The pattern we have seen throughout this entire move lower has been remarkably consistent: we make a leg down, they pop up and test the highs, push down, make a new low, pop up and test the highs again, and repeat. Why should anything be different this time? We have grabbed new liquidity at the lows, and now it is time to get a pop and go back up to test something untested — which is the highest leg area we have been discussing.
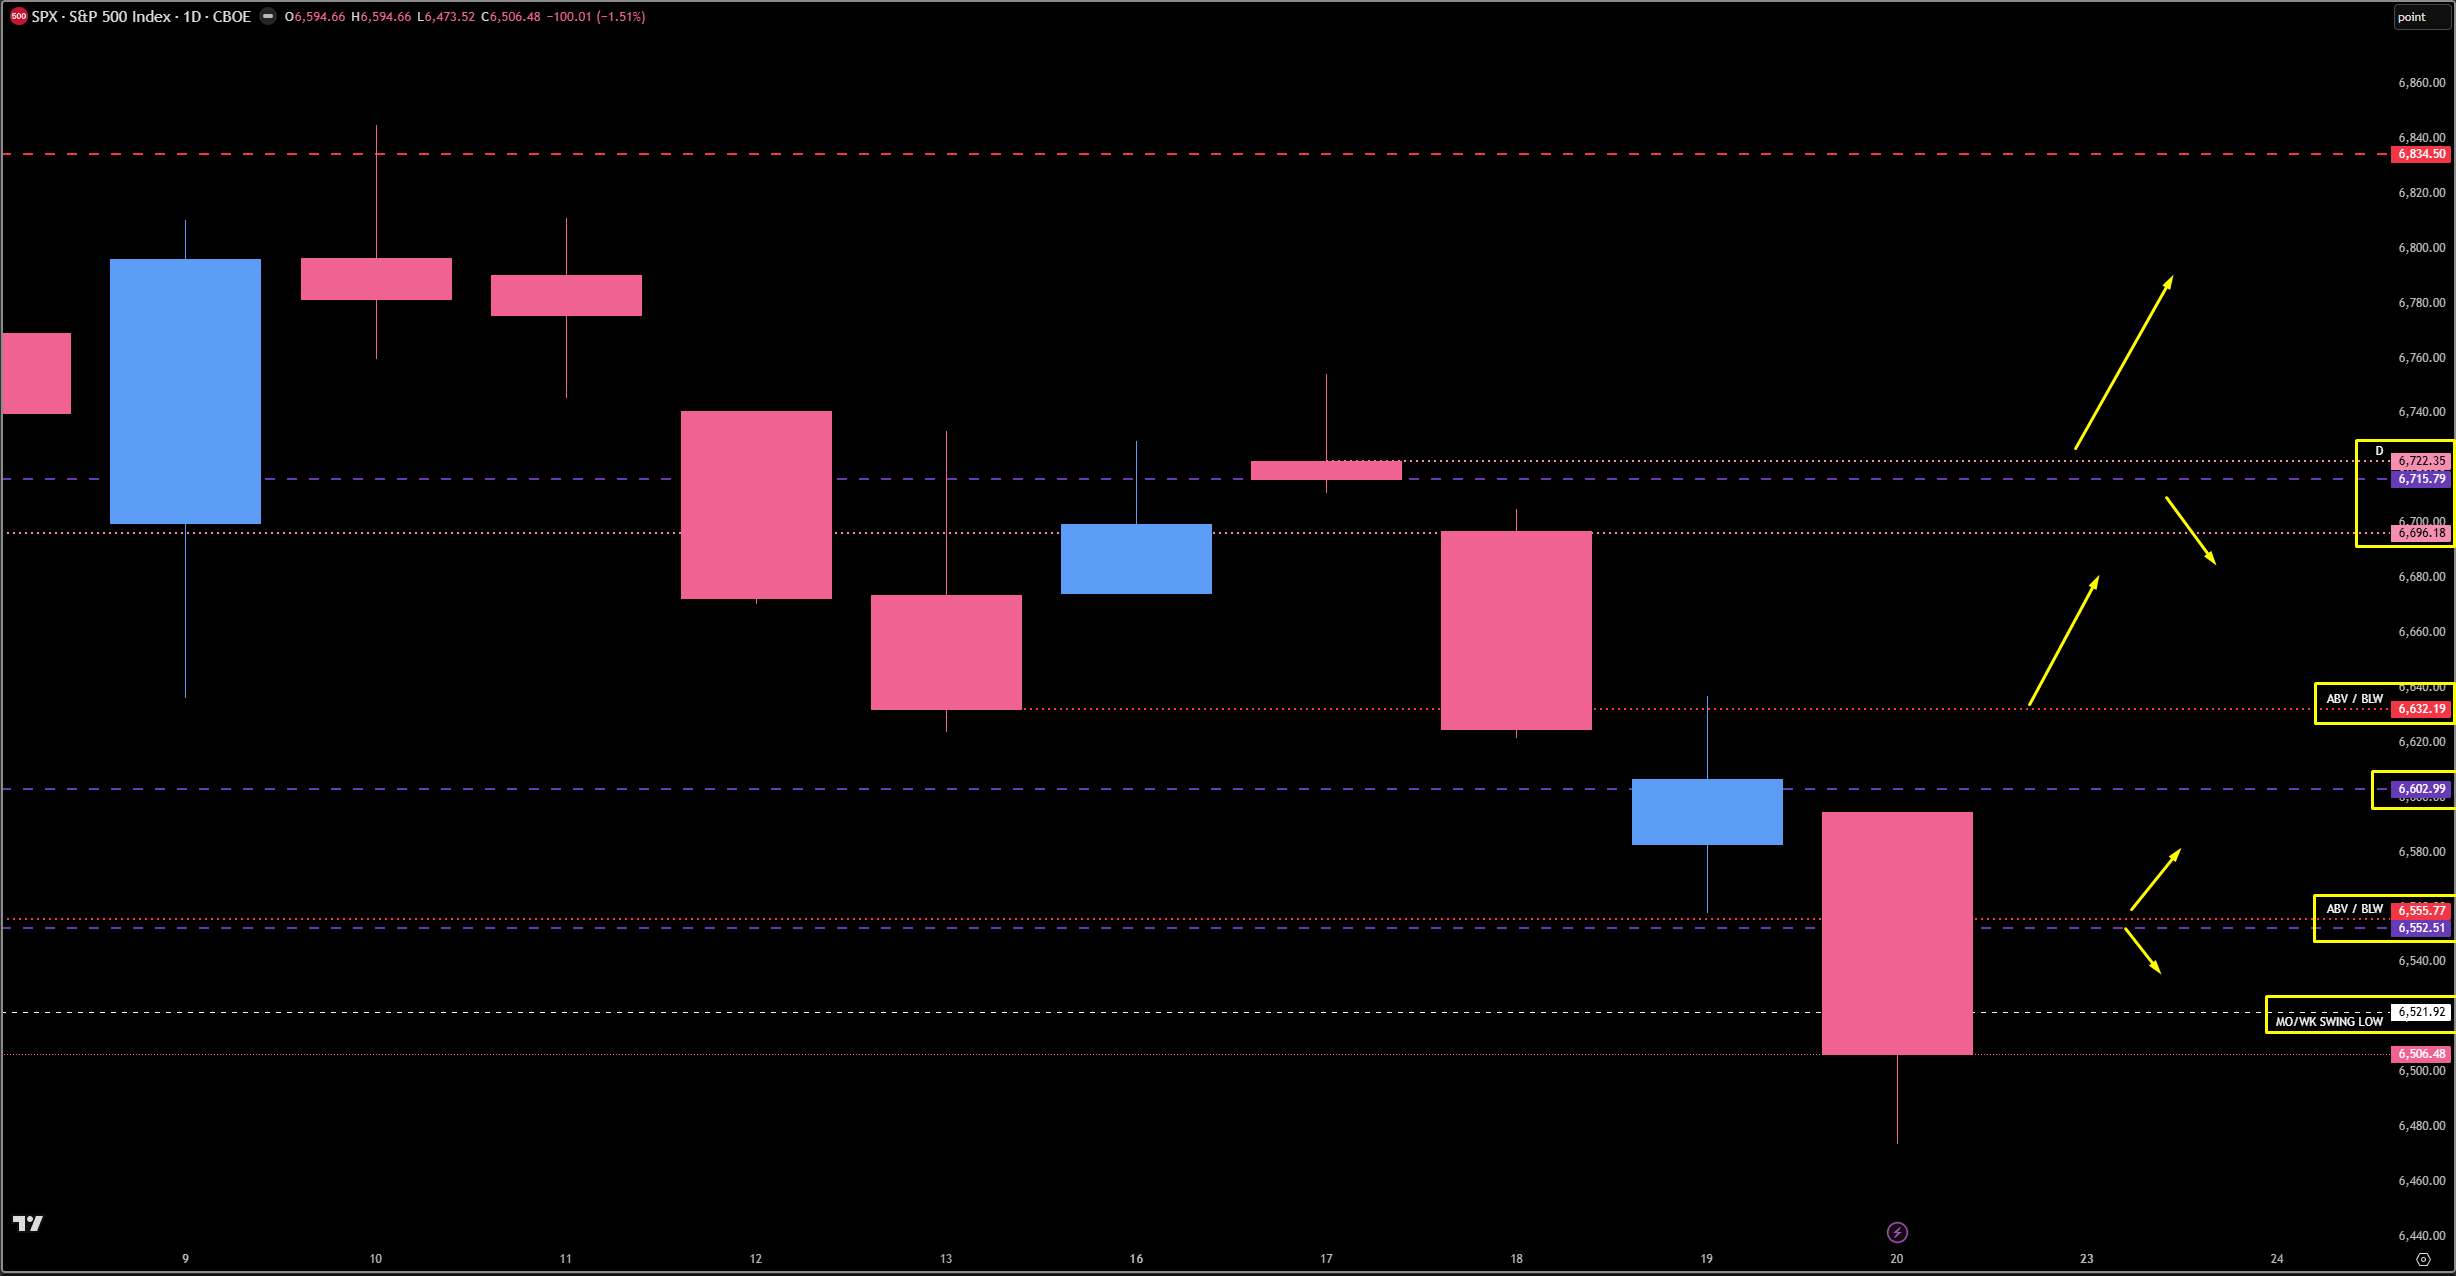
On SPX, the swing low at 6521 is our major level to maintain above. Getting back above 6552 is the first step for continuation, but the real line in the sand is the 6555 Daily/Weekly combo. Above 6555, we push directly into 6602 and 6606 on the four-hour. A break above 6632 opens the door to the main area of congestion between 6696 and 6739, with 6715 being the major spot. I do believe we could come all the way to the higher end of this leg, somewhere around 6700 on SPX, which also aligns perfectly with the oversold data we just discussed.
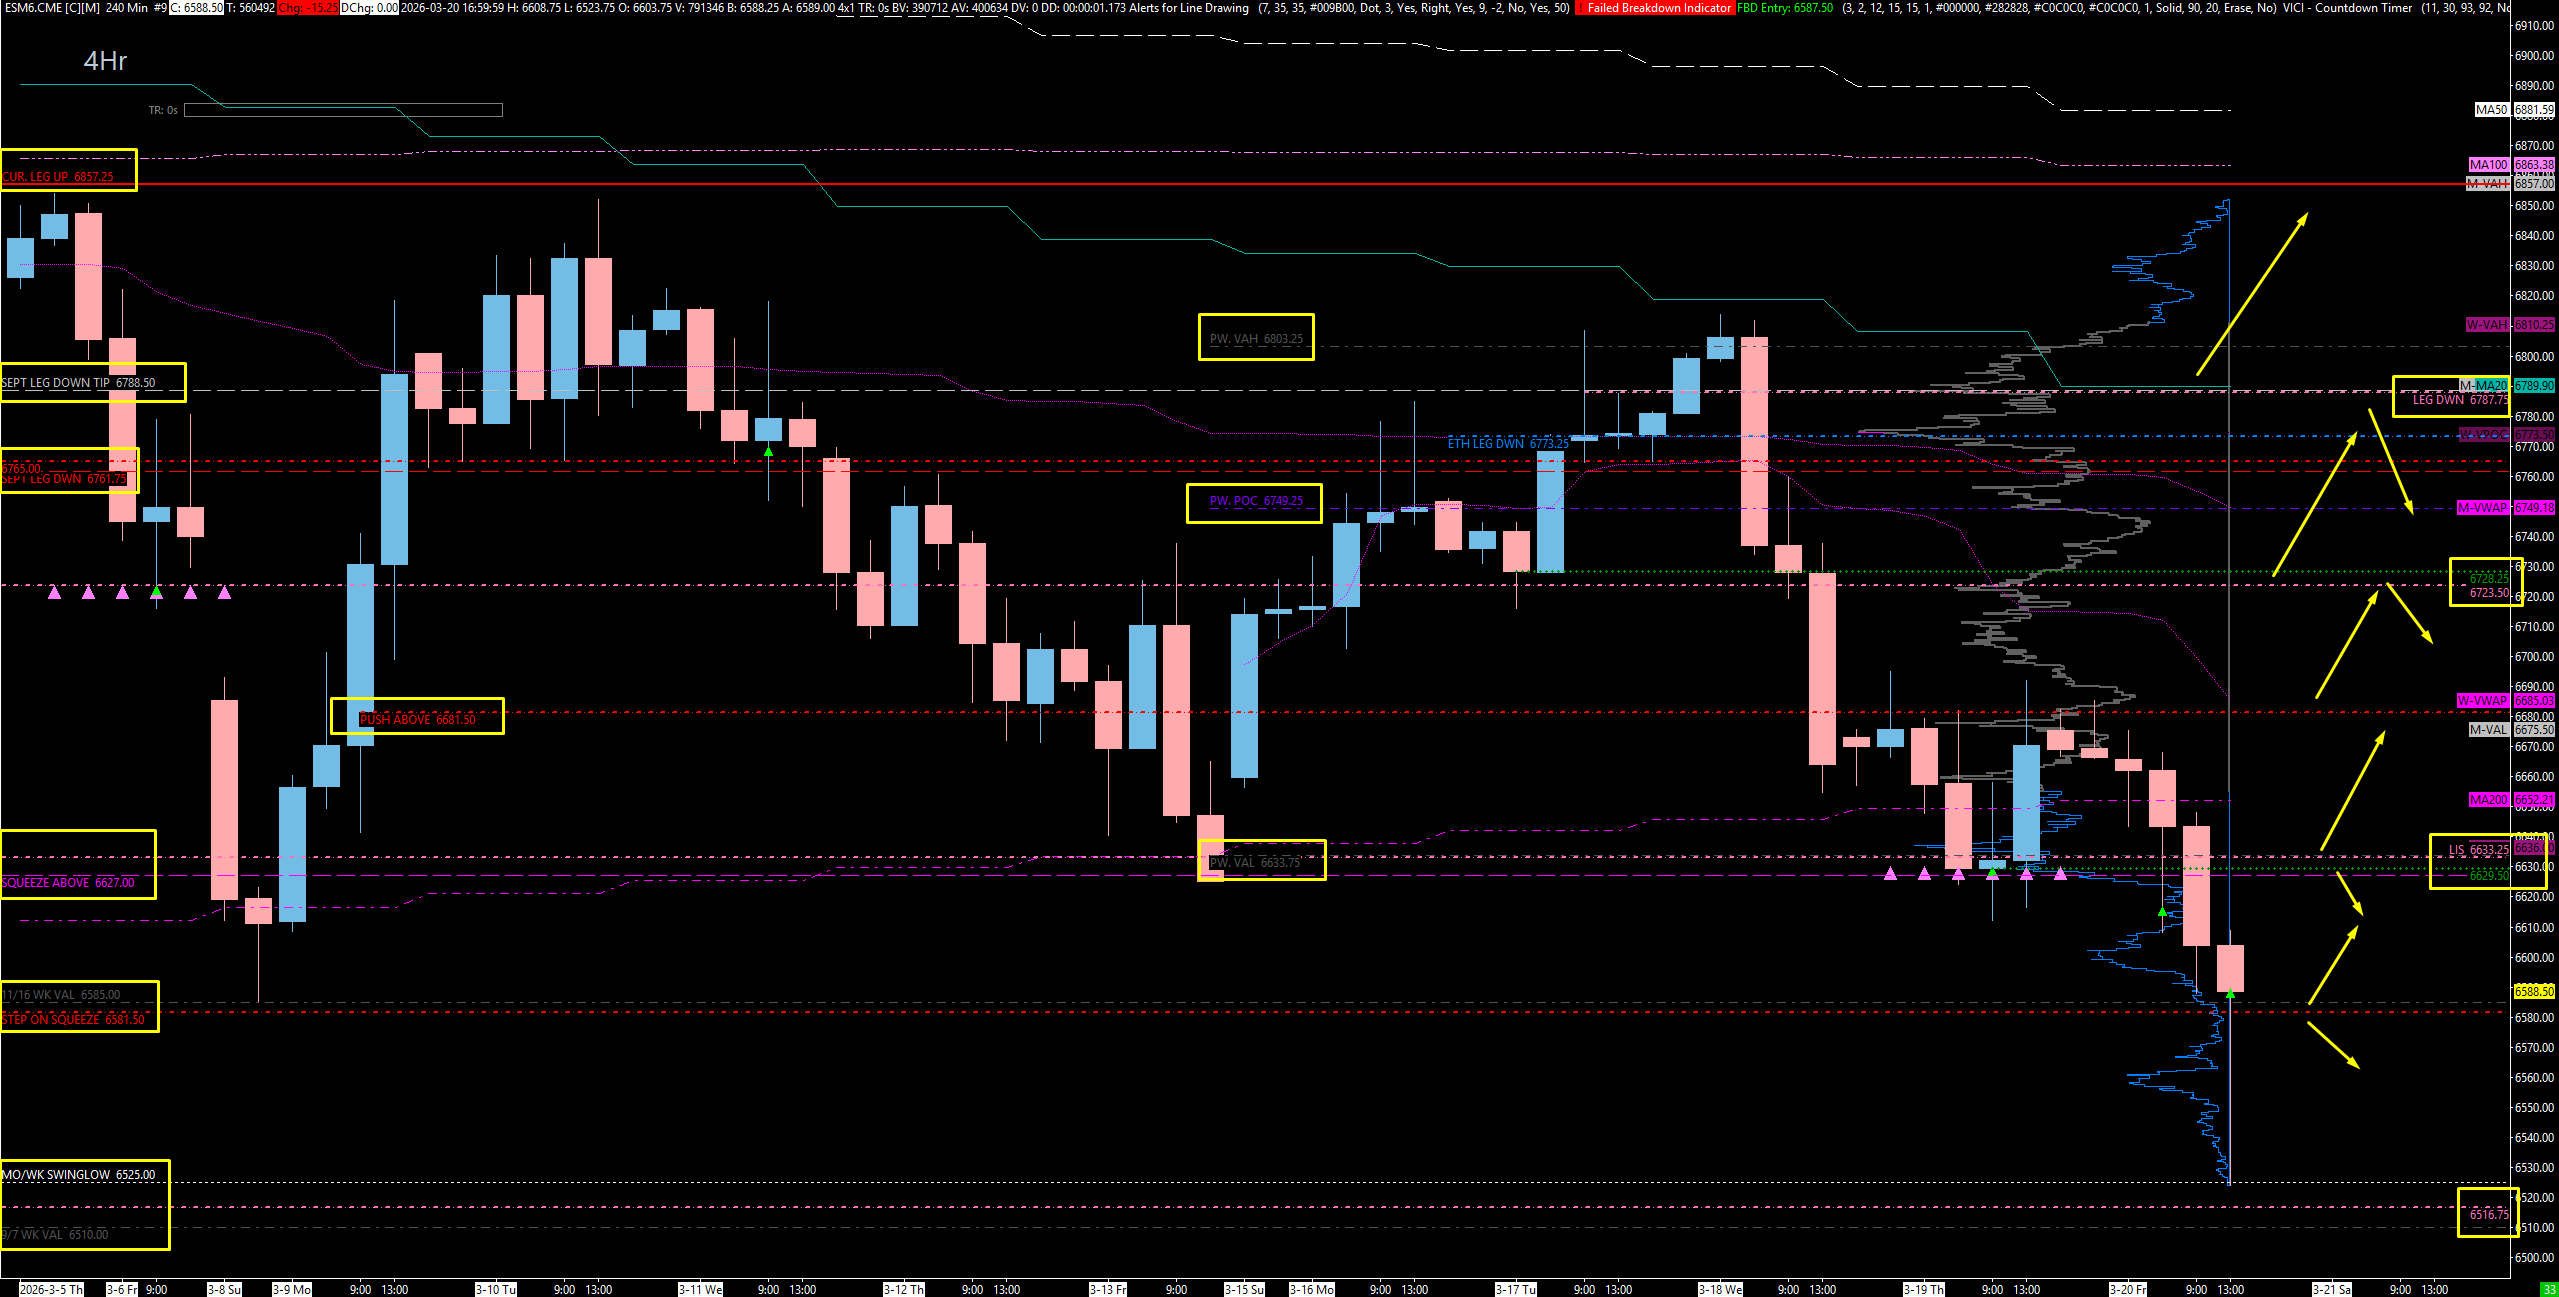
On ES, we closed at 6575 on the cash session Friday and are currently above the 6581.50 Daily on the ETH session through Globex. Our first big target is to get above 6581.50 and the 6585 Previous Weekly Value Area Low, which played as support last week and popped us up a couple hundred points. From there, the big kicker is getting back above 6627 — if they are able to reclaim this Weekly level, we will push much higher into the upper side of this leg.
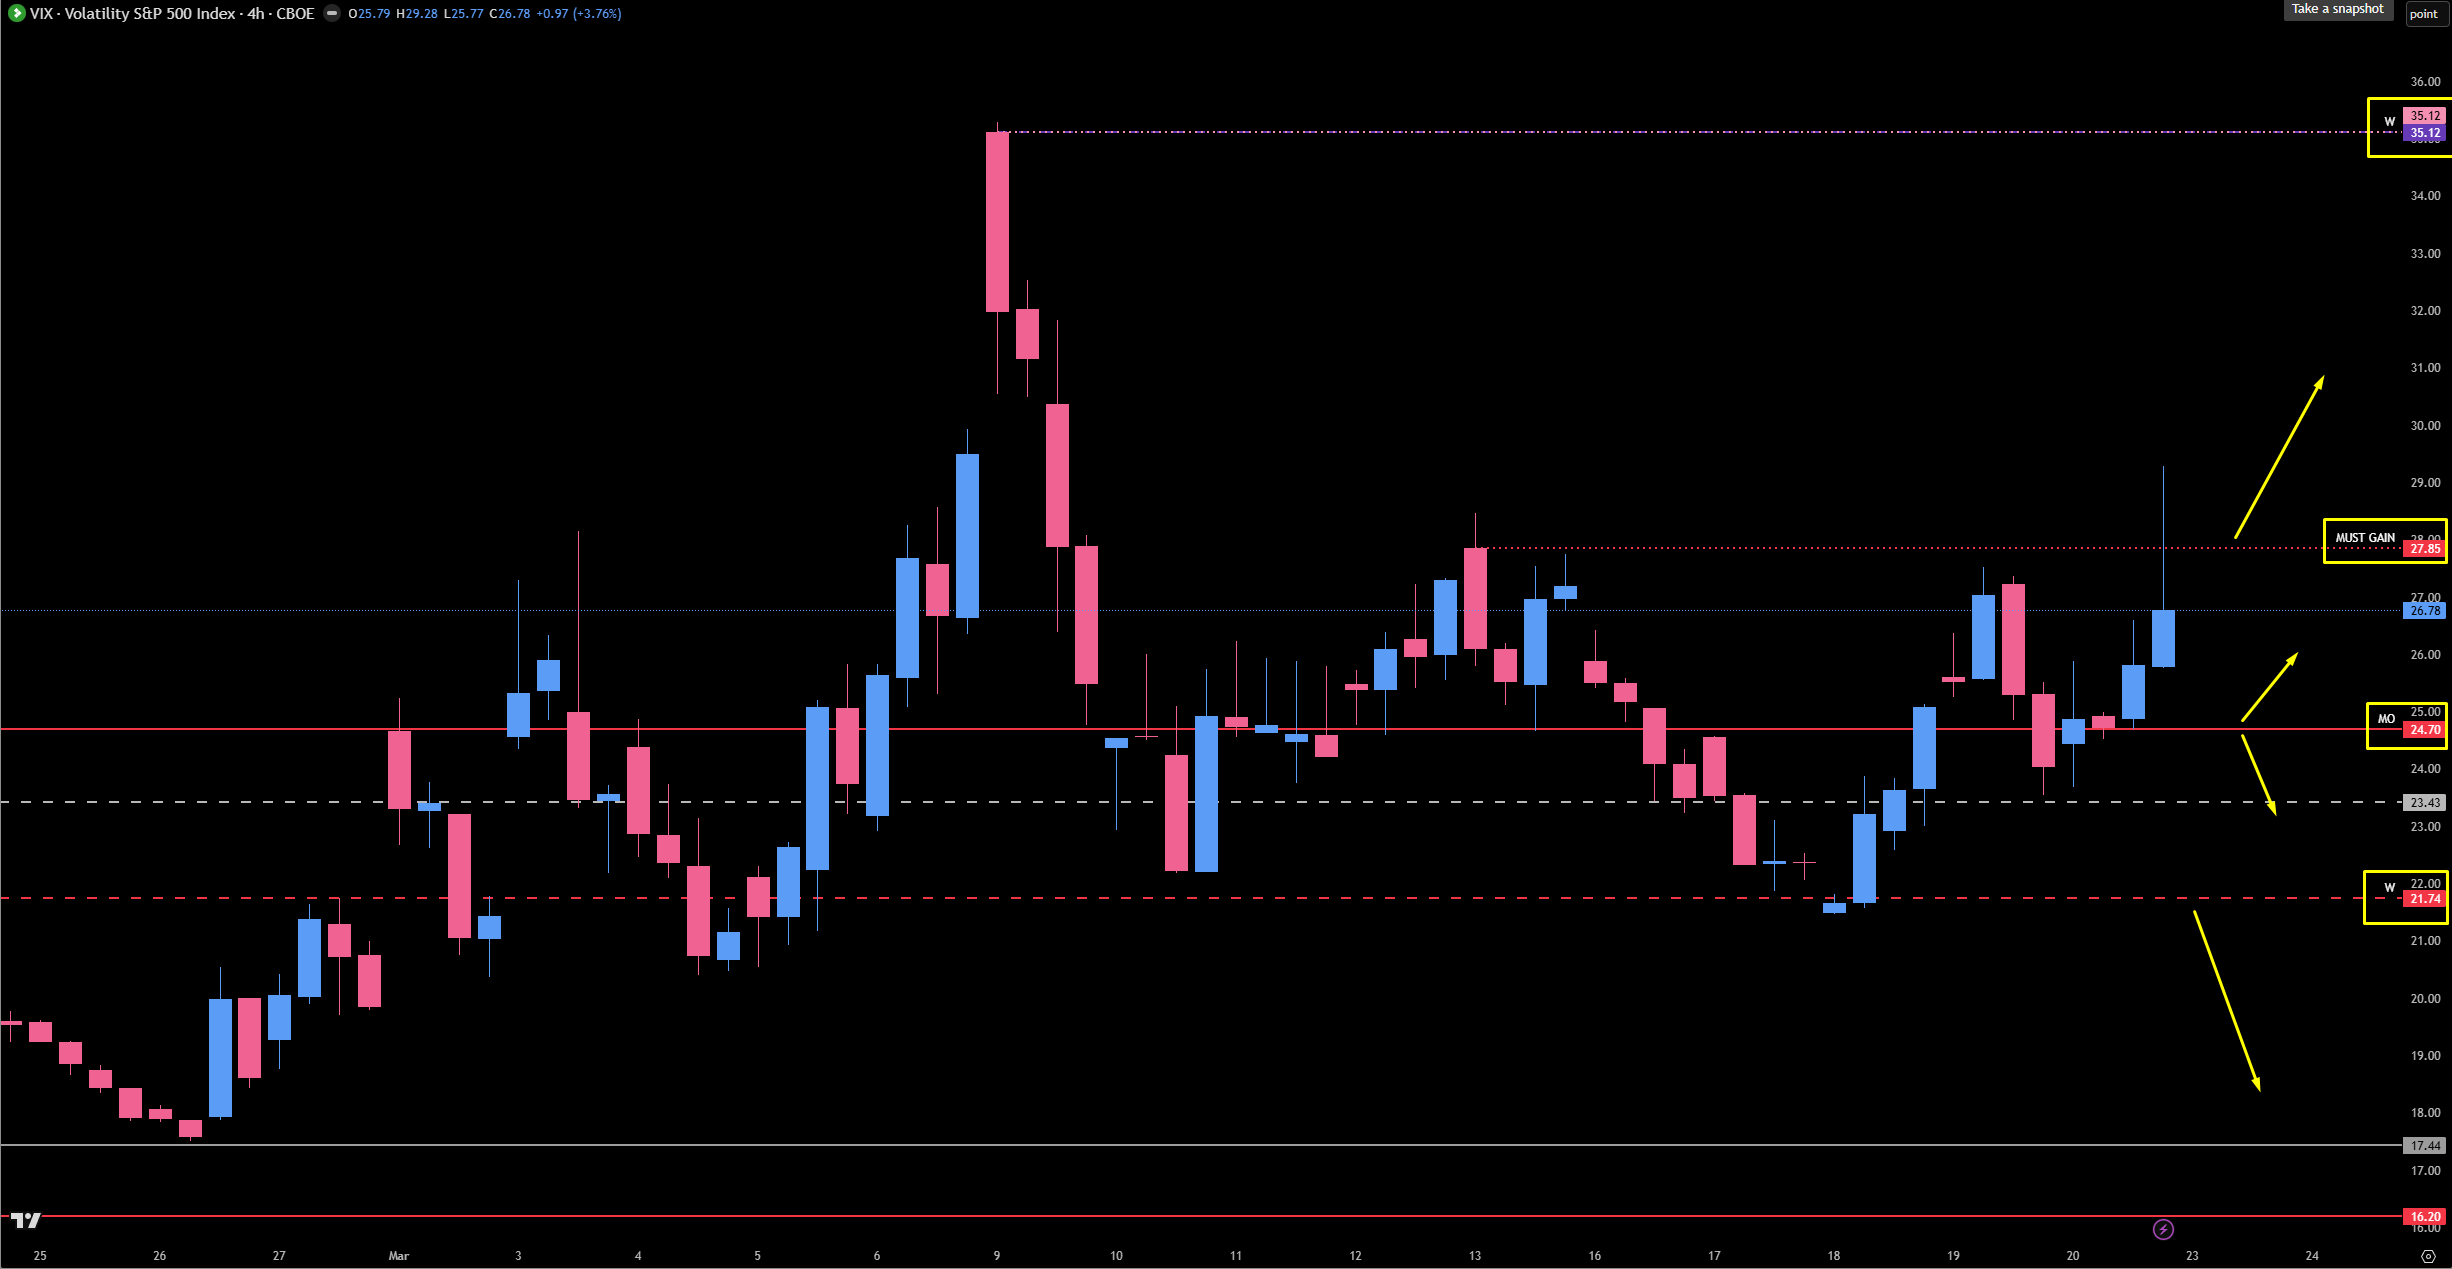
🚨 VIX Analysis: The 24.70 Monthly Floor
VIX continues to be our key barometer for index momentum, and right now it is pointing toward potential relief. The 21.74 Weekly has been our big above/below pivot and has held as a floor for weeks now, keeping us in the $20 handle. But the real story is the 24.70 Monthly level that I have talked about until we are blue in the face — being above this has created a massive headwind for the indices and a significant downward push.
The Floor: 24.70 (Monthly). This remains our big above/below trigger. As long as VIX stays above 24.70, there is a headwind for the indices. However, if VIX pushes below 24.70, the indices are going to get a significant tailwind and push much higher. There is nothing untested below 24.70 on VIX right now, which means if we do squeeze, VIX could come down quite significantly.
The Upside Ceiling: 27.85 (Daily/4-Hour Resistance). VIX has been unable to close above this level on the daily or four-hour timeframe — and that is an extremely bearish ordeal for VIX (bullish for indices). We need a four-hour or daily close above 27.85 for VIX to continue higher. If that happens, we could push all the way up to 35.12, but that remains to be seen. The inability to gain here is one of the key reasons I believe we could see a squeeze this week.
The Current Setup: VIX is pulling back as of the Friday close. No gain on the weekly or daily timeframes. This is a significant tell — the inability to gain on the higher timeframes while the indices have just swept the leg lows is exactly the kind of divergence that leads to powerful squeezes. Watch 24.70 for the break below that would confirm index strength.
🎯 Detailed Actionable Trade Plan (ES Futures)
We are using our significant above/below levels to gauge momentum heading into the week. The massive above/below pivot is the Weekly at 6627 — above this we squeeze significantly higher, below this we remain in the lower end of the range. Our first stepping stone is the Daily at 6581.50 and the Previous Weekly VAL at 6585 for gauging whether the bounce has legs. On the downside, a break below 6525 takes us immediately into 6474 with not much support in between.
🔴 Key Resistance Zones & Setups
The First Hurdle — Daily & Weekly VAL: 6581.50 - 6585.00
6585.00 (Previous Weekly Value Area Low), 6581.50 (Daily).
Context: This is our first area to get above and maintain. The 6585 Previous Weekly VAL played as support last week and popped us up a couple hundred points — now it becomes our first hurdle as we try to build from Friday’s bounce. We are currently sitting right around this area on the ETH session through Globex.
Actionable Setup: As long as price maintains above 6581.50, we maintain our current upside progression toward the weekly resistance zone above. A failure to hold this area opens the door back to the leg low.
The Squeeze Trigger — Weekly/Daily Confluence: 6627.00 - 6633.75
6633.75 (Previous Weekly Value Area Low / Double VAL), 6633.25 (Daily / Line in the Sand), 6629.50 (4-Hour), 6627.00 (Weekly / Squeeze Above Trigger).
Context: This is the big one. This zone is loaded with confluence — the Weekly at 6627, the four-hour at 6629.50, the Daily at 6633.25, and the Previous Weekly Value Area Low at 6633.75 creating a double VAL situation. There is a massive volume node here that makes it very clear we have a significant shelf to get over. However, once they get over it, just like the weekly TPO shows, we should continue to traverse all the way up. Getting above 6633.75 will fill in the inefficiency in the weekly profile targeting the Weekly POC at 6749.25.
Actionable Setup: A push above 6627 is our Squeeze Trigger. If price accepts above this zone and clears 6633.75, we will push directly into the tested Daily at 6681.50. This is our line in the sand — above this zone we are squeezing, below it we remain range-bound.
The Tested Daily Reaction: 6681.50
6681.50 (Tested Daily).
Context: This Daily level is very much tested and kept us suppressed last week. I do not expect this to be a major problem — it will more than likely get a reaction due to its significance, but I would not expect it to hold.
Actionable Setup: Watch for a reaction here on the first touch. A push above 6681.50 will easily send us up into the Daily at 6723.50.
The Daily/4-Hour Confluence: 6723.50 - 6728.25
6728.25 (4-Hour), 6723.50 (Daily).
Context: This is a significant area with a four-hour leg high right here and a lot of confluence. I would be watching this area very heavily for a reaction. This is the spot where the market will tell us if the squeeze has real legs or if it is time to smack back down.
Actionable Setup: I do anticipate a reaction here. If price fails at this zone, watch for a move back below 6681.50 for continuation lower. However, if they move above 6728.25, we get into the Weekly POC at 6749.25, which would ultimately be our target.
Warning: This is a high-probability reaction zone. Do not chase longs into this area — let it prove itself first.
The Weekly POC & Upper Leg Target: 6749.25 - 6787.75
6787.75 (Leg High / Major Reaction Area), 6761.00 (Upper Leg Target), 6749.25 (Weekly POC).
Context: This is our ultimate bullish target area for the squeeze. The Weekly POC at 6749.25 is the inevitable target if they get above the 6633 zone — 92.6% of the time in the current oversold setup, price reclaims the monthly fair value within 10 days. The 6787.75 area represents the leg high and our prime short location if we reach it.
Actionable Setup: Short Setup: If price reaches the 6787 area, this is the prime location for a reaction. I would look for price to get back below 6761 for a push lower, and then a push below 6723 would be our confirmation for riding it back down through 6681 and lower. This is our major smack spot.
Warning: If price pushes above 6787.75 and continues higher, the squeeze is far more powerful than anticipated and we need to reassess.
🔵 Key Support Zones & Setups
The Leg Low Pivot: 6525.00
6525.00 (Monthly/Weekly Leg Low / Swept).
Context: This is the monthly and weekly leg low that we targeted for weeks and swept perfectly on Friday. This level has now been swept and should serve as our major above/below pivot on the downside. As long as we maintain above 6525, the squeeze thesis remains alive.
Actionable Setup: If price pulls back to 6525, watch for a Failed Breakdown setup — a sweep below and reclaim could provide a powerful long entry. However, a sustained break below 6525 changes the narrative entirely.
The Untested Daily: 6516.75
6516.75 (Untested Daily).
Context: This was our Daily target that the market missed by about nine points on the sweep. It is technically still untested and sits just below the leg low. If we come back to this area, it could provide meaningful support.
Actionable Setup: Conditional Long: If price sweeps below 6525 into the 6516.75 Daily, watch for a reclaim back above 6525 for a potential squeeze setup. Getting back above 6525 with confidence after touching this Daily could make for a powerful long.
The Downside Danger Zone: 6474.00
6474.00 (Major Support).
Context: If price pushes below 6525, we come to 6474 directly. There is not much support below the leg low, and this area of congestion has a lot of strength but would require us to dig in to find something untested.
Actionable Setup: A break below 6525 takes us immediately to 6474. This is the danger zone — if we are heading here, the squeeze thesis is dead and we are in a much larger downside continuation.
Warning: Below 6525 there is very little support. Be very careful on the downside if we lose the leg low. This is not the area to be a hero trying to catch longs.
📌 Cheat Sheet – Key Levels Recap
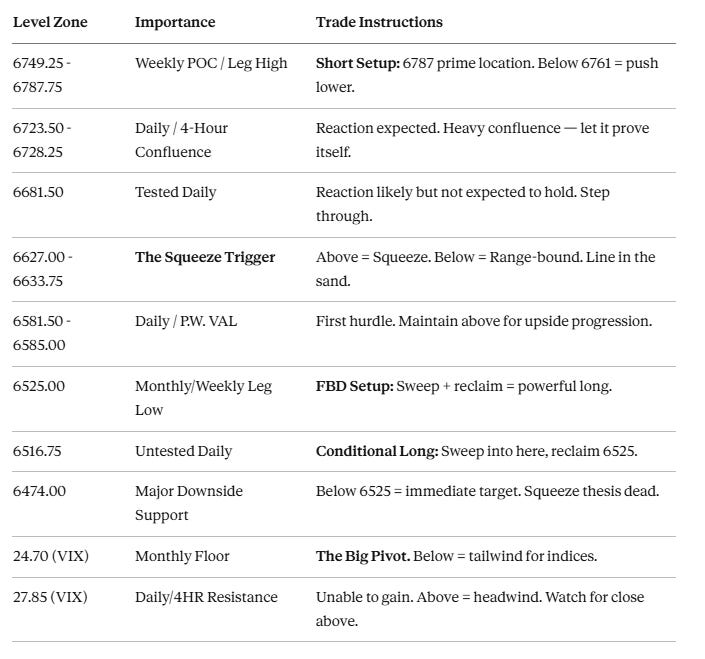
🧠 Final Thoughts
We have now completed the sweep of the largest swing low on the monthly and weekly timeframes for both SPX and ES — this was the ultimate high-timeframe short target I have been discussing for weeks, and it played to perfection. The pattern is clear: sweep the lows, grab liquidity, pop back up, and test the highs. Now that the sweep is complete, I do believe we could see a nice squeeze this week, potentially targeting the upper end of this leg in the 6749 to 6787 area on ES and the 6700 area on SPX.
The data backs this up — 18 oversold conditions fired simultaneously on Friday, something that has only happened twice in 30 years, and the historical tendency strongly favors upside over the next 10 days. But remember, data never overrides the process. Use the 6627 Weekly on ES as your squeeze trigger — above this and we are running. Use the 6525 leg low as your downside line in the sand — below this and we are in trouble. And keep an eye on VIX at 24.70 — a push below this gives the indices a significant tailwind. One step at a time, use these levels for above/below, and let the setups come to you.
Also, a heads up — I just dropped a new indicator on TradingView called the TWAP Edge. This is essentially VWAP for SPX, using time-weighted average price since SPX has no real volume. It is a multi-timeframe tool covering daily, weekly, and monthly TWAPs with deviation bands. If you are following SPX with us, this is a must-have. It is free — check the link in this post, the Discord room, Twitter, or Substack Notes to grab it.
Until next time—trade smart, stay prepared, and together we will conquer these markets!
Ryan Bailey, VICI Trading Solutions.
📊 TradingView Indicator String
Copy and paste the levels below into your S&P Edge Levels indicator to automatically plot today’s key levels on your chart:
6728.25|4HR|4H
6723.50|D|D
6681.50|Tested D|TD
6633.75|P.W. VAL|GD
6633.25|D|D
6629.50|4HR|4H
6627.00|WK|W
6585.00|P.W. VAL|GD
6581.50|D|D
6516.75|D|D