

Hello everybody, and welcome back.
It is Sunday, which means it is time for the Weekend Review, and last week was one of those weeks where the trade plans paid for themselves many times over. If you were following along, we caught some incredible moves. If you were in the Discord room, it was even better. We absolutely crushed it, and now the job is simple: reset, prepare, and get ready to do it again.
Coming into this week, the market is still structurally bullish across the higher time frames. We have not lost support on any meaningful time frame yet. However, we are stretched, we are overextended, and we have several pieces of evidence suggesting that a healthy pullback could be close. That does not mean I am bearish. I want to be very clear on that. I am still extremely bullish overall, but I do think some rotation would be healthy, and if we get it, I want to be prepared to buy the right support instead of chasing all time highs.
🧠 Current Market Context
Overextended, But Still Bullish
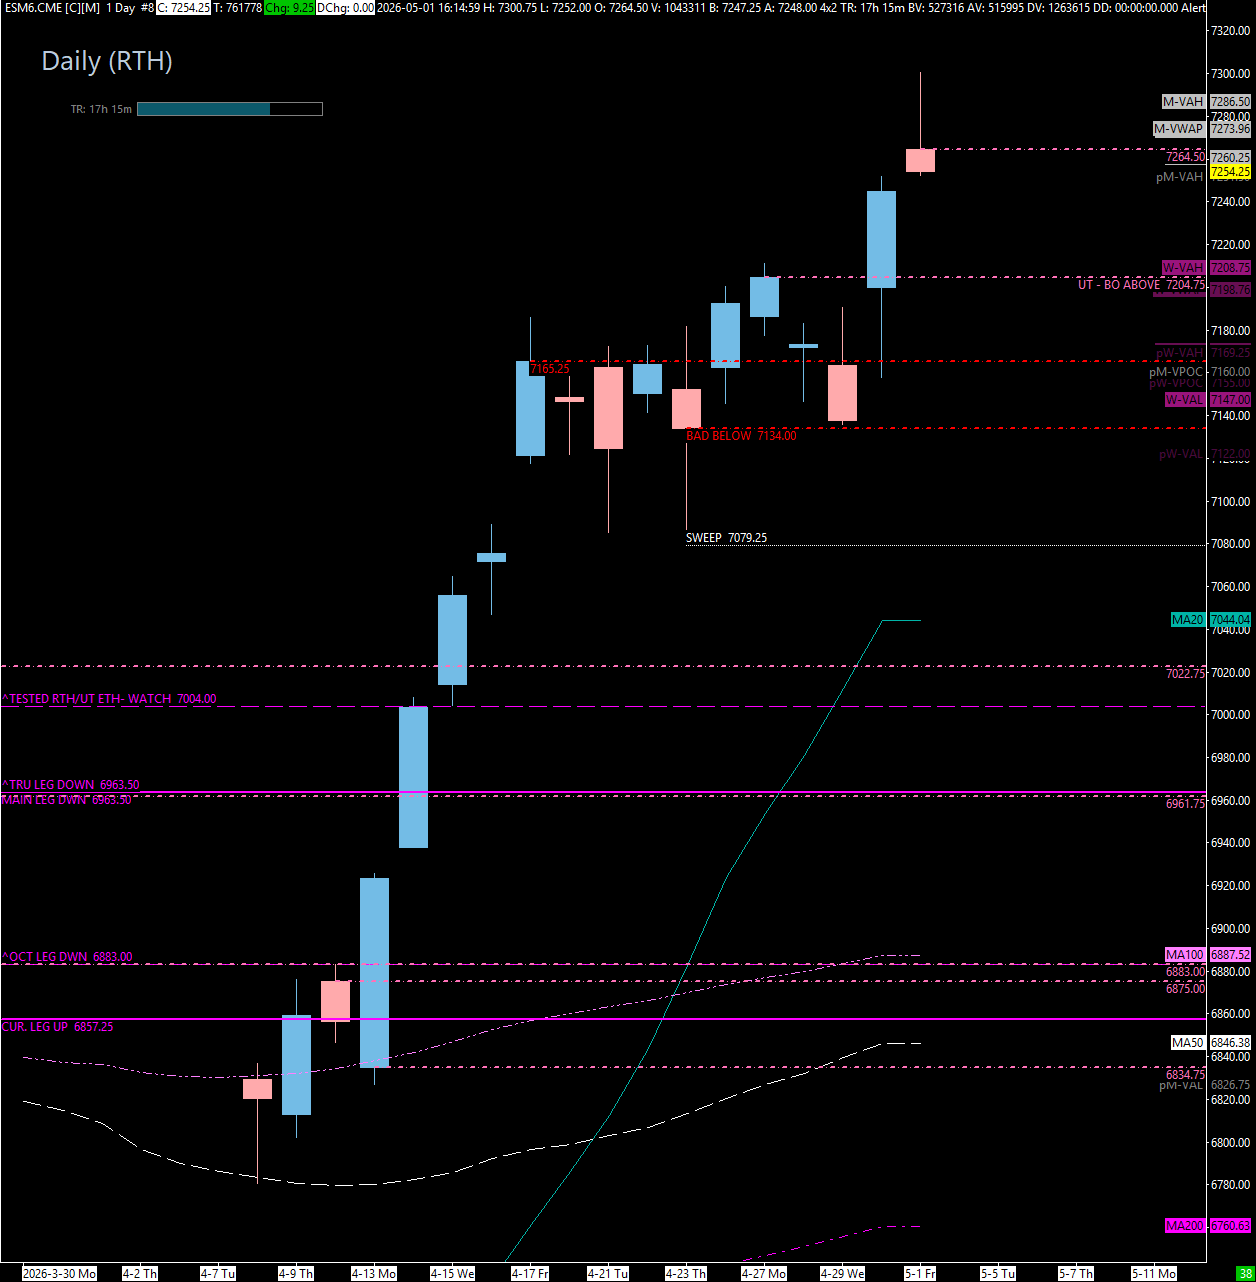
The bigger picture is straightforward. We are still in an uptrend. Monthly, weekly, daily, and 4 hour structure are still pointing higher. By all rights, we are still pointed up. But from a value perspective, we are getting expensive. ES is pushing well above the yearly VWAP structure, riding above the one and a half standard deviation and pressing through the two standard deviation area. When markets push too far outside value, they often need to get sucked back in and create some type of mean reversion move.
That is the key for this week. I am not looking at this market saying, “let’s get short and stay short.” I am looking at this market saying, “if they finally rotate, where is the next professional buy?” The data we discussed previously suggested a potential pullback window anywhere from 8 to 40 days out, with the prime window around 3 to 8 trading days. This coming week brings us into that prime window, so the timing lines up with what the chart is already telling us.
The weekly TPO also supports the same idea. We have a very inefficient structure up here. We have a value area high, but no real value area low. We have a lowercase b shaped profile, low time and volume spent near the highs, and a massive imbalance underneath. That does not guarantee downside immediately, but it tells me this market has unfinished business below if support starts to break.


🚨 VIX Analysis: The 17.44 Above Below Pivot
VIX is sitting down in the 16.50 to 17.00 handle, and every time we get into this area, we tend to see a pop. That pop in VIX usually creates at least some pressure on ES and SPX. The last and final untested support area at 16.34 played and held, so now the entire VIX map comes down to whether it can reclaim and hold above 17.44 to 17.48.
The Main Pivot: 17.44 to 17.48
If VIX pushes above 17.44 to 17.48, that becomes a headwind for the indices. That is where I would expect ES and SPX to start feeling pressure, and that could be the trigger that finally gives us the pullback we have been preparing for.
The First Resistance Path: 20.33 into 20.78 to 21.49
If VIX pushes through 20.33, the next major area is 20.78 to 21.49. This zone has been well tested time and time again, but it is still important. If VIX gets into this area while ES or SPX is sitting at quality support, that could create a fantastic counter trade opportunity. In other words, VIX up, indices down, and then we look for VIX resistance to create the equity reversal.
The Bigger VIX Ceiling: 23.43 into 24.70
If VIX pushes above 21.49, we can traverse much higher into 23.43 and then the big monthly resistance at 24.70. If VIX gets into 23.43 or 24.70 while ES is trading into one of our major support zones, that is where I would be looking very closely for the reversal setup in ES.
The Downside VIX Path: Below 16.34
If VIX breaks below 16.34, we can continue to suppress volatility. That would be a tailwind for ES and could help push price back toward all time highs. There is a bigger monthly level below, and even though it is tested, I would still expect a reaction based on how significant that location is.
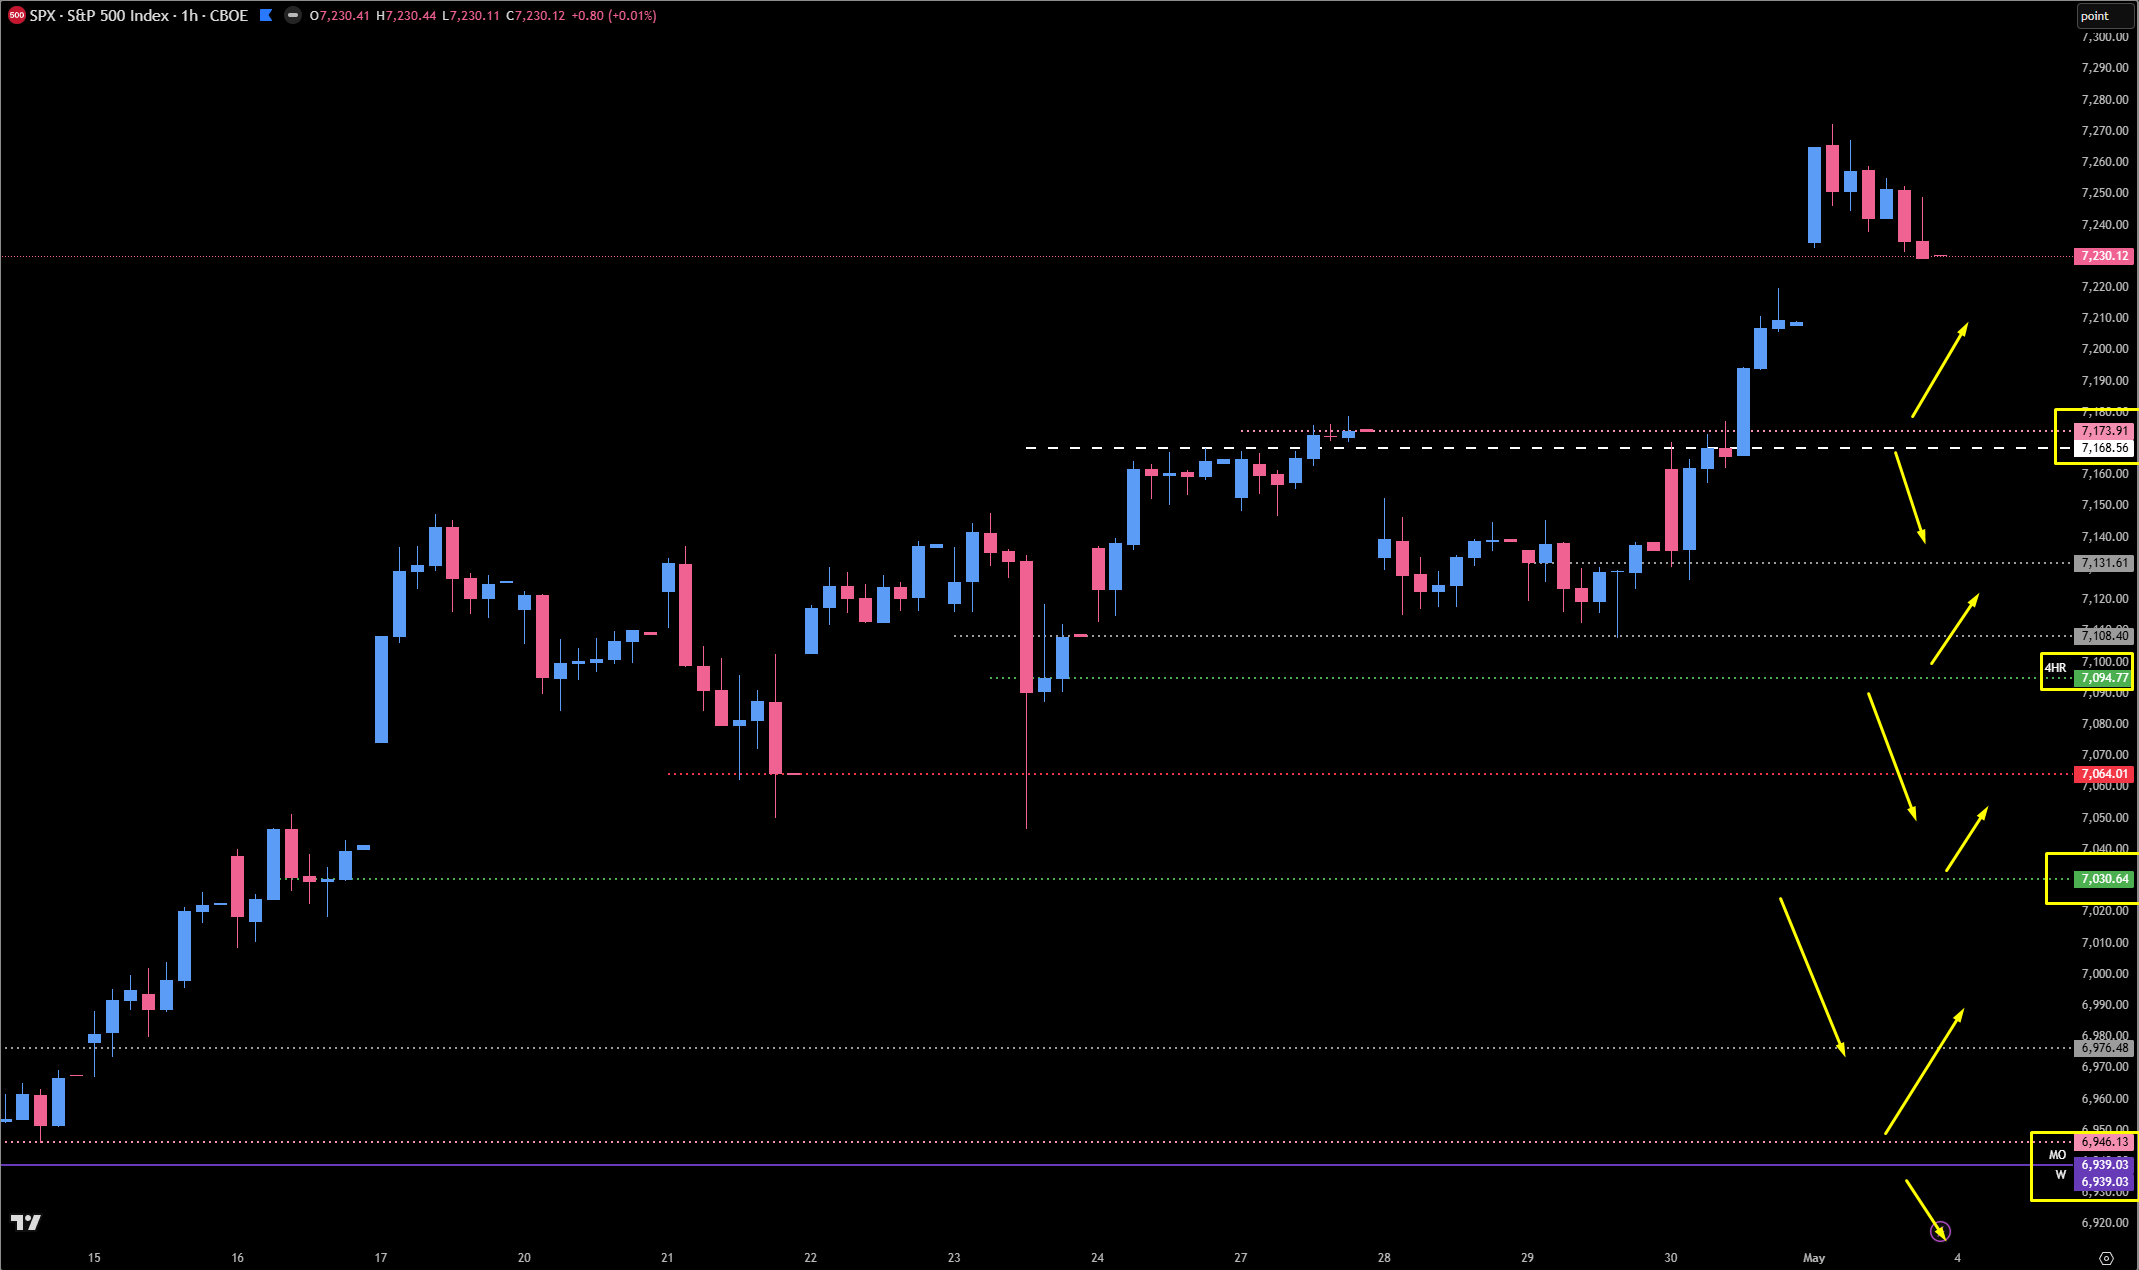
📊 SPX Context: The 7173.91 to 7178.00 Decision Area
SPX looks very similar to ES. We have been cruising around all time highs, and the market made it up toward the 7172.72 to 7172.73 area. Can we continue higher? Absolutely. There is no confirmed reason yet to be looking for a sustained down move. But we are overcooked, and a pullback would be healthy.
The major SPX area that needs to hold is 7173.91 to 7178.00. That is the zone that determines whether we continue to traverse all time highs or start rotating back into prior value.
If SPX holds 7173.91 to 7178.00, we can continue pushing higher and potentially make new highs.
If SPX breaks below 7168.00, we can start to rotate lower. From there, the next untested area is 7094.00, which is a 4 hour leg up. I would want to see 7094.00 play and then reclaim the 7108.00 daily to get the pop back up.
If 7094.00 does not hold, we have 7064.00 as a tested daily, but I do not view that as the strongest first touch support. The next big SPX spot I like is 7030.00. Ideally, we sweep the lows, play 7030.00, reclaim the lows, and then get back above 7064.00 for the continuation pop.
If SPX really pulls back, the big area for me is 6940.00. That is a weekly, monthly, and daily confluence zone, and I absolutely love that location. That is the jam. If SPX breaks below 7064.00, I really want to see the 6950s into 6940.00 hold for continuation back higher. Below that, the 6850.00 to 6845.00 area is also a monster area, with mid supports in the 6880s and 6870s.
🎯 Detailed Actionable Trade Plan (ES Futures)
The plan this week is not complicated. Above 7204.75, the Bulls still have the structure they need. Below 7204.75, we start opening the door to deeper rotation. Below 7134.00, the downside opens materially, and we can short into support. But do not get it twisted: these lower levels are buy the dip locations for me until the market proves otherwise.
The two biggest decision points are 7204.75 and 7134.00. The first is the current make or break support zone. The second is the downside momentum trigger. If 7204.75 holds, we can rotate back toward 7250.00 and potentially new all time highs. If 7134.00 breaks, we can clean up the bearish imbalance into the 7050.00 area and then start looking for quality support.
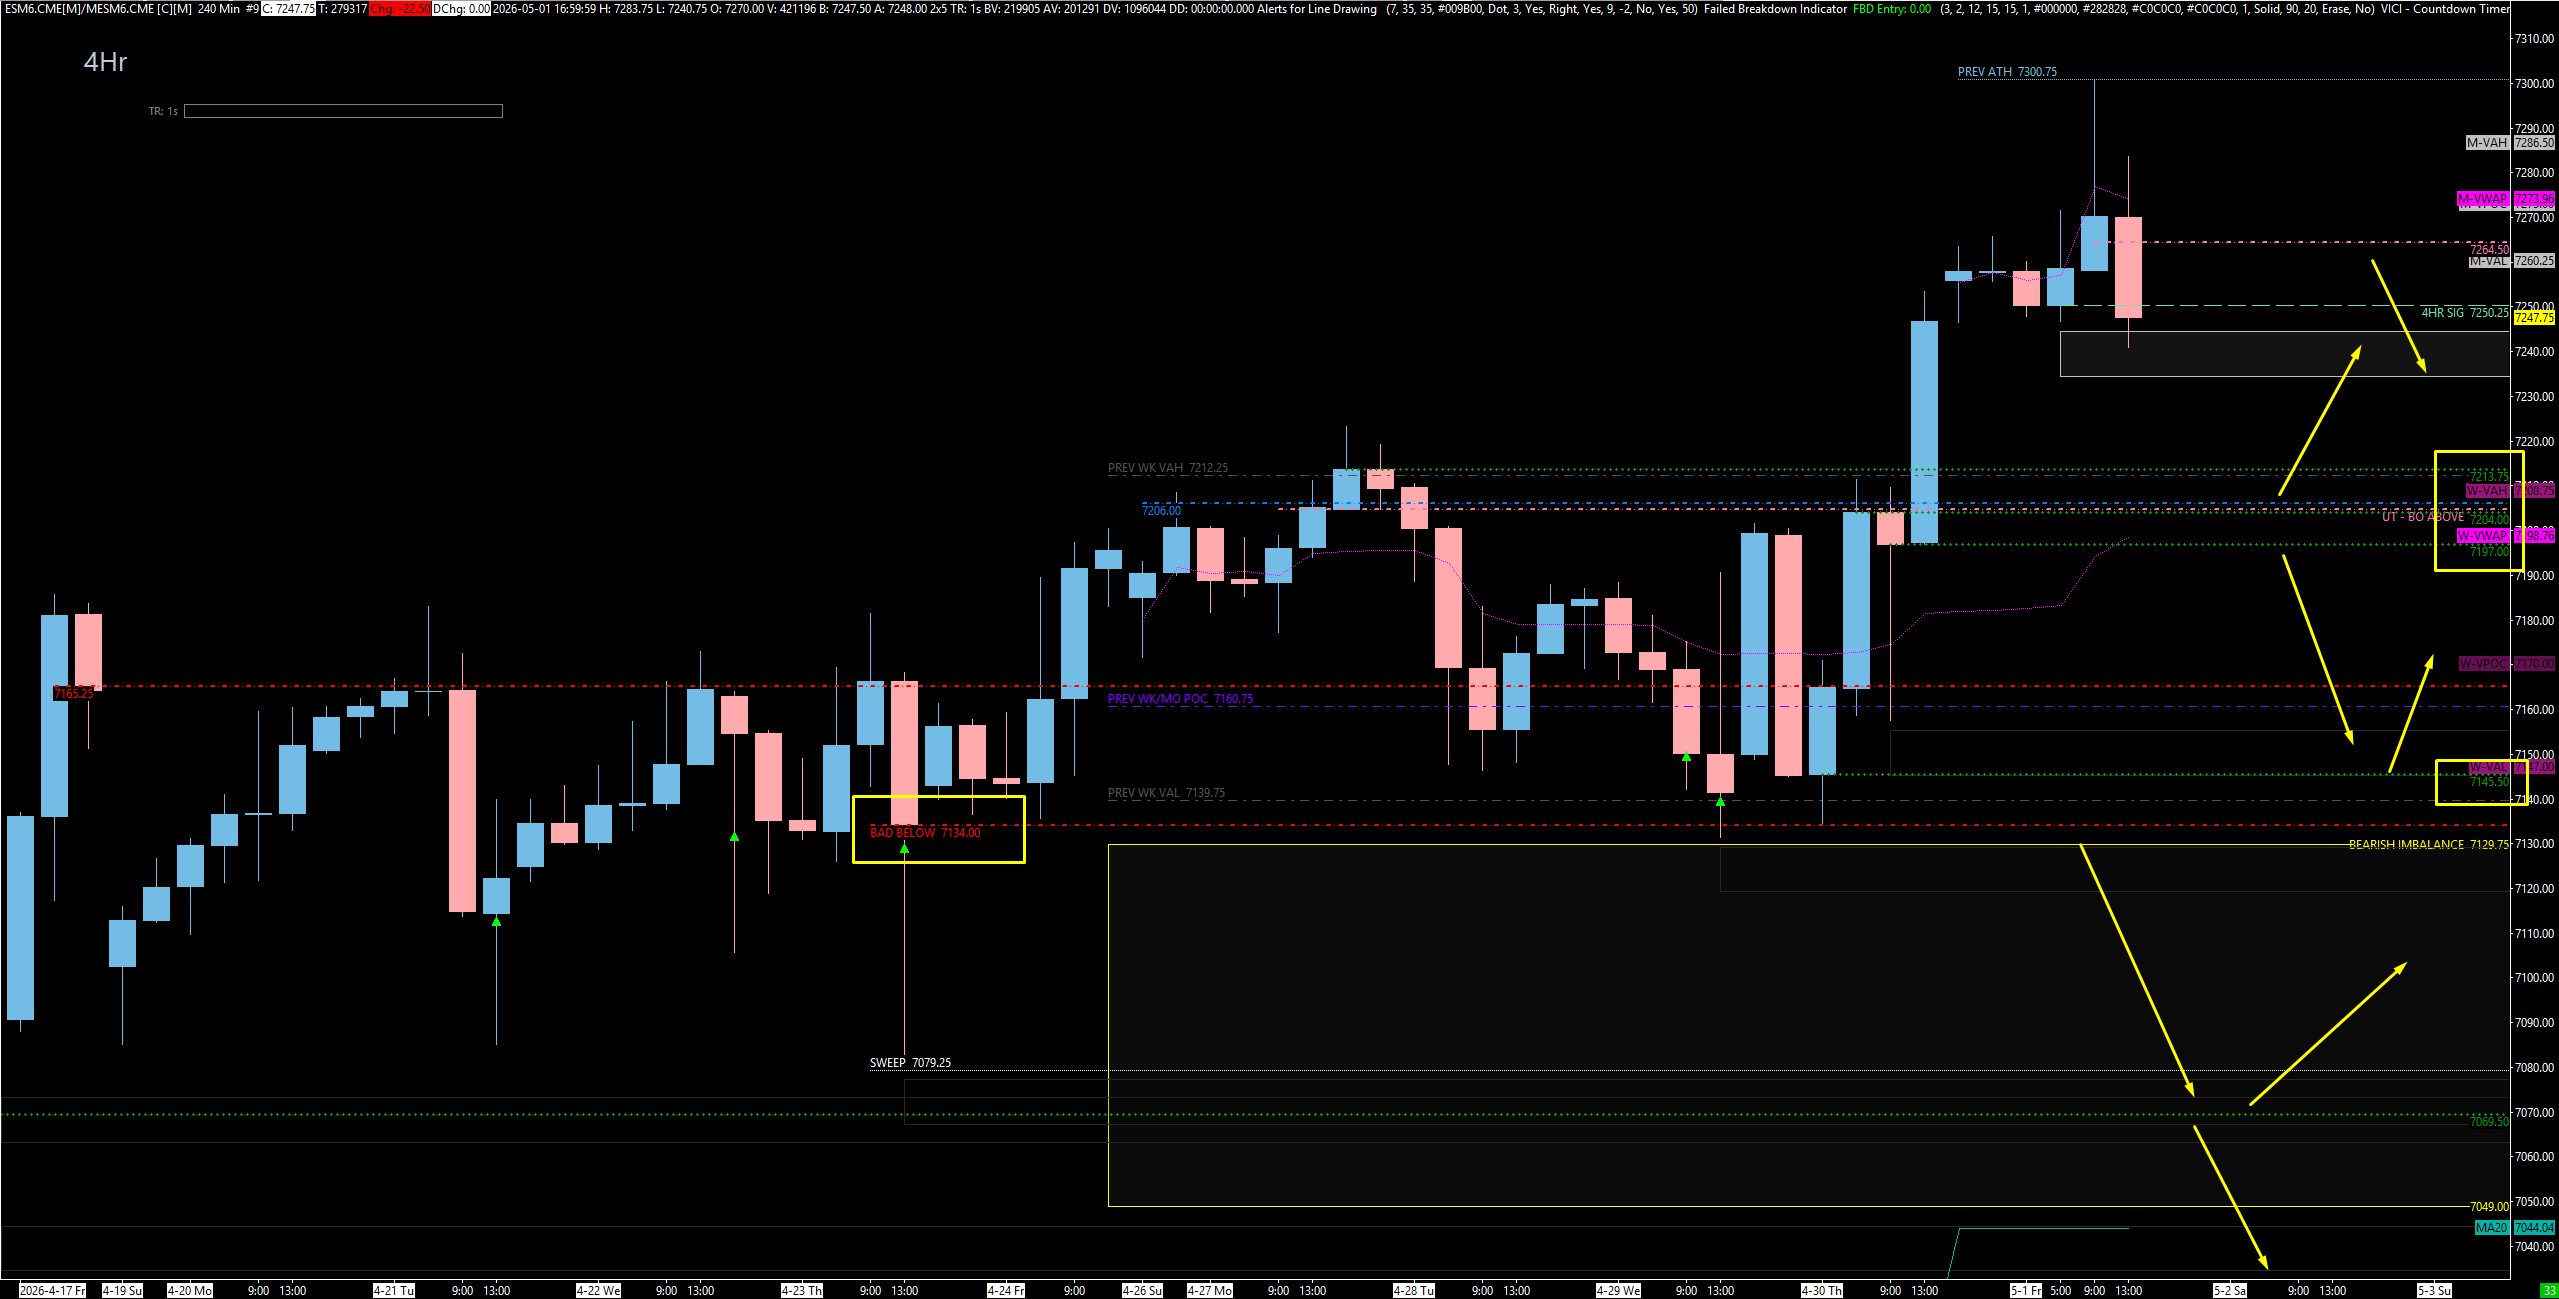
🔴 Key Resistance Zones & Setups
The Daily Resistance And Rejection Zone: 7250.00 to 7264.00
7264.00 is the current daily resistance. 7250.00 is the key TPO and 4 hour threshold that we closed below. This gives us a roughly 14 point resistance zone.
Context: The market closed below 7250.00, and the weekly TPO suggests that below 7250.00, we can continue rotating toward the 7200.00 area. The 7264.00 daily remains current resistance.
Short Setup: If we push back into 7250.00 to 7264.00 and fail, this area can absolutely lead us back down.
Warning: If price moves above 7250.00 and starts holding, be cautious pressing shorts. Above 7250.00, the Bulls can try to regain control and push back toward all time highs.
The Previous Weekly Value Area High Magnet: 7212.00 to 7200.00
7212.00 is the previous weekly value area high, and the broader 7200.00 area is the first cleanup target from the weekly TPO structure.
Context: This is the first area the market can rotate into to start repairing the inefficient profile. A move into 7212.00 or the broader 7200.00 area would make sense from a market structure standpoint.
Actionable Setup: Shorts from the upper resistance zone can use 7212.00 to 7200.00 as a first cleanup target.
Buy Setup: If price rotates into 7204.75 to 7197.00 and buyers defend, this is where I become interested in the long side again.
🔵 Key Support Zones & Setups
The Make Or Break Support Zone: 7204.75 to 7197.00
7204.75 is the daily level that needs to hold to keep this market pushing higher. 7197.00 is the lower 4 hour level, and this zone is also aligned with last week’s VWAP.
Context: This is the same major area reflected in SPX. If this zone holds, the Bulls are still in control, and we can rotate back into 7250.00 or higher.
Buy Setup: I will more than likely be a buyer in this zone if it plays cleanly. The first target is back toward 7250.00. If price pushes through 7250.00 and holds, we can make new all time highs again from this area.
Warning: This is the big make or break area. If 7204.75 to 7197.00 fails, we open the door to 7145.00 and then potentially 7134.00.
The Untested 4 Hour Pullback Level: 7145.00 to 7165.00
7145.00 is the only truly untested 4 hour level below the current support zone. 7165.00 is the daily level we want to reclaim if 7145.00 plays.
Context: If we break the 7204.75 to 7197.00 zone, this is the next clean untested support area. But once we are back underneath 7204.75, the battle becomes much harder because that old support can become resistance.
Buy Setup: I want to see 7145.00 play and then reclaim 7165.00. If that happens, we can look for continuation back toward the 7205.00 area.
Profit Target: The 7205.00 area becomes a great first target from 7145.00 because it was a monster area last week and can easily smack price on first touch from below.
Warning: If we fail to reclaim 7165.00, this can remain heavy.
The Downside Momentum Pivot: 7134.00 to 7130.00
7134.00 is the daily level that has already played twice and sent us to all time highs. The weekly TPO also points to 7130.00 as the line where the market starts to move lower.
Context: This is where things get serious. Below 7134.00 to 7130.00, we open the bearish imbalance that can take us down toward 7050.00.
Short Setup: Below 7130.00, I am looking to short into support. This does not mean I am bearish long term. It means the structure opens the door for downside cleanup.
Warning: Once 7134.00 breaks, do not blindly buy the first dip. Let price come into real support.
The Sweep And Reclaim Trade: 7079.00
7079.00 is the 4 hour sweep level that lines up with the same type of setup we saw on SPX.
Context: If price breaks below 7134.00, we could sweep into 7079.00 and attempt to reclaim.
Sweep Setup: I want to see 7079.00 play, sweep liquidity, and then reclaim 7079.00 with strength.
Target: If that reclaim triggers, we could get a juicy trade back toward 7134.00.
The Prime Buy Zone: 7022.75 to 7004.00
7022.75 is an untested daily. 7004.00 is a weekly. In the middle of this zone, we have the 4 hour area around 7018.50. This entire zone is prime for the buy.
Context: This is one of the first big areas I want to watch if we get a deeper pullback. It lines up with the bearish imbalance cleanup and gives us quality structure to do business.
Buy Setup: If price comes into 7022.75 to 7004.00 and holds, I want to see a reclaim of 7004.00, then a reclaim of 7022.75. If we get that, we are off to the races.
Warning: We do need to watch the broader 7008.00 to 7020.00 area if price comes into this zone. This could hold first, or price could flush lower into the next major area before reclaiming.
The Favorite High Time Frame Buy Zone: 6961.75 to 6963.00
This is my favorite location. 6961.75 to 6963.00 is the monthly, weekly, and daily confluence area, and it lines up beautifully with the SPX 6940.00 zone.
Context: This is the real best location I want to buy if we get a meaningful pullback. This zone would satisfy the larger pullback idea and still keep the higher time frame bullish structure intact.
Buy Setup: If 7000.00 does not hold, I think the 6960s can absolutely do it. I want to see buyers defend this area and reclaim back above the prior breakdown structure.
Expectation: A move into the 6960s would be roughly the type of 4% pullback that fits the prior data window. That would be healthy, not bearish, as long as buyers show up.
The Deep High Time Frame Support Cluster: 6883.00 to 6834.00
Below the 6960s, we have weekly, daily, and 4 hour support levels between 6883.00 and 6834.00. This area also has the 200 day, 100 day, and 50 day moving averages nearby.
Context: This is a much more aggressive selloff scenario, and I am not expecting this as the primary outcome this week. But if the market does push lower, this area should be respected.
Buy Setup: I would expect a reaction if we come into 6883.00 to 6834.00, but we would need to reevaluate the structure once we get there.
Warning: Below this zone, things get very real.
🚨 Momentum Shift Levels
Upside Momentum Level: 7250.00
If ES reclaims and holds above 7250.00, the Bulls can regain control and push back toward 7264.00 and potentially new all time highs.
Primary Support Line In The Sand: 7204.75
As long as 7204.75 holds, we can continue higher. This is the first major make or break level for the week.
Downside Momentum Level: 7134.00 to 7130.00
Below 7134.00 to 7130.00, the market opens the downside imbalance and we can short into support.
Prime Buy The Dip Level: 6961.75 to 6963.00
This is my favorite deeper buy location. If we get there, this is where I want to be extremely focused.
📌 Cheat Sheet — Quick Levels Map
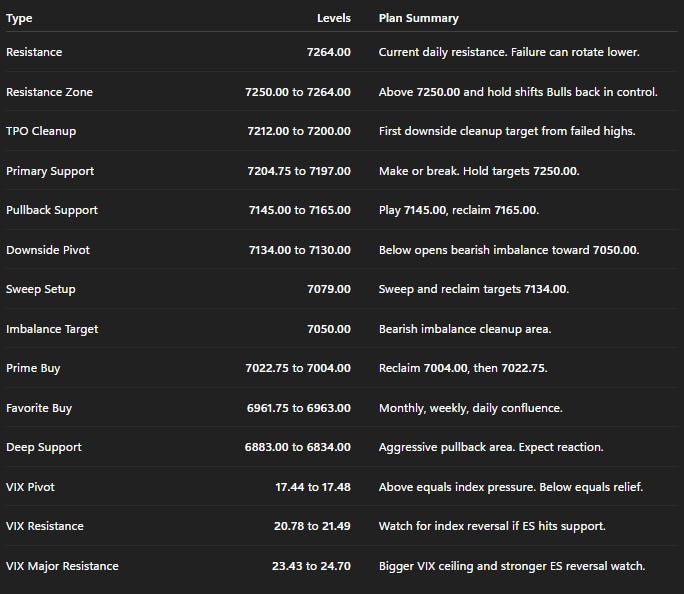
🧠 Final Thoughts
This is one of those weeks where discipline matters. We are still bullish. We have not lost support on any real time frame. But the market is extended, VIX is suppressed, the weekly TPO is inefficient, and the yearly VWAP structure is screaming expensive. That does not make me bearish. It makes me patient.
The best trade this week may not be chasing highs. It may be letting the market rotate, letting VIX pop, and then stepping in at real support. If 7204.75 holds, I am looking back toward 7250.00 and potentially new highs. If 7134.00 breaks, we can short into support, with 7079.00, 7022.75 to 7004.00, and ultimately 6961.75 to 6963.00 as the key buy the dip roadmap. Do not get it twisted. These are buy opportunities until the market proves otherwise.
Use VIX as the tiebreaker. If VIX pushes into 20.78 to 21.49, 23.43, or 24.70 while ES is into major support, that is where we could get the next great reversal opportunity. Stay patient, let the levels come to you, and do not force trades in the middle of nowhere.
Until next time—trade smart, stay prepared, and together we will conquer these markets!
Ryan Bailey, VICI Trading Solutions.
📊 TradingView Indicator String
Copy and paste the levels below into your S&P Edge Levels indicator to automatically plot today’s key levels on your chart:
7264.00|D|D
7204.75|D|D
7197.00|4HR|4H
7165.00|D|TD
7145.00|4HR|4H
7134.00|D|TD
7079.00|4HR|4H
7022.75|D|D
7018.50|4HR|4H
7004.00|WK|W
6963.00|MO/WK/D Big Buy Spot|M
6961.75|MO/WK/D Mega Buy|D
6883.00|WK/D/4HR Support|W
6834.00|WK/D/4HR Support|D

