

Welcome back everyone. It is time for the Weekend Review, and we come off another incredible week — on Friday we caught the absolute high and rode it down for 75 points. It was an incredible display of trade plan amazingness once again, and we did it live in the Inner Circle. It seems like we just continuously have back-to-back amazing weeks, and the room is really proving itself out to be something special. I am very proud of everyone in there. We have got some crazy hitters right now, we have got some women who are just outshining everyone — I am so proud of them — and then of course a whole slew of new people coming on strong. I am looking forward to seeing everybody’s performance this week, as I deliver the banger of trade plans as usual.
This evening we have gapped up pretty high at the Sunday Globex open and came right into our major level of resistance. So let’s take a look at VIX, SPX, and ES and figure out exactly what we are going to play coming into the week.
☕ FREE RESOURCE — The SPX Morning Brief | Delivered 5:45 AM EST Take advantage of this. Every morning at 5:45 AM EST, the SPX Morning Brief hits your inbox with everything you need to understand the significant value levels on SPX, over 150 indicator prediction assessments, and the top 5 news articles of the day. It is a fast read that gets you fully prepared well before the bell. It is free — all I ask is that you let me into your inbox. Sign up now → https://pages.vicitradingsolutions.com/spx-edge
A Note on This Week’s Market:
News: Nothing specific flagged on the radar heading into the week. With a gap this size already printed in the Sunday session, monitor the open closely — the reaction to this gap is going to tell us more than any headline will.
The Gap: We gapped up pretty high at the Sunday Globex open, running from Friday’s 7503 close all the way up into 7560 at the open, sitting around 7548 at the time of this writing. We got to roughly 7559 in the pre-market, which means we have already pushed right into the highest untested four-hour, and we are starting to drift a little lower off of it.
Range: We remain inside a massive balance — the market continues to get propped up, and we keep getting these pops and smacks inside the structure. From the weekly TPO, above 7563 we can push much, much higher; below 7481.75 we shift down toward the previous weekly point of control and ultimately the 7412 weekly. In between those two lines, we are essentially in the middle and a little indifferent, free to move back and forth.
Gamma: We will have to wait and see what happens coming into Monday with the gamma regime. With VIX way down in the dumps and the market getting another little lift, it is going to be very interesting — I am not going to pretend to know before we get the read.
Trend: Starting to regain. In my opinion we could potentially say that both ES and SPX have now gained on the four-hour and the daily timeframes. That is a meaningful shift from where we have been, and it is why we are going to spend real time this week talking about what happens if we move higher — the possibility is genuinely there.
🧠 Current Market Context
The Gap Into Resistance & The Two Lines That Define The Week
We come into the week of August 3rd having gapped up hard into our major level of resistance, and the structural picture has genuinely shifted. As usual, I want to start with the weekly TPO, because the weekly value areas give us a very defined edge for where things can shift — and right now they give us two lines that define everything.
The first is the upside line. Per last week, we were bullish basically above 7560, and that has now shifted slightly up to 7563. I truly feel that above this area we can continue to push much, much higher. We are at 7548 on this gap up and actually pushed all the way into 7560 at the open, so this is still our big above/below line. It is not necessarily bearish below — it is more that we are very bullish above.
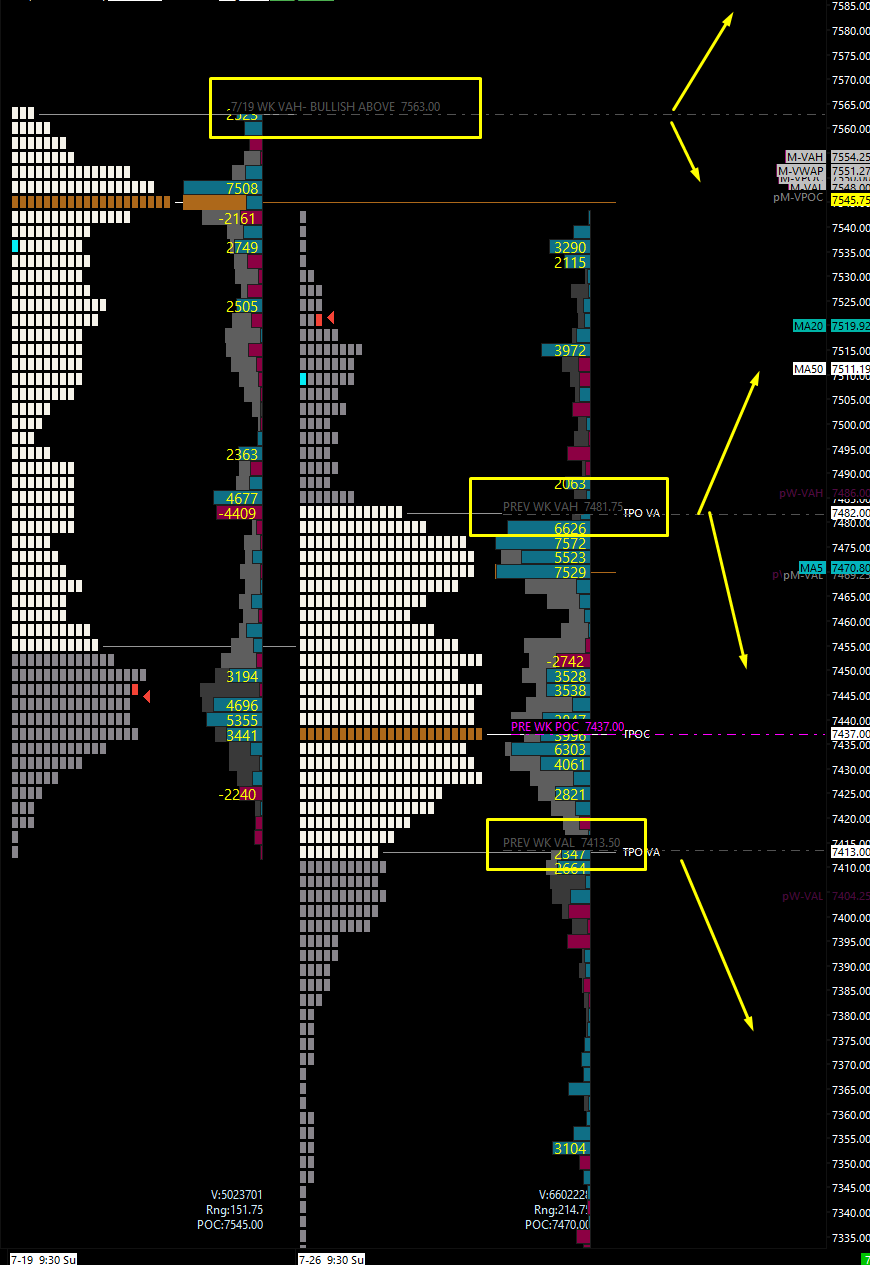
The second is the downside line, and it is the one that decides it: the Previous Weekly Value Area High at 7481.75. This is a huge spot, and I have a massive untested area sitting right here that is very, very important. It is essentially the same spot I show you on SPX that made the difference at that weekly — the exact same context. If they move below 7481.75, we will continue to move much lower, easily get the previous week’s point of control, and more than likely slip all the way down into the 7413.50 Previous Weekly Value Area Low. And that price should be familiar to everyone: our big weekly we have been monitoring sits at 7412, so it is no coincidence the previous weekly VAL is right there. We are extremely bearish underneath 7413.50 and the 7412 weekly. You can see that large shelf on the profile — it makes all the difference. Above it, our bullish structure is intact; underneath it, things shift greatly to the downside. And above 7481.75 but below 7563, we find ourselves in the middle and a little indifferent, able to move back and forth.
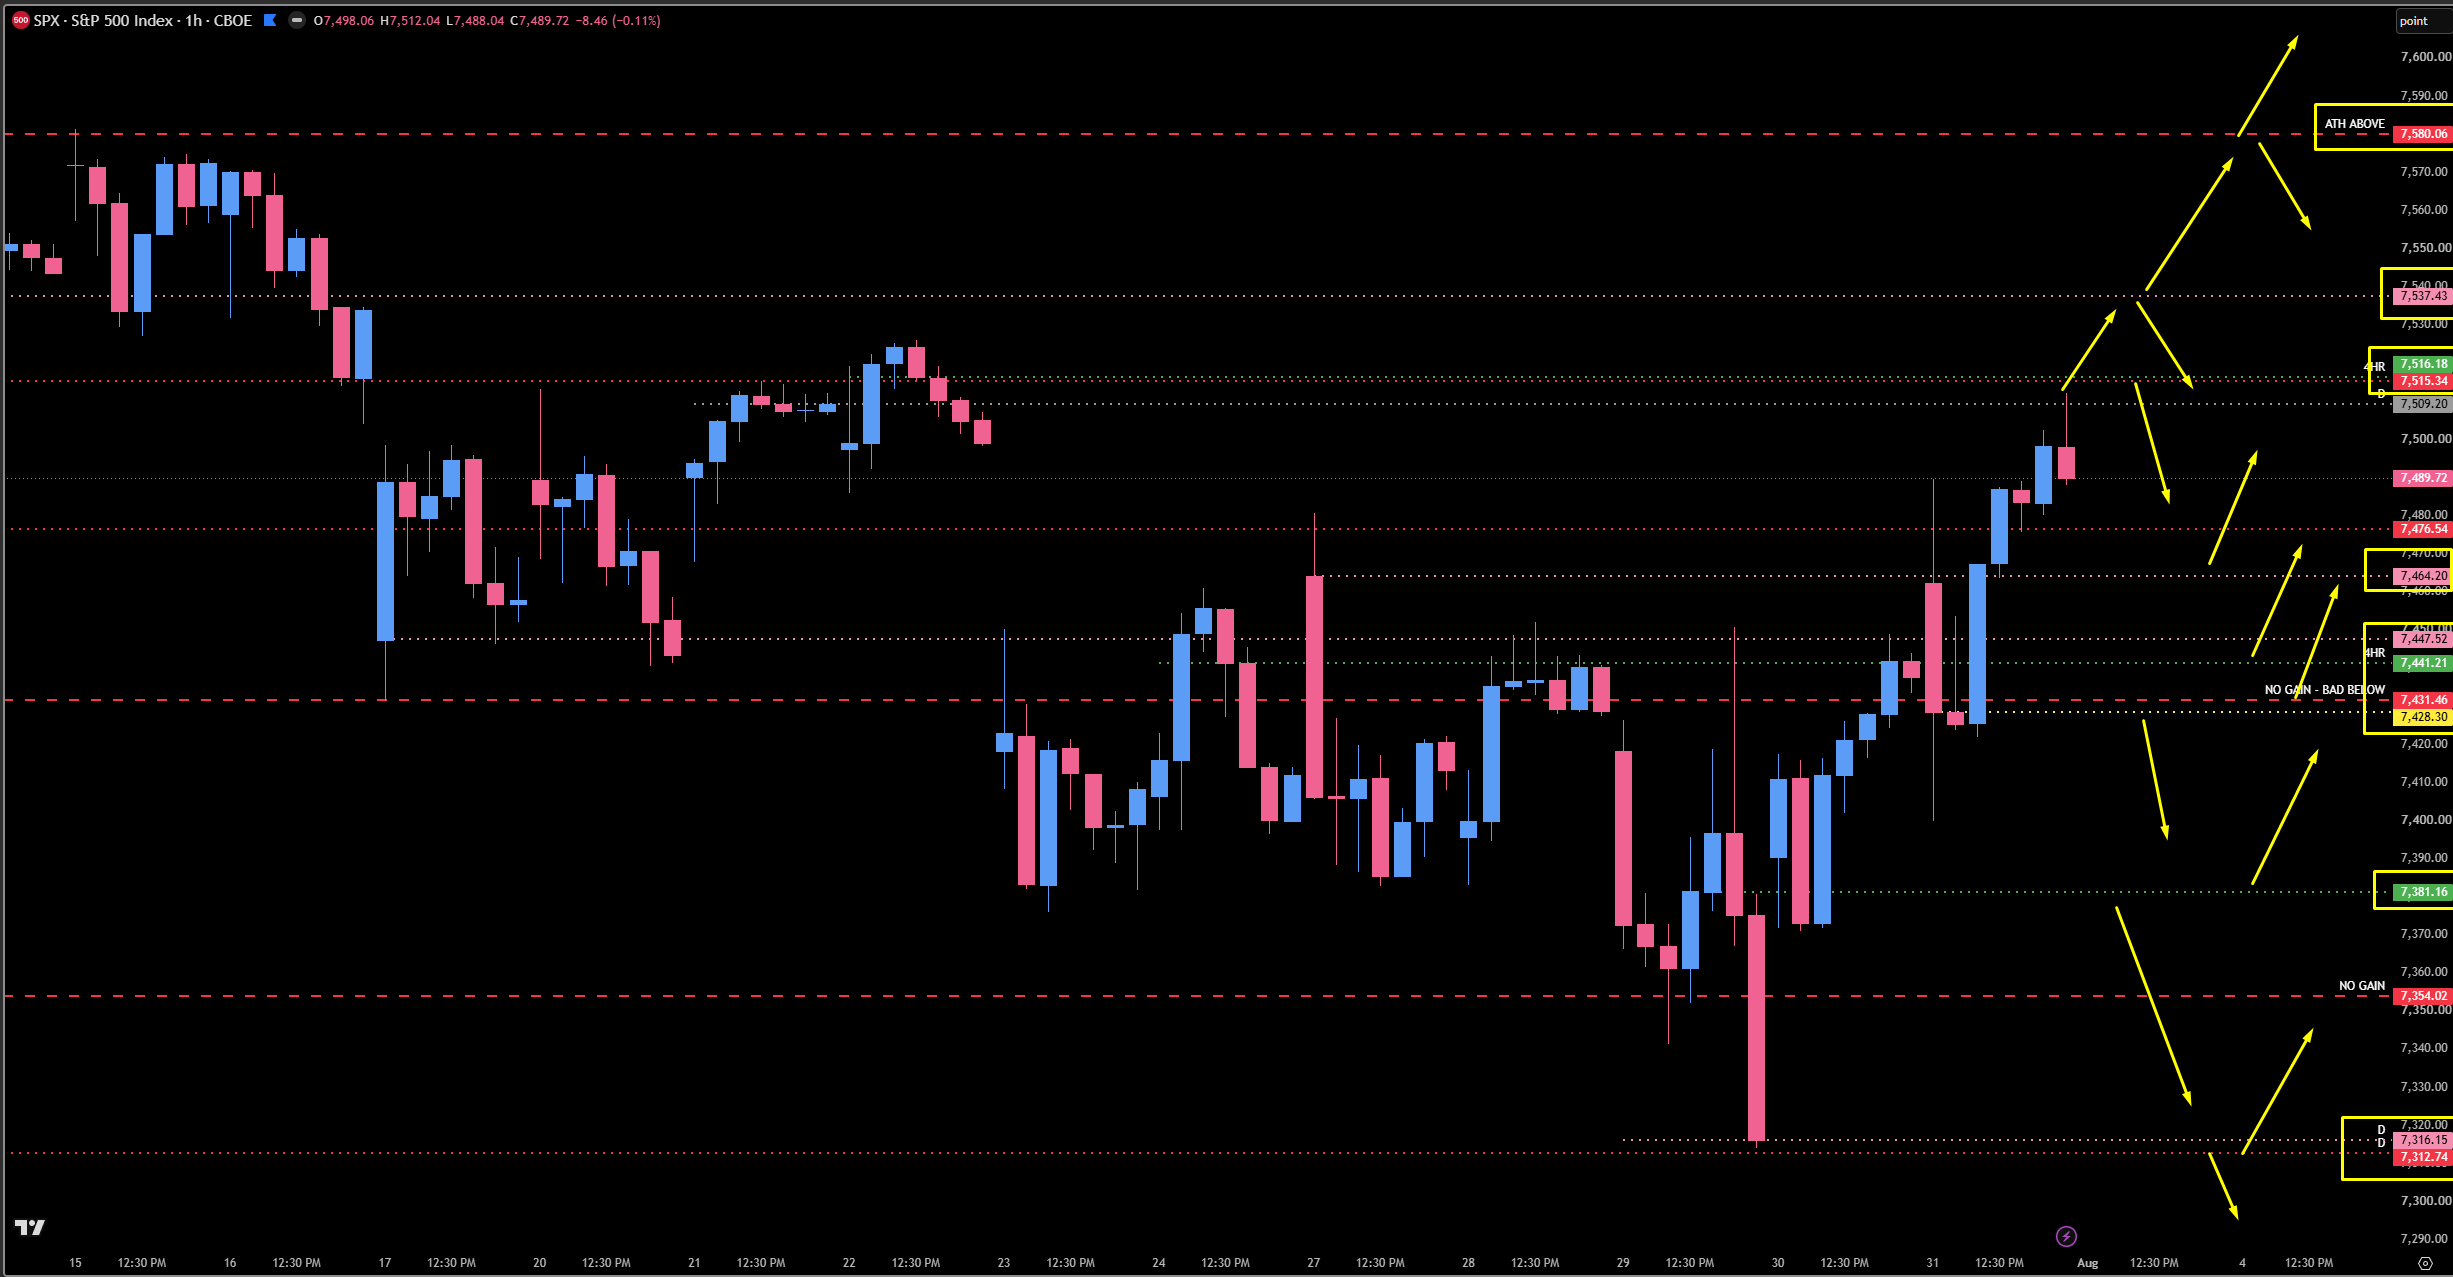
On SPX, we have got ourselves some support, but we also find ourselves in a massive resistance area. The 7515 spot is truly a big area for us and is one of the big leg downs. Here is what matters: we are now back above the 7464 area, and we clearly tested 7476 for the pop up into our big major resistance. But what they have done is leave 7464 untested if we are in fact going to move higher — this was a solid gain above the level, and it is why I say SPX and ES have gained on the four-hour and daily. 7464 is prime for a pop; we want to get back above 7476 for continuation higher, taking us through the 7515 area. Push above 7515 and we basically shift momentum back to the upside — at that point be extremely cautious of shorts, because it might just pull back into the daily only to come right back higher. I have one last untested area at 7537 that could play for a reaction. Once we are above 7537, it is my belief we more than likely make all-time highs, as the only thing higher is a big weekly that has already played at 7580 — they could come up here and get a little head bump only to move higher into new all-time highs.
On the SPX support side, below 7464 we have the last stand area, and this is very important. It is essentially a major momentum shift area and indeed the lowest untested area — the spot I believe has to hold if we are going to continue moving higher. That is the daily and four-hour I like very well at 7447 and 7441. Remember, 7447 was the big daily that kept us contained not one day, not two, not three, but four days, keeping the lid on things as price pushed into it — so I truly believe it will be great from the top down. The 7441 four-hour sits right in the middle of that valley and I really like it too; it is very sexy to me. If they want to pull it back into the pocket, we have the 7431 weekly, which is tested, but I like the location and the confluence. Most importantly, we have our last and final one-hour at 7428, the current leg to the high — the last untested area. So: 7447 through 7441 is our first zone, then they could come all the way down to 7428 to try again, with our big profit-taking area at 7476 on the push higher. Underneath 7428, this thing can get ugly and get ugly fast. I have one untested four-hour at 7381 that lines up perfectly with a ton of structure — it could get a reaction, but it will more than likely just take us back up to the 7431 weekly for a big head bump. Below 7381 and the 7352 weekly, we continue to point lower, with nothing left untested until the four-hour and daily leg at 7316. Below that, we more than likely make new lows underneath 7275 and ultimately 7225.
🚨 VIX Analysis: The 16.20 Floor Break
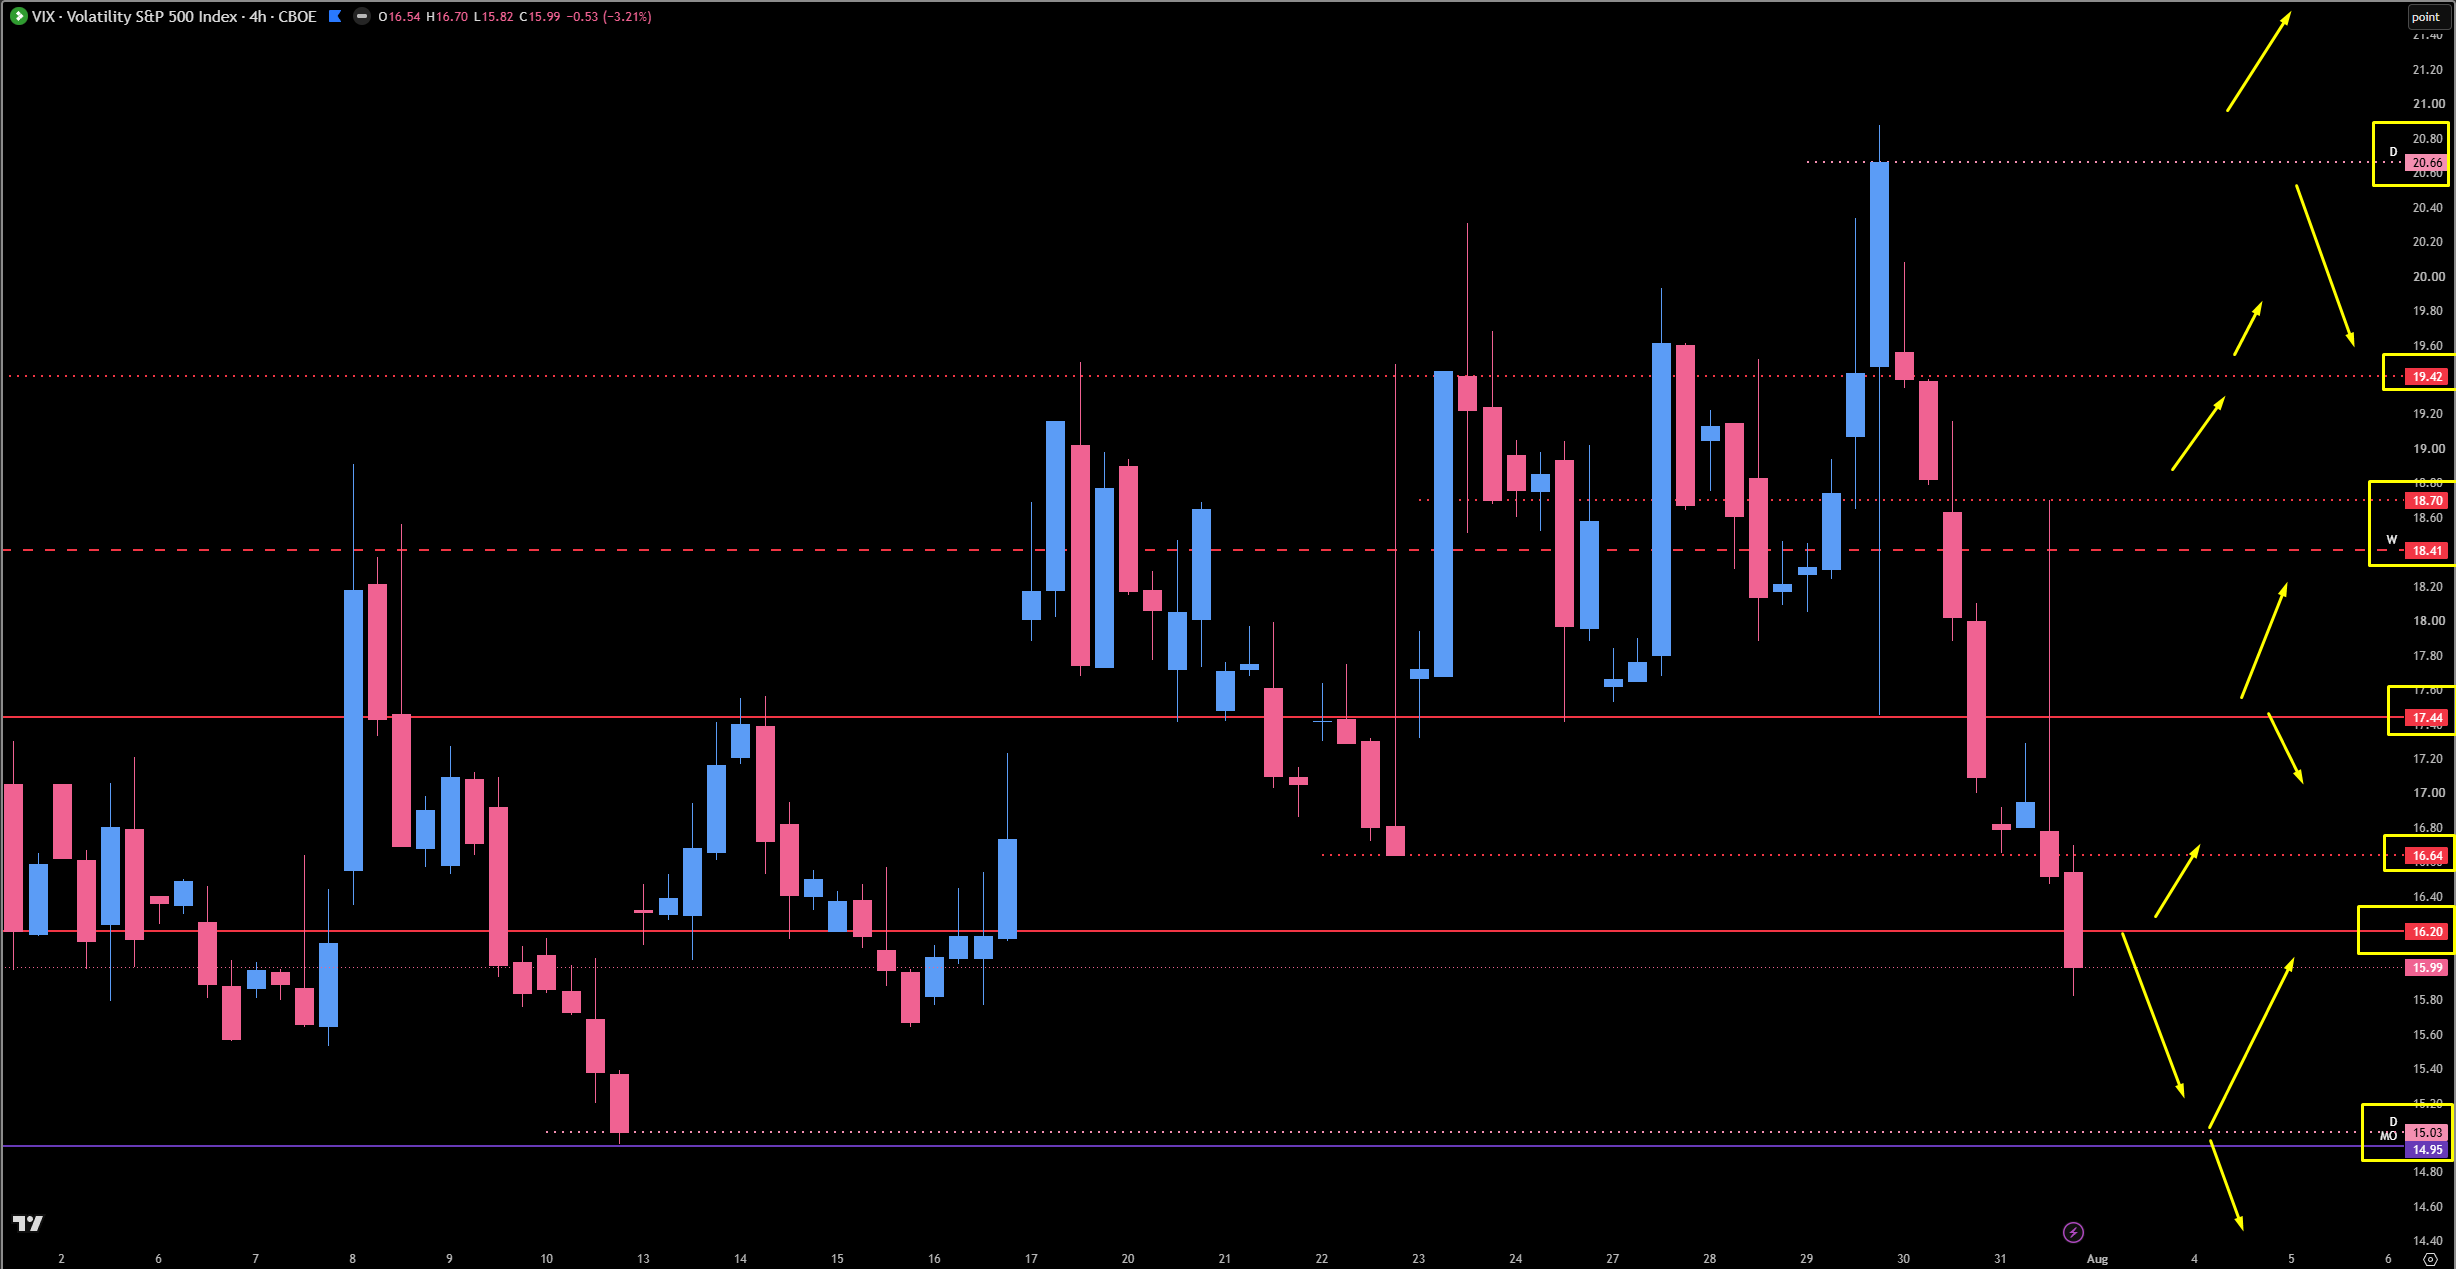
VIX has been coming down for quite some time and just continues to get beat up as this market gets propped up inside the balance. The big one, as always, is 17.44 — and we are now well below this level. More importantly, we are now beneath the 16.20 lower floor area as well. That close below on Friday was a big move for us, and it is obviously one of the reasons we gapped up so large coming into the Sunday session.
The Downside Target — Last Untested: 15.03 (Untested Daily) and 14.95 (Weekly). I am obviously eyeing below 16.20, assuming we come down and touch this untested daily at 15.03 and ultimately the weekly at 14.95. This is the last untested area I have for some time, since we really have not charted anything lower than the $15 handle — every time we come down here, we get pops out of that $14-$15 handle range I have talked about time and time again. It is my belief that if we get down there, we more than likely get another pop from around the $15 range, simply out of market dynamics and understanding that VIX is a little oversold at this point. Do I believe we could come down here? Yes. In which order? That is yet to be seen — but this is certainly an area to keep an eye on.
The Reclaim Ladder: 16.20 (Monthly) and 16.64 (Daily). These are our significant areas to watch on the way back up. I am not obsessed with the 16.64 daily other than using it as a monitoring pivot for above/below, but above 16.20 is going to give us some momentum, and then 16.64 after that.
The Big Line: 17.44. Once we get back to the big 17.44, we watch this area closely, because 17.44 is inherently bearish for the indices. A big push over 17.44 is going to send VIX higher and there is nothing left to stop it — we do not have anything untested until we get all the way to 20.66.
The Ceiling Above: 18.50 and 19.42. We have used the 18.50 and the 19.42 more times than once, and the 19.42 has proven itself time and time again to be an excellent ceiling — that will be a big pivot to get above or below on the way up, ultimately just to come test the 20.66. Will we get up there at some point this week? I do not really know. My assumption is yes, but we will have to see how our structure levels play out in between.
🎯 Detailed Actionable Trade Plan (ES Futures)
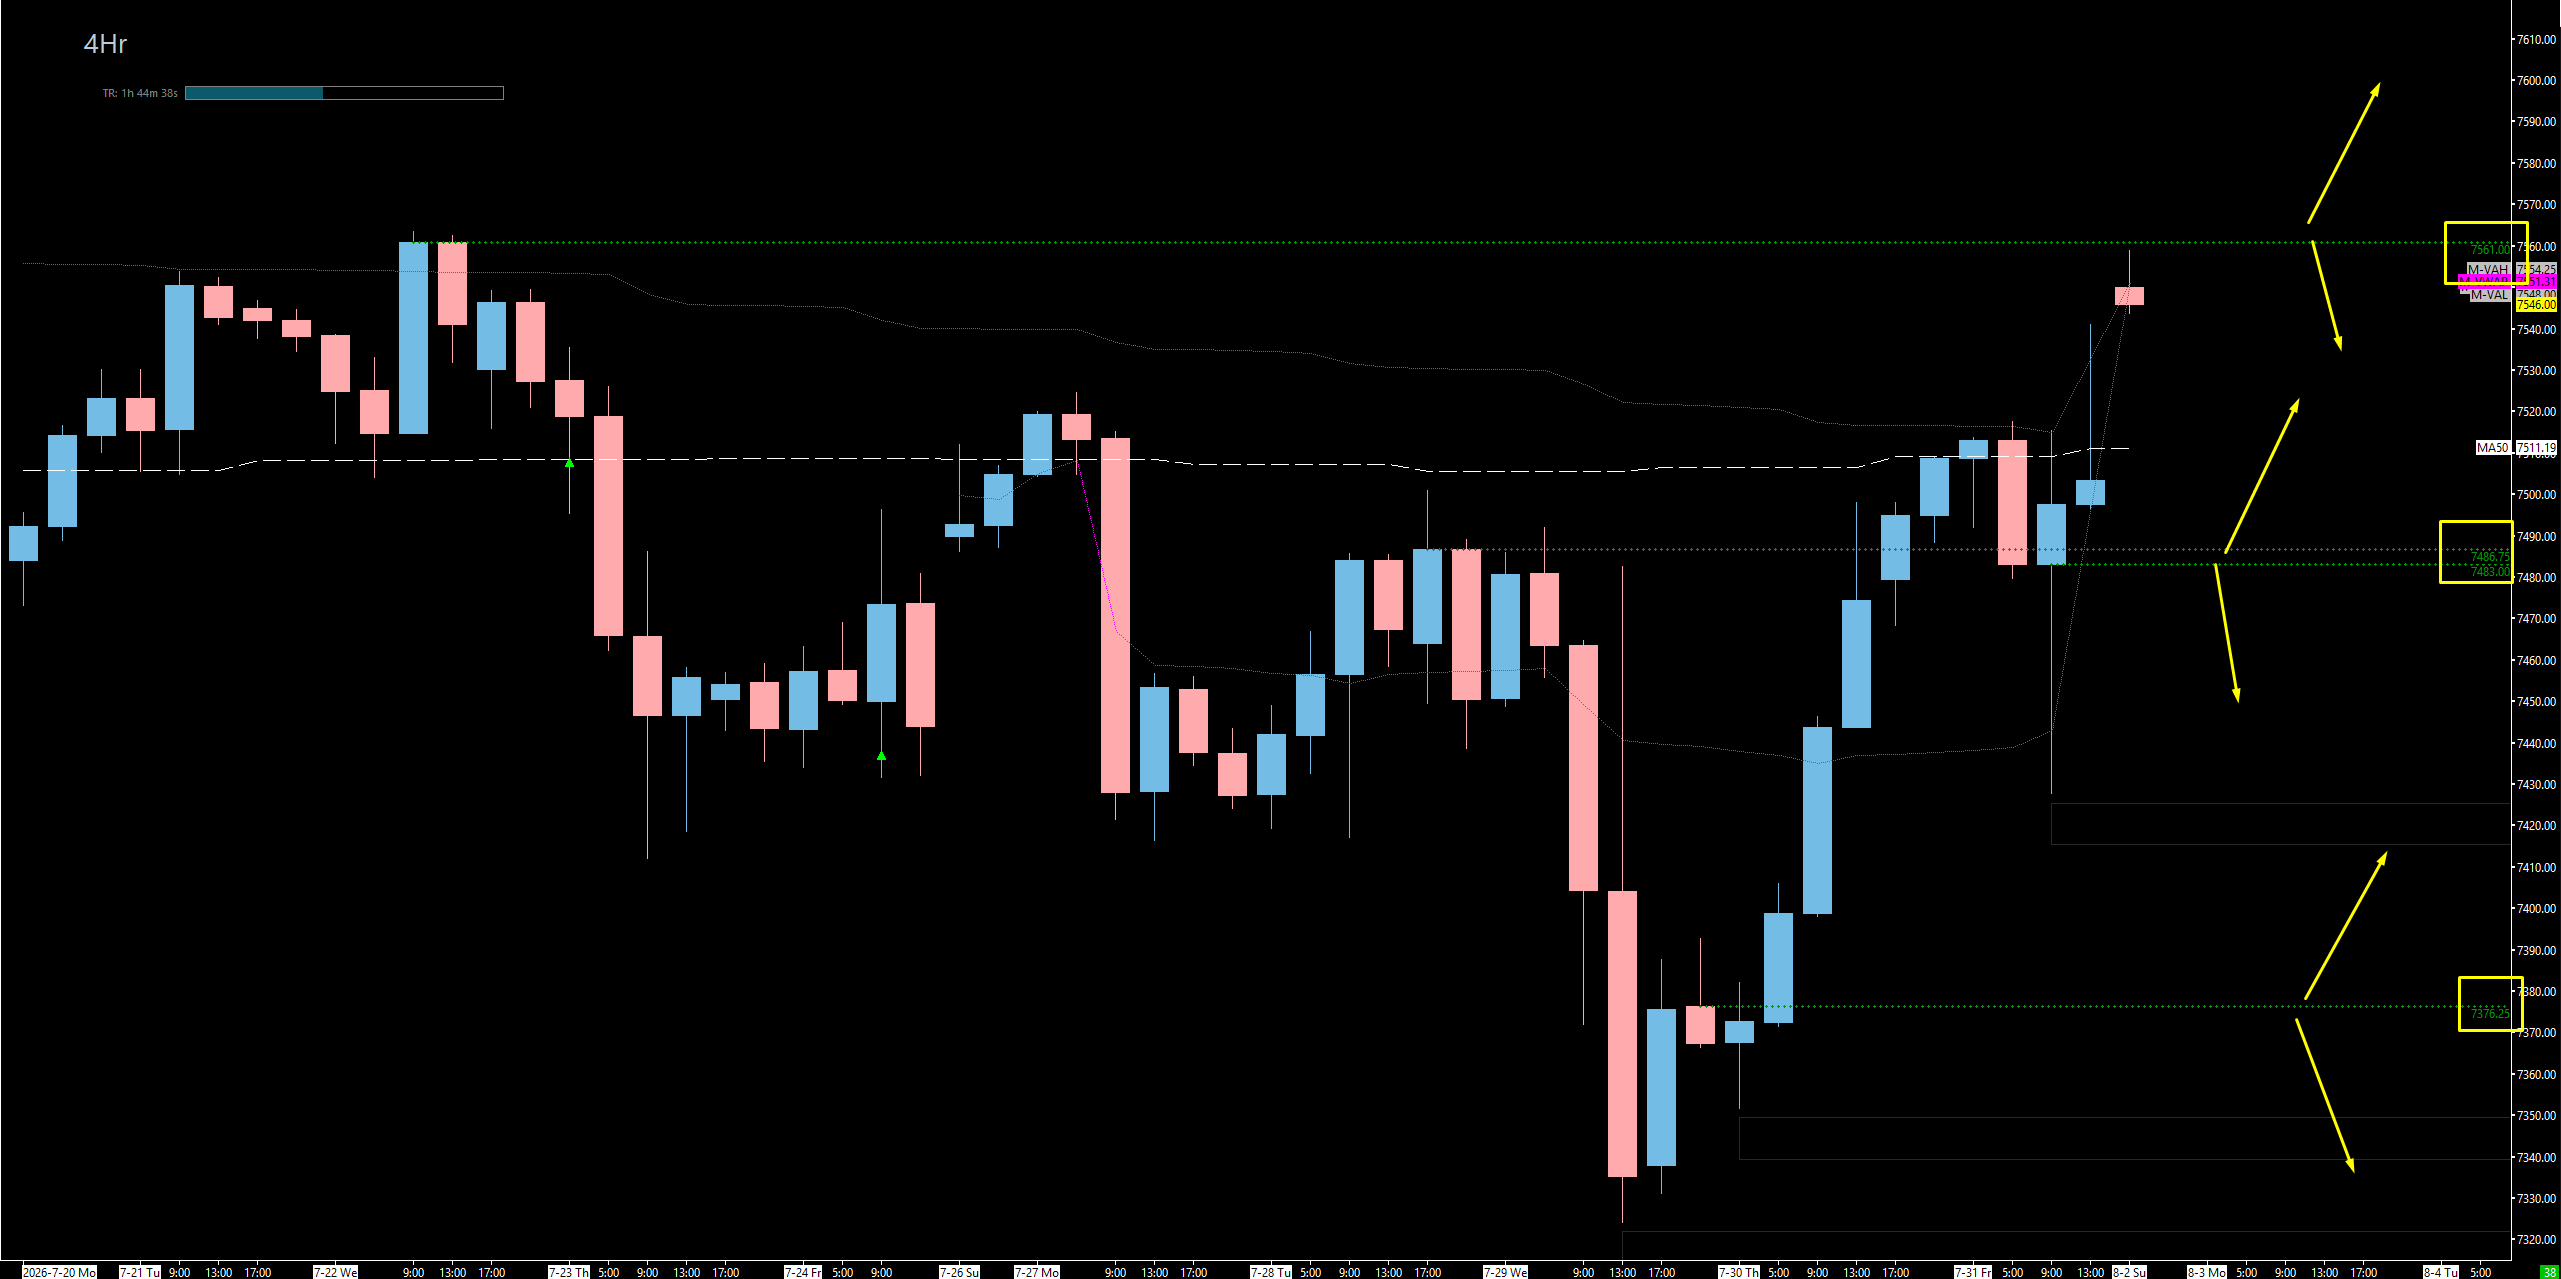
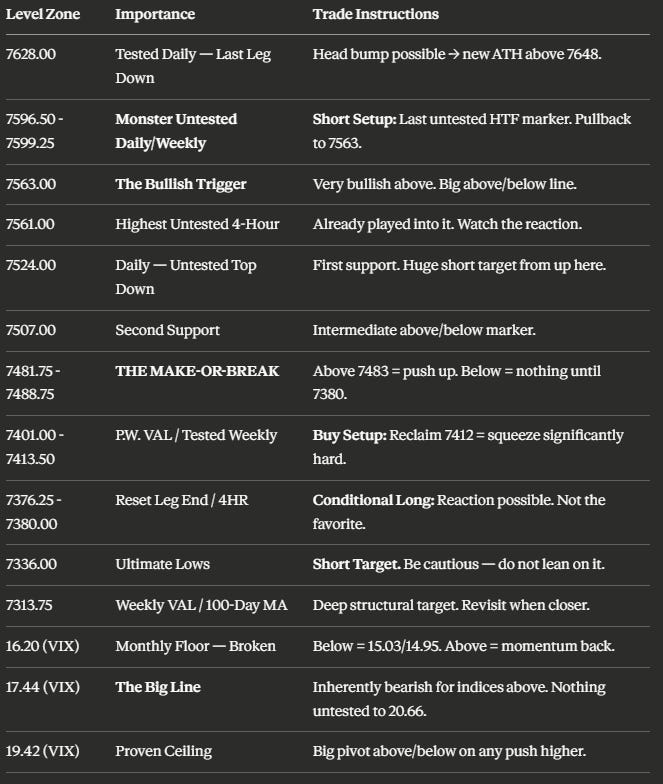
We gapped straight into resistance, so this week is about respecting two lines and trading the range between them. Above 7563 we are very bullish and the door opens to the monster untested daily/weekly combo at 7596.50 - 7599.25. 7481.75 is the make-or-break — the Previous Weekly VAH holding the confluence of the daily at 7488.75 and the four-hours at 7486.75 and 7483. That either holds and we pop back up, or we shift momentum back down and could potentially come much, much lower. Our three primary support areas on a pullback are 7524, 7507, and the 7481.75 - 7488.75 confluence. Below that, there is no untested support at all until 7380.
🔴 Key Resistance Zones & Setups
The Highest Untested 4-Hour: 7561.00
7561.00 (Highest Untested Four-Hour).
Context: We have already pushed all the way up into 7561 to play this highest untested four-hour — or at least extremely close to it, getting to about 7559 in pre-market — and we are starting to drift a little lower off of it. This was a pretty massive gap all the way up from the 7503 Friday close.
Actionable Setup: Watch the reaction here. A rejection off 7561 into the cash session keeps us contained inside the balance and points us back toward the support areas below. Acceptance through it puts the bullish trigger directly in play.
The Bullish Trigger: 7563.00
7563.00 (The Big Above/Below Line).
Context: Per last week we were bullish above 7560, and that has shifted slightly up to 7563. I truly feel that above this area we can continue to push much, much higher. It is not necessarily bearish below — it is more that we are very bullish above. We pushed all the way into 7560 at the open, so this line is live right now.
Actionable Setup: If we push higher than 7563, regardless of what plays below, we ultimately have the big untested daily/weekly spot above in play. This is your gate for the entire bullish scenario.
The Monster Spot — Last Untested High-Timeframe: 7596.50 - 7599.25
7599.25 (Weekly), 7596.50 (Untested Daily).
Context: This is the big untested daily/weekly spot we dealt with a couple of weeks back, and it is a monster spot. It is ultimately the last and highest untested high-timeframe marker I have before we get to all-time highs. This level is massive — 7596.50 / 7599.25 is nothing to sneeze at, and it could absolutely play.
Actionable Setup: Short Setup: If this plays on the way up, we know the massive area of support is at 7563 — I would expect a pullback into 7563 as the final. From there, let price determine whether they continue to move lower, which would put us back with momentum down underneath 7560, or whether we hold and continue to traverse higher into all-time highs.
The Last Daily Leg Down: 7628.00
7628.00 (Tested Daily — Last Daily Leg Down).
Context: If they push above 7599, we come into the last daily leg down at 7628. It is ultimately tested and has already played.
Actionable Setup: Expect maybe a little head bump here, and then a continuation to make new all-time highs above 7648. This is the final marker before price discovery.
🔵 Key Support Zones & Setups
The First Support — Untested From The Top Down: 7524.00
7524.00 (Daily — Technically Untested From Top Down).
Context: This one should be familiar to anyone who has played this with me over the past few weeks. We got a perfect touch here that led us down to the lows prior — this was a big daily we were monitoring to the left for above/below, and that was a perfect test. Right now it is technically untested from the top down, which makes it a huge target for us from a short up here.
Actionable Setup: This is the first of my three real support areas. Watch for a reaction on a pullback into 7524, and use it as the first downside target if we are fading the gap from above.
The Second Support: 7507.00
7507.00 (Familiar Structural Support).
Context: The next of my three support areas, and this one should also be familiar to everyone. It sits between the 7524 daily above and the big confluence zone below.
Actionable Setup: Use 7507 as the intermediate above/below marker on a pullback. Holding here keeps the pullback orderly; losing it puts the make-or-break confluence directly in play.
THE MAKE-OR-BREAK — P.W. VAH & Daily/4-Hour Confluence: 7481.75 - 7488.75
7488.75 (Daily), 7486.75 (Four-Hour), 7483.00 (Four-Hour), 7481.75 (Previous Weekly Value Area High).
Context: This is the last and final spot, and it is the one that decides the week. The daily at 7488.75 stacks with two four-hours at 7486.75 and 7483, and the Previous Weekly Value Area High at 7481.75 lines up perfectly with that 7483 four-hour. This is the exact same context as the SPX 7428 / 7431 area — extremely important to stay above or move below in terms of bearish or bullish momentum. Underneath here, I start to shift more to the bearish side.
Actionable Setup: As long as we stay above 7483, we could continue this push up. That either holds and we pop back up, or we shift momentum back down and could potentially come much, much lower.
Warning: Underneath this zone, I do not have any more untested support — it is all gray and red until we get all the way down to 7380. If we push below, we have nothing else for some time and we could come down into the previous weekly point of control and ultimately shift all our momentum back down to the 7412 weekly.
The Weekly Reclaim Zone: 7401.00 - 7413.50
7413.50 (Previous Weekly Value Area Low), 7412.00 (Tested Weekly — The Big One), 7401.00 (ETH Daily Buffer).
Context: The 7412 weekly is definitely tested, but it is an important weekly as it has been time and time again — and the 7413.50 Previous Weekly VAL sitting right on top of it is no coincidence from a profile perspective. It could certainly get another reaction here. Directly below, I have one more area at 7401 to keep an eye out — it is kind of a little buffer that came from an ETH daily chart.
Actionable Setup: Buy Setup: This is a real reaction zone. If we reclaim 7412, we will more than likely squeeze significantly hard. That reclaim is the trigger — do not anticipate it, but be ready for it, because the squeeze off this level has real fuel behind it.
Warning: We are extremely bearish underneath 7413.50 and the 7412 weekly. Below this shelf, things shift greatly to the downside.
The Reset Leg End: 7376.25 - 7380.00
7380.00 (Leg End — Technically Reset & Untested), 7376.25 (Four-Hour).
Context: The leg end at 7380 is technically reset and untested once again, and it has a four-hour at 7376.25 right with it. I do believe this area could get a reaction. It is not my favorite area, but it is certainly a spot that could potentially play.
Actionable Setup: Conditional Long: Keep an eye on this area for a bounce. Watch the reaction, and remember the 7412 reclaim above is what turns a bounce into a real squeeze.
Warning: If they push below the 7376.25 four-hour, we will come much lower and retest the ultimate lows below.
The Ultimate Lows: 7336.00
7336.00 (Ultimate Lows — Liquidity Retest).
Context: Below 7376.25, we come down to retest those ultimate lows at 7336, just to see if there is some liquidity down here. This is by far not my favorite spot — and as much as I do think it could get a reaction, since it is the same spot we talked about on SPX, I would just be very cautious here.
Actionable Setup: Short Target: Ultimately use 7336 as a short target rather than a conviction long. It could pop back up and play the 7380-ish area for a final target, but do not build a thesis around it holding.
The Deep Target: 7313.75
7313.75 (Weekly Value Area Low), plus the 100-Day Moving Average.
Context: I did not even mark much lower than this, because we were ultimately targeting this weekly value area low at 7313.75 as one of our major lows, and we talked about coming all the way down to the 100-day moving average last week.
Actionable Setup: This is the structural deep target for the full downside scenario. We will discuss it in more detail as we get closer to these lows, if it does in fact happen when the time comes.
📌 Cheat Sheet – Key Levels Recap
🧠 Final Thoughts
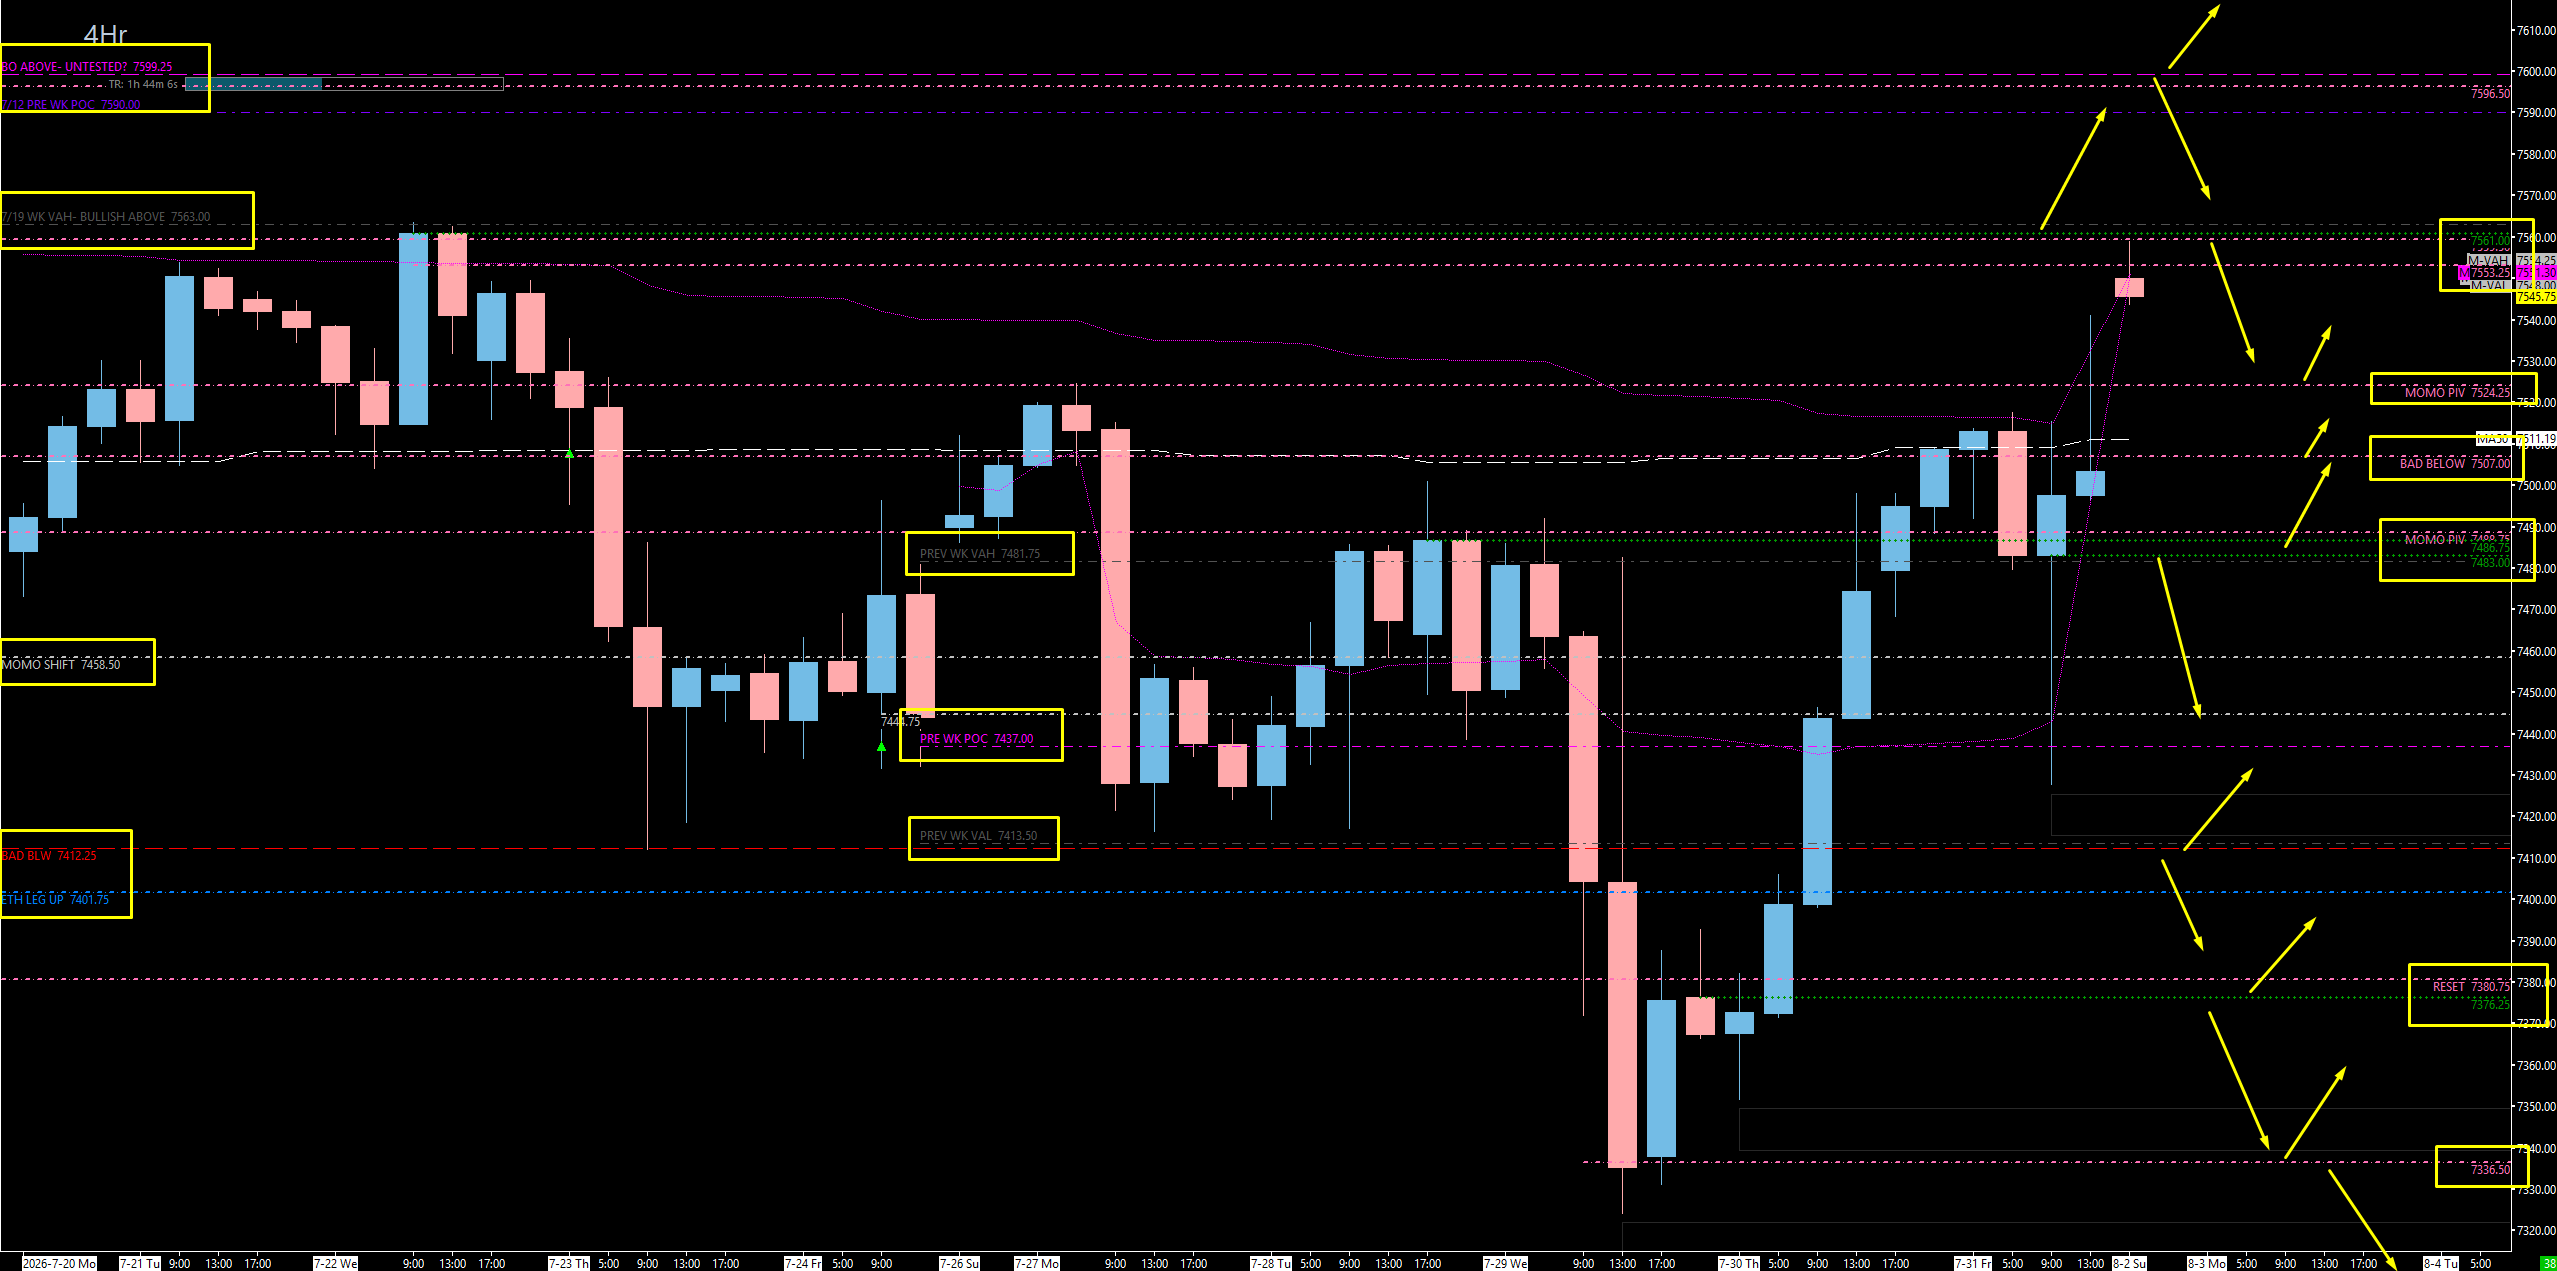
We kept this one nitty gritty — SPX, VIX, and ES, all refined — and we know exactly where things go bad. On SPX, we have that weekly and four-hour/daily area with the weekly as the main above/below spot. And on ES, we have that Previous Weekly Value Area High at 7481.75 holding the confluence for all those four-hours and the daily. That either holds and we pop back up, or we shift momentum back down and could potentially come much, much lower. That is the whole week in one sentence.
Above, the picture is equally clean. Above 7563 we are very bullish, and that opens the door to the 7596.50 / 7599.25 monster — the last and highest untested high-timeframe marker before all-time highs. If that plays, expect the pullback into 7563 as the final, and then let price decide whether we roll back under 7560 or hold and traverse into new highs above 7648. On the downside, the three supports to work are 7524, 7507, and the 7481.75 - 7488.75 confluence — and remember, below that confluence there is no untested support at all until 7380. The 7412 weekly is the one to watch on any flush, because a reclaim there will more than likely squeeze us significantly hard. Keep VIX front and center: we broke the 16.20 floor on Friday, we are eyeing the 15.03 / 14.95 last untested area with a likely pop out of the $15 handle, and 17.44 remains the line that is inherently bearish for the indices.
Now that we are starting to regain on timeframes and VIX is way down in the dumps, the market obviously has another little lift to it. We will wait and see what happens coming into Monday with the gamma regime — that will be very interesting. And do not forget to grab the free SPX Morning Brief so you are fully prepared before the bell every single morning.
I appreciate you all joining me. I will be there Monday for the post-market breakdown at 5 p.m., and then of course you get your trade plan first thing Tuesday morning at 8:30. For my peeps in the Inner Circle — I cannot wait to crush the market with you guys tomorrow. Enjoy your Sunday, and tomorrow we conquer the markets.
Until next time—trade smart, stay prepared, and together we will conquer these markets!
Ryan Bailey, VICI Trading Solutions.
📊 TradingView Indicator String
Copy and paste the levels below into your S&P Edge Levels indicator to automatically plot today’s key levels on your chart:
7628.00|Tested D|TD
7599.25|WK|W
7596.50|D|D
7561.00|4HR|4H
7524.00|D|D
7488.75|D|D
7486.75|4HR|4H
7483.00|4HR|4H
7481.75|P.W. VAH|GD
7413.50|P.W. VAL|GD
7412.00|Tested WK|TW
7401.00|D|D
7376.25|4HR|4H


