

Welcome back, everybody — the eagle has landed. I apologize for getting this out to you so late tonight; I was coming back from Universal Studios in Orlando. Highly recommended — pass some accounts, get funded, get paid, save some schmeckles, and go to Epic Universe, . You won’t be disappointed, even as an adult. Great time had by all. Now let’s get right into the Weekend Review.
We had some geopolitical news over the weekend — Trump and Iran were not able to make a deal. Big surprise. We kind of figured the market would gap down, and as I put out in the Bitcoin post a couple hours before the market opened, Bitcoin was down about 2%, which is always a precursor to what is going to happen for us. With that being said, we have actually fallen into some good support, and this could present a really nice buying opportunity here. We are still very much traversing this area, and we are in a very important spot right now. It really could go higher from here — but if we push lower than the support we are sitting at this evening, it could come much, much lower. Let me lay it out for you.


A Note on This Week’s Market:
News: The Trump/Iran deal falling through is the dominant headline. Bitcoin dropped approximately 2% ahead of the Sunday open, foreshadowing the gap down. Continue to monitor geopolitical developments closely as this remains the primary catalyst for directional moves.
Range: The overnight session has gapped us down directly into our massive Monthly at 6857.25. This is a very tight, coiled spot, and the market is going to have to make a decision from here.
Gamma: The geopolitical gap down has shifted the dealer hedging dynamic. We are back at the level that has defined the entire battle between bulls and bears for weeks. Anything can happen from here.
Trend: This is the critical question. We gained on the Daily and four-hour timeframes last week, and the weekly close cemented that move. However, the gap down has brought us right back to the level where all of that is being retested. Above 6857.25, the bullish structure remains intact. Below, we could come much, much lower.
🧠 Current Market Context
The Triple Distribution & The 6857.25 Retest
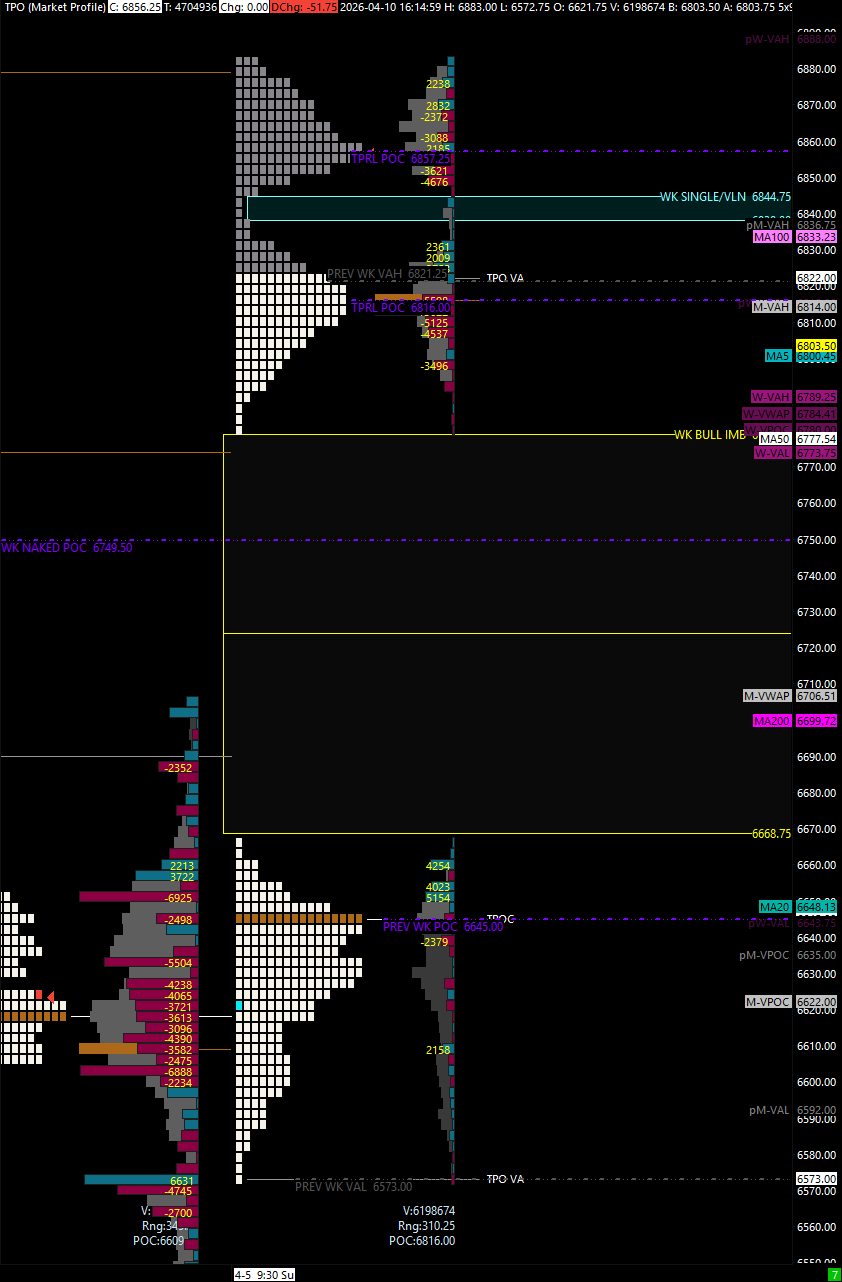
Last week was insane. We had a triple distribution on the weekly TPO profile — I don’t know when the last time I’ve seen one of those. We drew three separate points of control: one at 6816.00, another at 6857.25, and the final one down at 6645.00. The Previous Weekly VAH sits at 6821.00, and there is a low volume node with singles between the distributions that still needs to get filled in. This profile sets us up for a squeeze if we push back up into this area — we could fill that low volume node and come up into 6844.00 to reject, which is dangerously close to our Monthly at 6857.25.
And speaking of 6857.25 — my lord, the confluence. We have played this level until we are blue in the face, and it is going to be important again. The gap down tonight brought us right back to it. This level is now untested once more after the gap, and it sits as the triple POC from the weekly profile. The real question is: do they push above it and continue the trend to the upside, or is this the retest for a move back lower? Because technically, the leg up is tested — we could come down hard. Or they simply push above right now and we continue our trend higher. This is a monster level and will determine everything for us this week.
From a daily structure perspective, we have the main leg down with sub-legs, and we have been walking back up — reclaiming dailies one by one. As long as we are getting back above the shoulders and the dailies at 6772.75 and 6799.75, we are walking up. The fact that we fell down, played support, and are starting to reclaim leads me to believe we have a strong possibility of at least filling the gap from Friday.
🚨 VIX Analysis: The 20.78 Weekly Tiebreaker
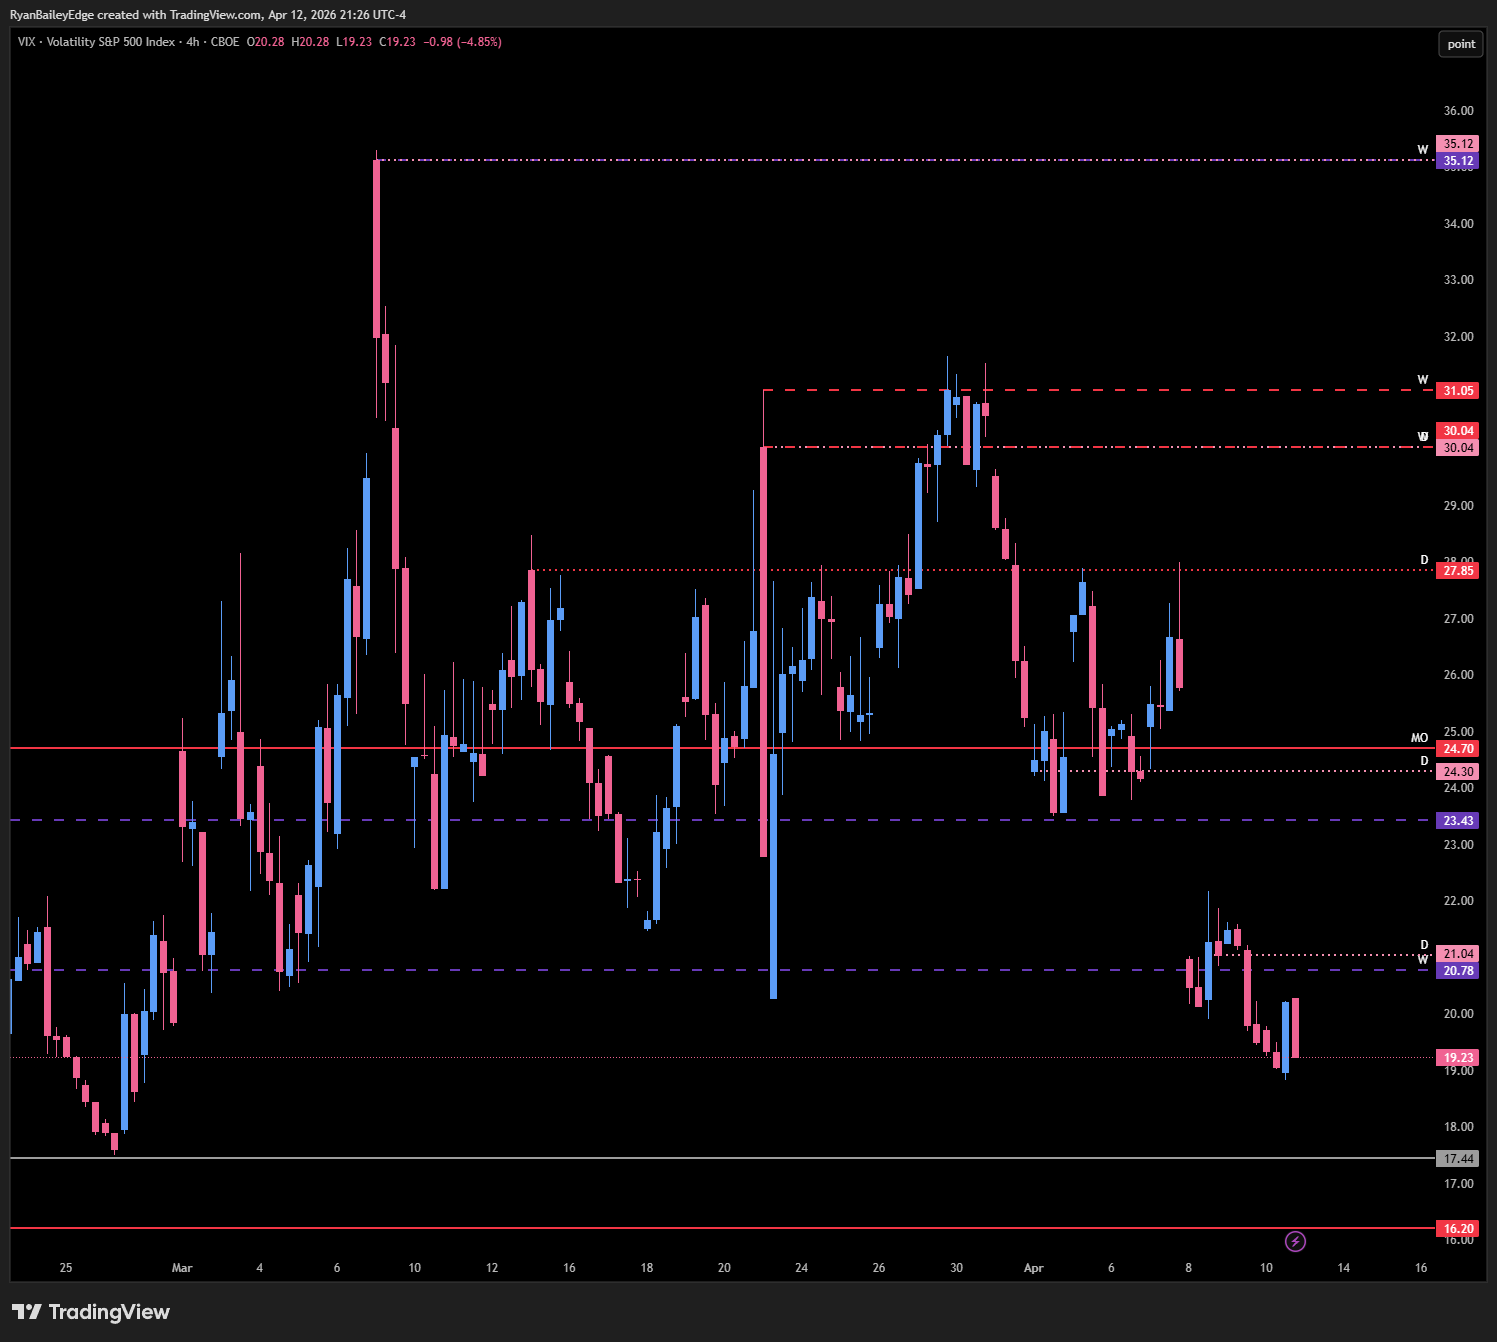
VIX was once again suppressed heading into the weekend and sat below our significant 20.78 Weekly. However, with the gap down tonight, we will more than likely have gapped up on VIX. The 20.78 Weekly and 21.04 Daily are going to be our big tiebreaker — this is the line in the sand.
The Suppression Scenario: As long as VIX stays below the 20.78 Weekly, we have a strong possibility of coming down into the 17.44 Monthly and potentially lower into the Monthly at 16.20 — this is the lowest resistance I have in the VIX that we could potentially see. These are extremely large and significant areas, so look for potential reaction if VIX reaches them.
The Headwind Scenario: If VIX pushes above the 21.04 Daily, we start to fill the gap into overhead resistance. Our untested Weekly sits at 23.43, the untested Daily at 24.30, and ultimately our massive Monthly pivot at 24.70. This will more than likely be the ceiling for VIX as these levels are extremely significant and I would expect VIX to remain below them. The market has memory, and so do we — above 24.70, we have nothing untested until the 30s, and you know what happens when we get above this Monthly. It pushes the ES down hardcore.
The Barometer: Use the 20.78 Weekly as your primary barometer this week. Below = suppressed VIX, tailwind on the indices. Above 21.04 = headwind building. This is a clean, easy line in the sand for you to monitor progression.
🎯 Detailed Actionable Trade Plan (ES Futures)
The plan this week comes down to one massive level: the Monthly at 6857.25. Above this, the bullish structure from last week remains intact and we continue to push higher. Below this, we could retest lower and start to fill in the gap. Our progression pivot is the tested four-hour at 6806.25 — as long as we push above this level, we will continue into areas of resistance. Below 6769.00, things break down and we come into our prime buying zone at 6749.25. Right now, as we sit Sunday evening, we are pushing back up and have already played support at 6772.75 — this is encouraging.
🔴 Key Resistance Zones & Upside Targets
The Monthly Retest / Triple POC: 6857.25
6857.25 (Monthly / Triple POC / Now Untested).
Context: This is the level. We have played it until we are blue in the face. The gap down tonight brought us right back to it and it is now untested once again. The weekly triple POC confluence makes this an absolute monster. Above this level, the bullish structure from last week is intact and we continue our trend to the upside.
Actionable Setup: If price pushes above 6857.25 and accepts, this shifts momentum back in favor of the bulls. Look for continuation higher into the Weekly at 6883.00. If price rejects here, this was the retest and we could come down hard.
The Weekly / Low Volume Fill: 6883.00
6883.00 (Weekly).
Context: If we clear the Monthly at 6857.25, our next significant level is this Weekly. The low volume node from the triple distribution profile would also be filling in through this area.
Actionable Setup: If we push above 6883.00, our main leg target becomes the untested four-hour at 6951.00 and ultimately the highest untested Daily at 6961.75. These are massive levels from the leg down and will provide an extreme reaction.
The Massive Untested Leg Levels: 6951.00 - 6961.75
6961.75 (Highest Untested Daily), 6951.00 (Massive Untested 4-Hour).
Context: This is way higher right now, but this is where we are heading if the bulls maintain control. The untested four-hour at 6951.00 is from the huge leg down — this thing is massive and will provide an extreme reaction. Above 6883.00, these become our targets.
Actionable Setup: Short Setup: If price reaches this area, expect a significant reaction. This would be the first area where a short becomes viable this week.
🔵 Key Support Zones & Setups
The Progression Pivot: 6806.25
6806.25 (Tested 4-Hour).
Context: You all remember this level from last week — I am almost sure everyone in the room made money off of it. As long as we push above 6806.25, we will continue into areas of resistance. We damn near hit it tonight as we pushed up from the gap down.
Actionable Setup: If we open tomorrow above 6806.25, we want to get long. Above this, we target 6825.75 and 6834.00, filling in the low volume node and pushing toward the Monthly at 6857.25.
The 4-Hour Resistance Fill: 6825.75 - 6834.00
6825.75 (4-Hour), 6834.00 (4-Hour / 100-Day Moving Average).
Context: These are the levels we will encounter as we push above 6806.25. The 100-day moving average also sits at 6834.00, which adds an additional layer of confluence as these high-timeframe moving averages are monitored by hedge funds and CTAs. This is a big hurdle — a push above this area sends us toward the Previous Weekly VAH at 6821.00 and into the Monthly at 6857.25.
Actionable Setup: If price pushes above 6806.25, watch for progression through these levels. Above 6834.00 is a significant statement that the bulls are in control.
The Tested Daily / Walk-Up Structure: 6799.75
6799.75 (Tested Daily).
Context: This is the Daily I got long above tonight and brought it up from there. If they push above this tomorrow, there is not a whole lot of resistance above and we can come all the way up. This is the daily structure walk-up level — above it, we are progressing higher.
Actionable Setup: Buy Setup: If we open near this level, getting long above 6799.75 is a strong play for a push into 6806.25 and higher.
The Shoulder / Gap Down Support: 6772.75
6772.75 (Tested Daily / Shoulder).
Context: This is the shoulder in the daily leg structure, and this is what we played tonight. Price came down in the gap and bounced right off this level. Below 6772.75, we spin off to the downside and our first real support is the prime buying zone at 6749.25.
Actionable Setup: As long as we hold above 6772.75, the structure remains intact. A push below this opens the door to significantly lower levels.
Warning: Below 6772.75 with conviction, we lose the daily walk-up structure and things accelerate to the downside quickly.
The 4-Hour Break Level: 6769.00
6769.00 (4-Hour).
Context: If they get below 6769.00, we are going to come down and grab the prime buying zone below. This is the level that separates the current support structure from a deeper pullback.
Actionable Setup: A push below 6769.00 targets 6749.25 directly.
The Prime Buying Zone: 6749.25 - 6749.50
6749.25 (4-Hour), 6749.50 (Naked Weekly POC).
Context: This is a fantastic level. There is a naked point of control here, a big February swing low, and a swing pivot high — there are a lot of reasons to like this spot. I actually really want to buy here if we come down to it. It played perfectly from the bottom up previously.
Actionable Setup: Buy Setup: Look for this area to play and get back above 6769.00 for confirmation, ultimately continuation above the dailies at 6772.75 and 6787.75. A successful reclaim could squeeze much higher.
Warning: If they push below 6749.50, our first target is the half gap at approximately 6725.00 — half gaps have a tendency to play. Below that, the Weekly at 6706.00 becomes our next significant support.
The Sweep Setup: 6761.00
6761.00 (Weekly / September ATH Leg Down).
Context: If they pull back into tomorrow’s cash session, what I would be looking for is a sweep into 6761.00 — this is the September all-time high leg down Weekly. A sweep into this level and a reclaim back above 6769.00, ultimately getting back above the dailies at 6772.75 and 6787.75, could produce a significant move higher.
Actionable Setup: Sweep Setup: Look for a sweep into 6761.00, get back above 6769.00 with conviction. If this level plays and we reclaim, this thing just continues to rock on.
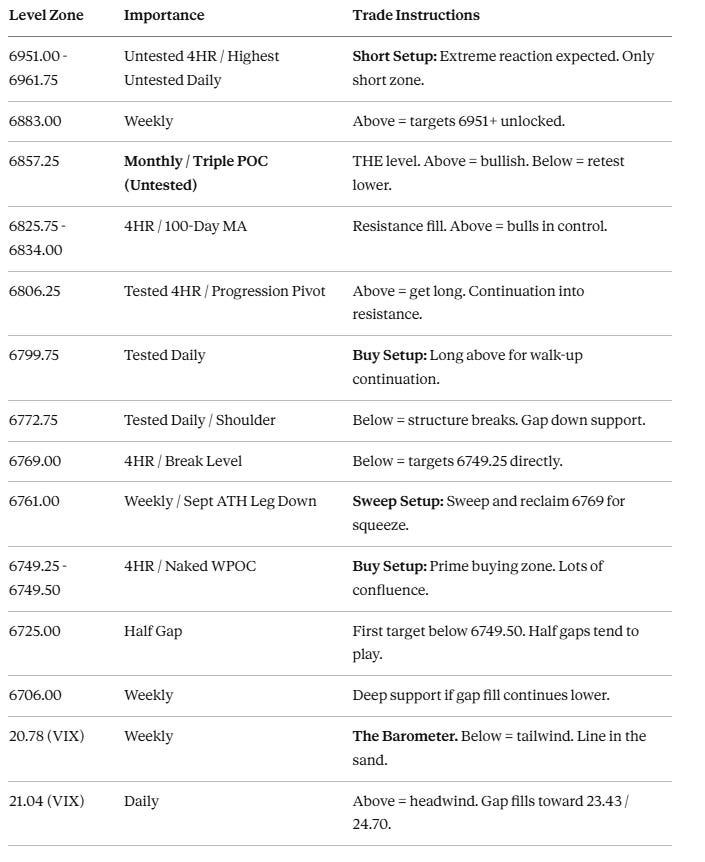
📌 Cheat Sheet – Key Levels Recap
🧠 Final Thoughts
The plan coming into this week is very clear. We are sitting at the most important level on the board — the Monthly at 6857.25. The gap down tonight on the Trump/Iran news brought us right back to it, and this level is now untested once again with the triple POC confluence from last week’s wild profile. Above 6857.25, the bullish structure from last week is intact and we continue to push higher. Below it, we could come down hard and fill the gap.
The encouraging sign is that we have already played support tonight at 6772.75 and are starting to push back up — as I write this, price is already back near 6806.00. The daily structure walk-up remains intact as long as we keep getting back above these dailies. My bias is that we have a strong possibility of at least filling the gap from Friday, but it is really going to come down to whether they hold the support and continue to reclaim. Use the 6806.25 tested four-hour as your progression pivot — above it, we are heading higher. And keep an eye on VIX with the 20.78 Weekly as your clean line in the sand. Be patient, let the setups prove themselves, and together we conquer the markets.
Until next time—trade smart, stay prepared, and together we will conquer these markets!
Ryan Bailey, VICI Trading Solutions.
📊 TradingView Indicator String
Copy and paste the levels below into your S&P Edge Levels indicator to automatically plot today’s key levels on your chart:
6961.75|D|D
6951.00|4HR|4H
6883.00|WK|W
6857.25|MO|M
6834.00|4HR|4H
6825.75|4HR|4H
6821.00|P.W. VAH|GD
6806.25|Tested 4HR|T4
6799.75|Tested D|TD
6772.75|Tested D|TD
6769.00|4HR|4H
6761.00|WK|W
6749.25|4HR|4H
6706.00|WK|W