

Happy Sunday everyone, and welcome back to another Weekend Review. We come off another incredible week in the trade plans — three absolutely spectacular days that proved once again that patience pays. Anyone who was a subscriber and in the Discord room was leaning into massive profits this week. Congratulations to everyone who took advantage. We even had an awesome day on Free Alpha Friday where we caught the long off of 7420 to the tick, paid well over 40 points just to end the session, giving us well over 100 points on multiple contracts for the day. We did the whole thing live on stream in front of everybody, closing out another solid week. It was another banger — and we are going to do it again this week. Let’s get right into it. I am going to run from the top: VIX, SPX, then ES. Short and sweet so you can get into the rest of your Sunday.
📧 IMPORTANT — Please Check Your Spam Folder I have been sending out follow-ups and touch-ups to all subscribers as well as everyone signed up for the SPX Edge AM Brief. I can clearly see that many of these emails are not being opened — they are getting stuck in spam folders. Please take 30 seconds to check your spam/junk folder for emails from rbailey@vicitradingsolutions.com and info@vicitradingsolutions.com. Mark them as “Not Spam” and add them to your contacts so you continue to receive them in your inbox going forward. There is valuable information in those emails — daily plan notifications, brief updates, webinar reminders, and trade follow-ups — and I want to make sure you are actually getting them. Take the moment, do it now, and you will thank yourself this week.
A Note on This Week’s Market:
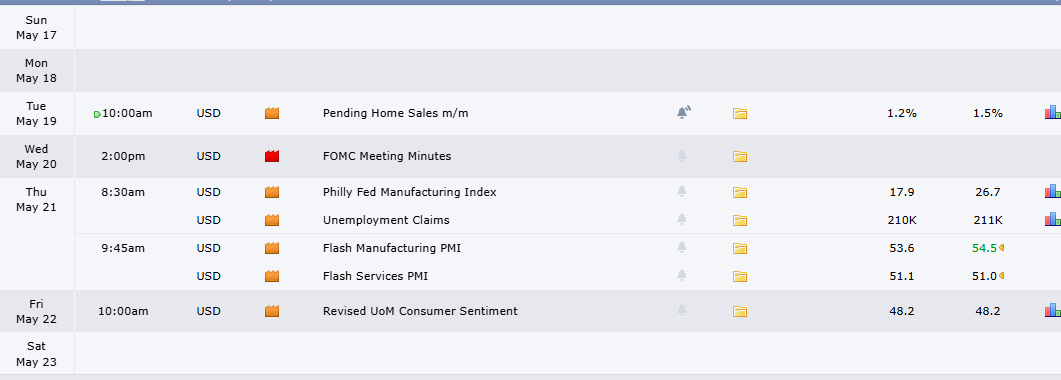
News: No specific Red Tag events on the radar heading into the week. Continue to monitor for any geopolitical developments over the weekend that could create gaps or shake the open — anything can happen in the overnight session, especially with the structural setup we are sitting in.
Range: We just printed a poor low on the weekly TPO based on market efficiency, which structurally suggests we may need to come a little lower to round it out. We also flagged massive MACD/RSI divergence all the way up through the rally to the highs, and right now divergence is pointing us down. The weekly profile has a serious inefficiency to the downside that ultimately needs to get cleaned up.
Structure: We have officially closed below the four-hour support that took us to the all-time high. That is a meaningful technical shift for the near-term picture — formerly support is now resistance, and our immediate target on a rotation lower is the 7400 area on ES. The near-term lean is rotation lower before the next leg up.
Trend: Still 100% bullish on the higher timeframe. This market is absolutely pointed to the upside, and even hundreds and hundreds of points of pullback would not change the bigger structural picture. We are not calling a top — we are setting up the buy zones for the next leg.

🧠 Current Market Context
The 4-Hour Break & The Rotation Lower Setup
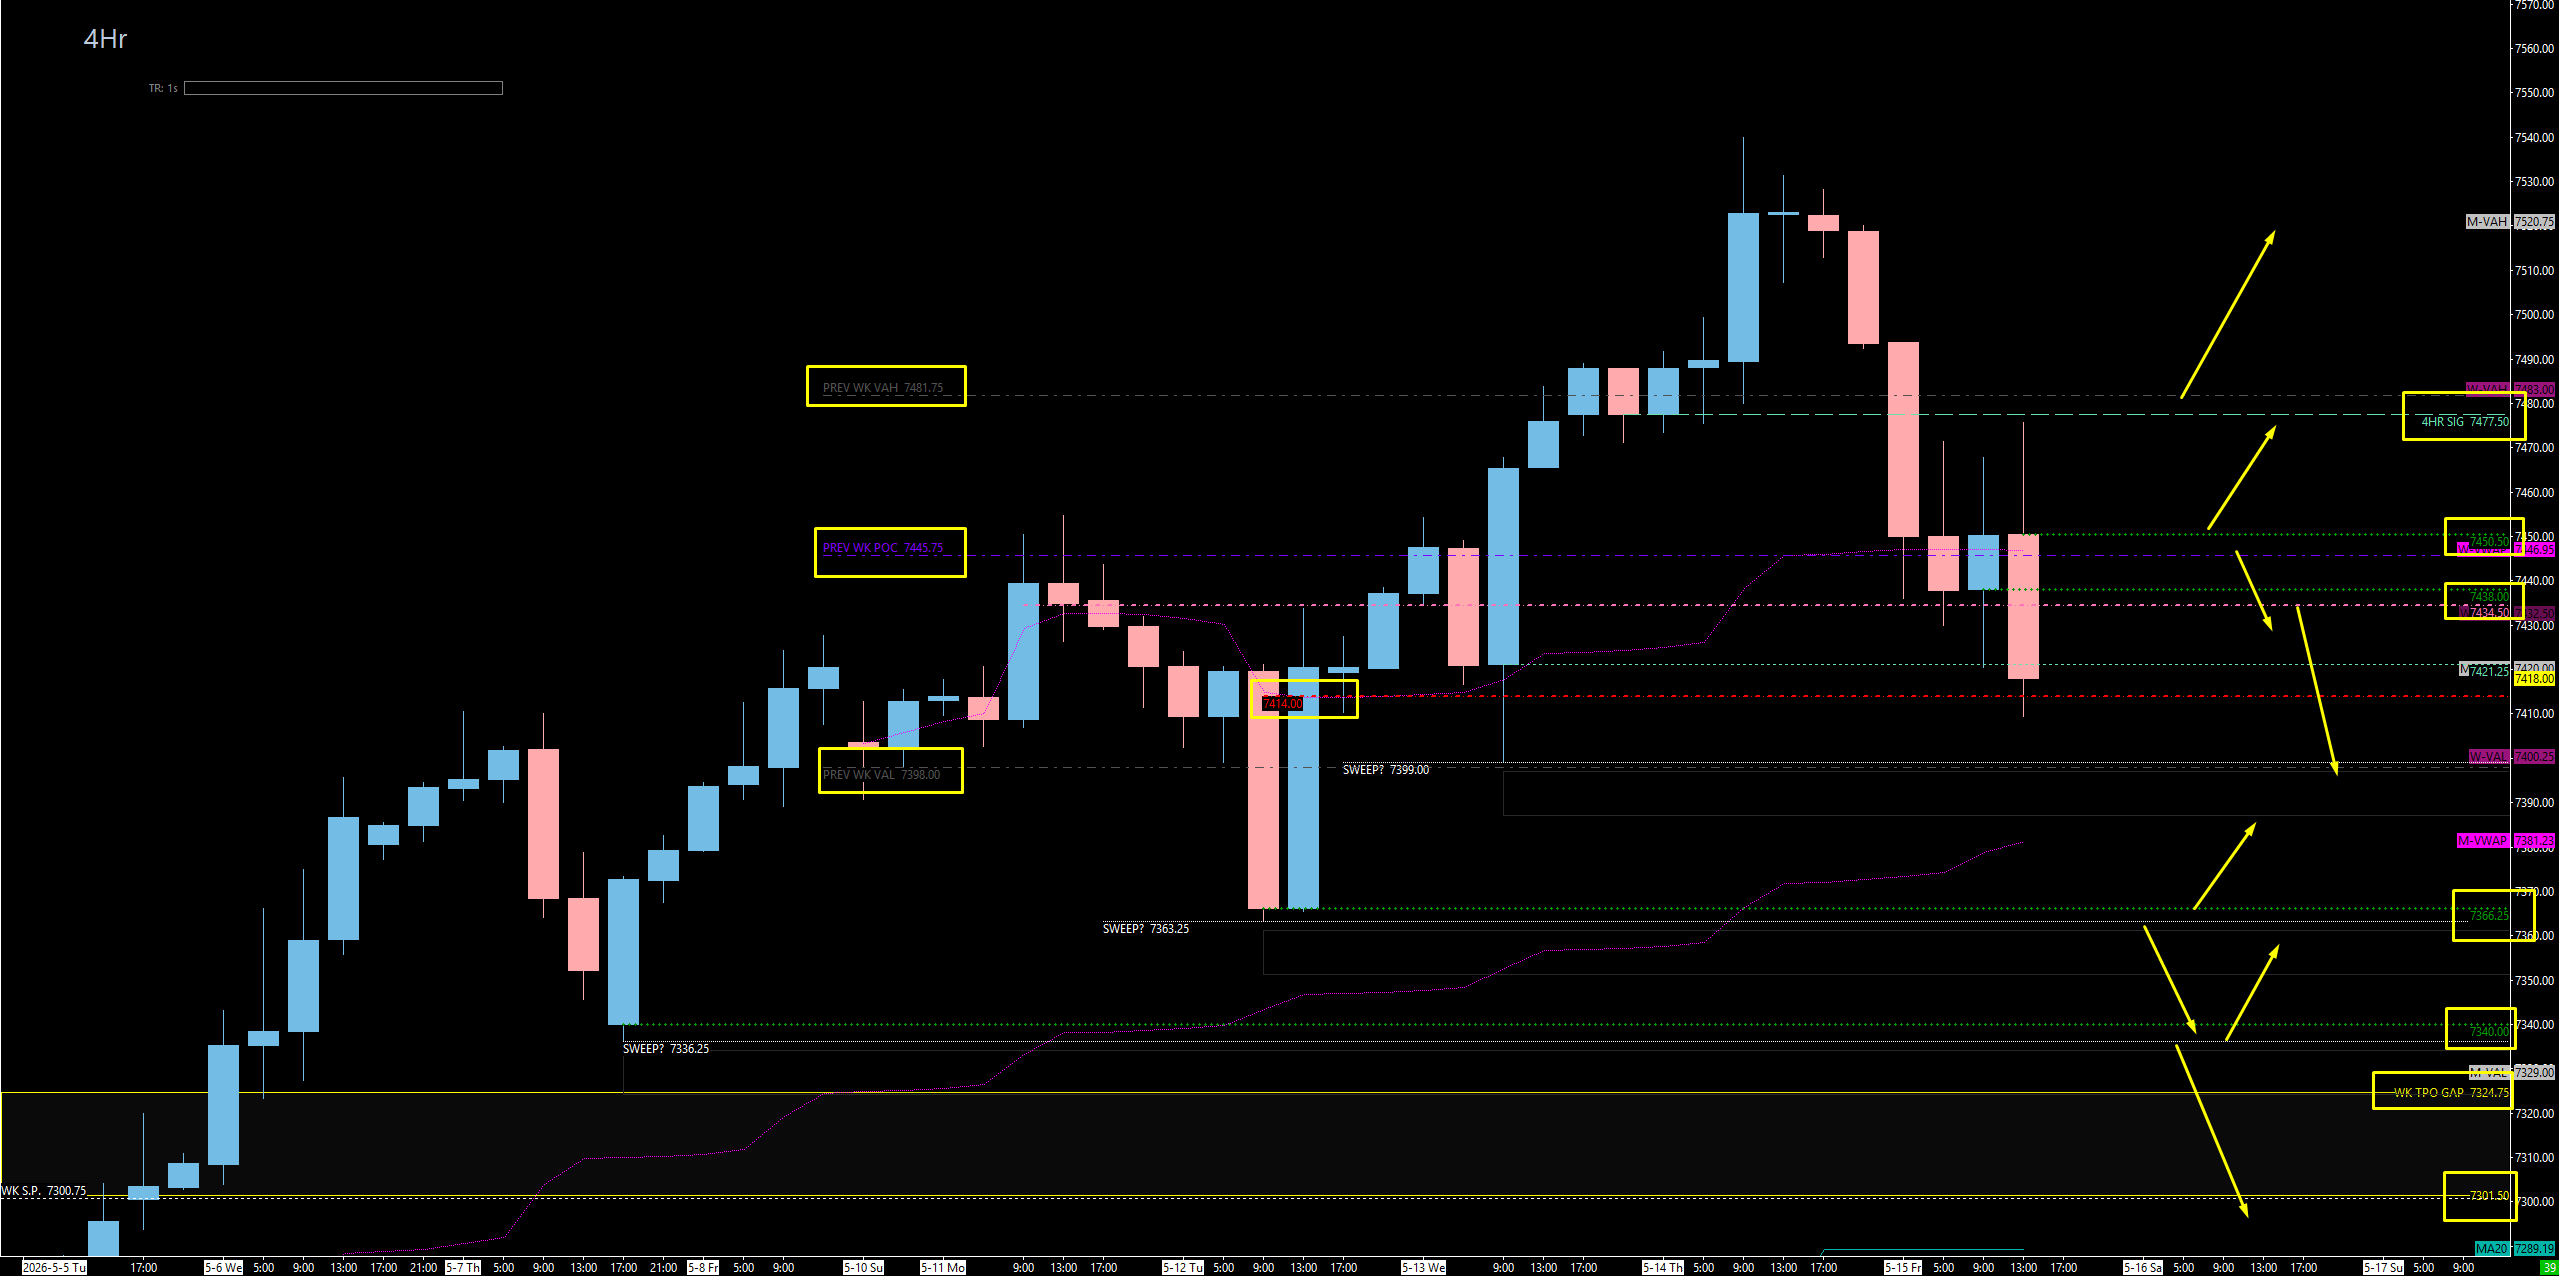
We come into the week of May 18th sitting just below the four-hour support that took us into the all-time high. That four-hour at 7477 played as support on the way up and is now functioning as resistance on the way down — a textbook flip that I have talked about a hundred times. What was formerly support becomes resistance when you are back underneath it. On the weekly TPO, above 7481 (the Previous Weekly Value Area High) we are cleared for takeoff and rediscover all-time highs. Below that, the Weekly Point of Control at 7445 is our big decision point — and below 7398, we continue lower into the inefficiencies. The cleanest reading of the profile right now: above value, breakout; below value, breakdown; and the POC is the middle decision point. The interesting part is that we have specific structural levels coinciding with each of these — which is what ties it all together.
On SPX, last week we called out the massive spot at 7334 as the weekly leg end into the all-time high. We knelt down into it perfectly and blasted off into a new ATH exactly as predicted last Sunday — and now we are right back in that important area. The only untested area of support right now lies at 7358.93, and we have a small-timeframe area at the 7390 untested 1-Hour. The static Daily at 7390.63 is the level we want to monitor for above or below intraday. To the upside, we have a massive gap fill all the way up to the 7501 untested Daily, with resistance on the way at the 7435 4-Hour midpoint pivot and the 7449/7450 1-Hour. A pop above 7435 could continue higher, and above the 7449/7450 1-Hour we should rediscover all-time highs. If we break below the 7358 support — and ultimately the 7334 weekly leg end — that sends us down well over another 100 points into the 7234.50 Daily and the 7200 spot we have been discussing for weeks. 7200 is a gap fill with a 4-Hour level right there, and if we play it and reclaim 7234, we know we will pursue back up to the last untested resistance at 7334. If SPX comes down into the 7200 area, that is when VIX gets the pop we are anticipating.
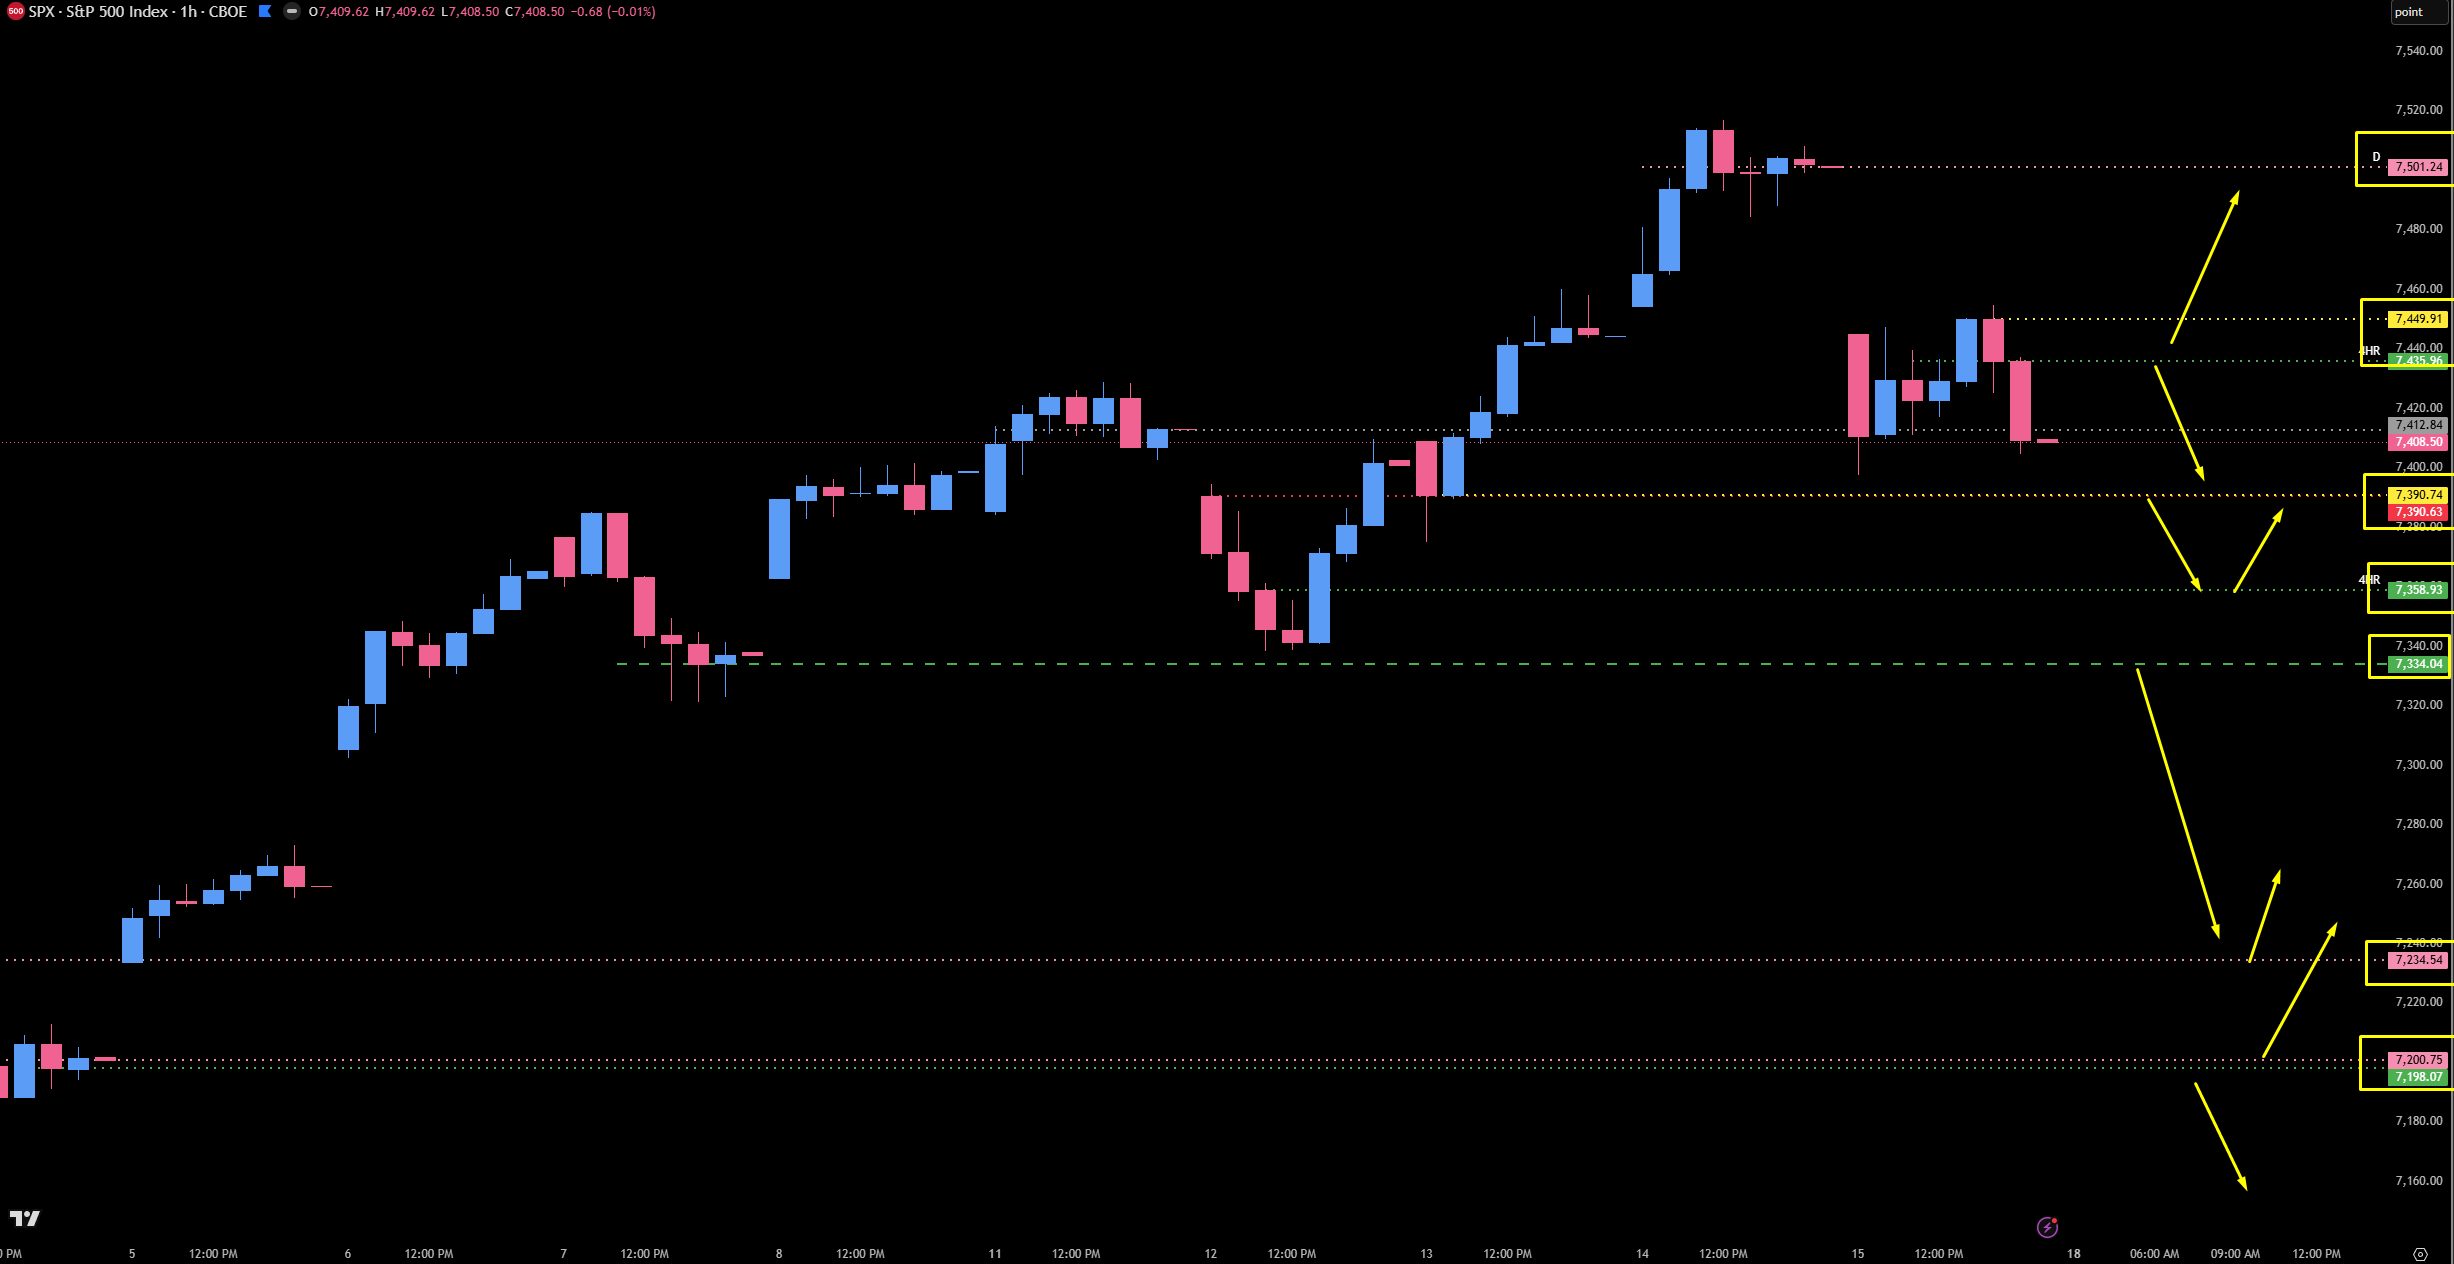
The key piece of confluence I want everyone to internalize: the 7366.25 spot on ES lines up almost perfectly with the 7358.93 level on SPX. Based on the structure, this is the same thing. Watch SPX when it comes into this spot relative to where ES is — that gives you a lot more confluence on whether that level pays. Without over-embellishing or taking it too far, I think we are going to get a little rotation lower. We know where it all goes bad if it does not: above 7450 on ES, and above 7477, we push higher. Below that, we go to work on the long buy zones.
🚨 VIX Analysis: The 19.42 Daily Ceiling
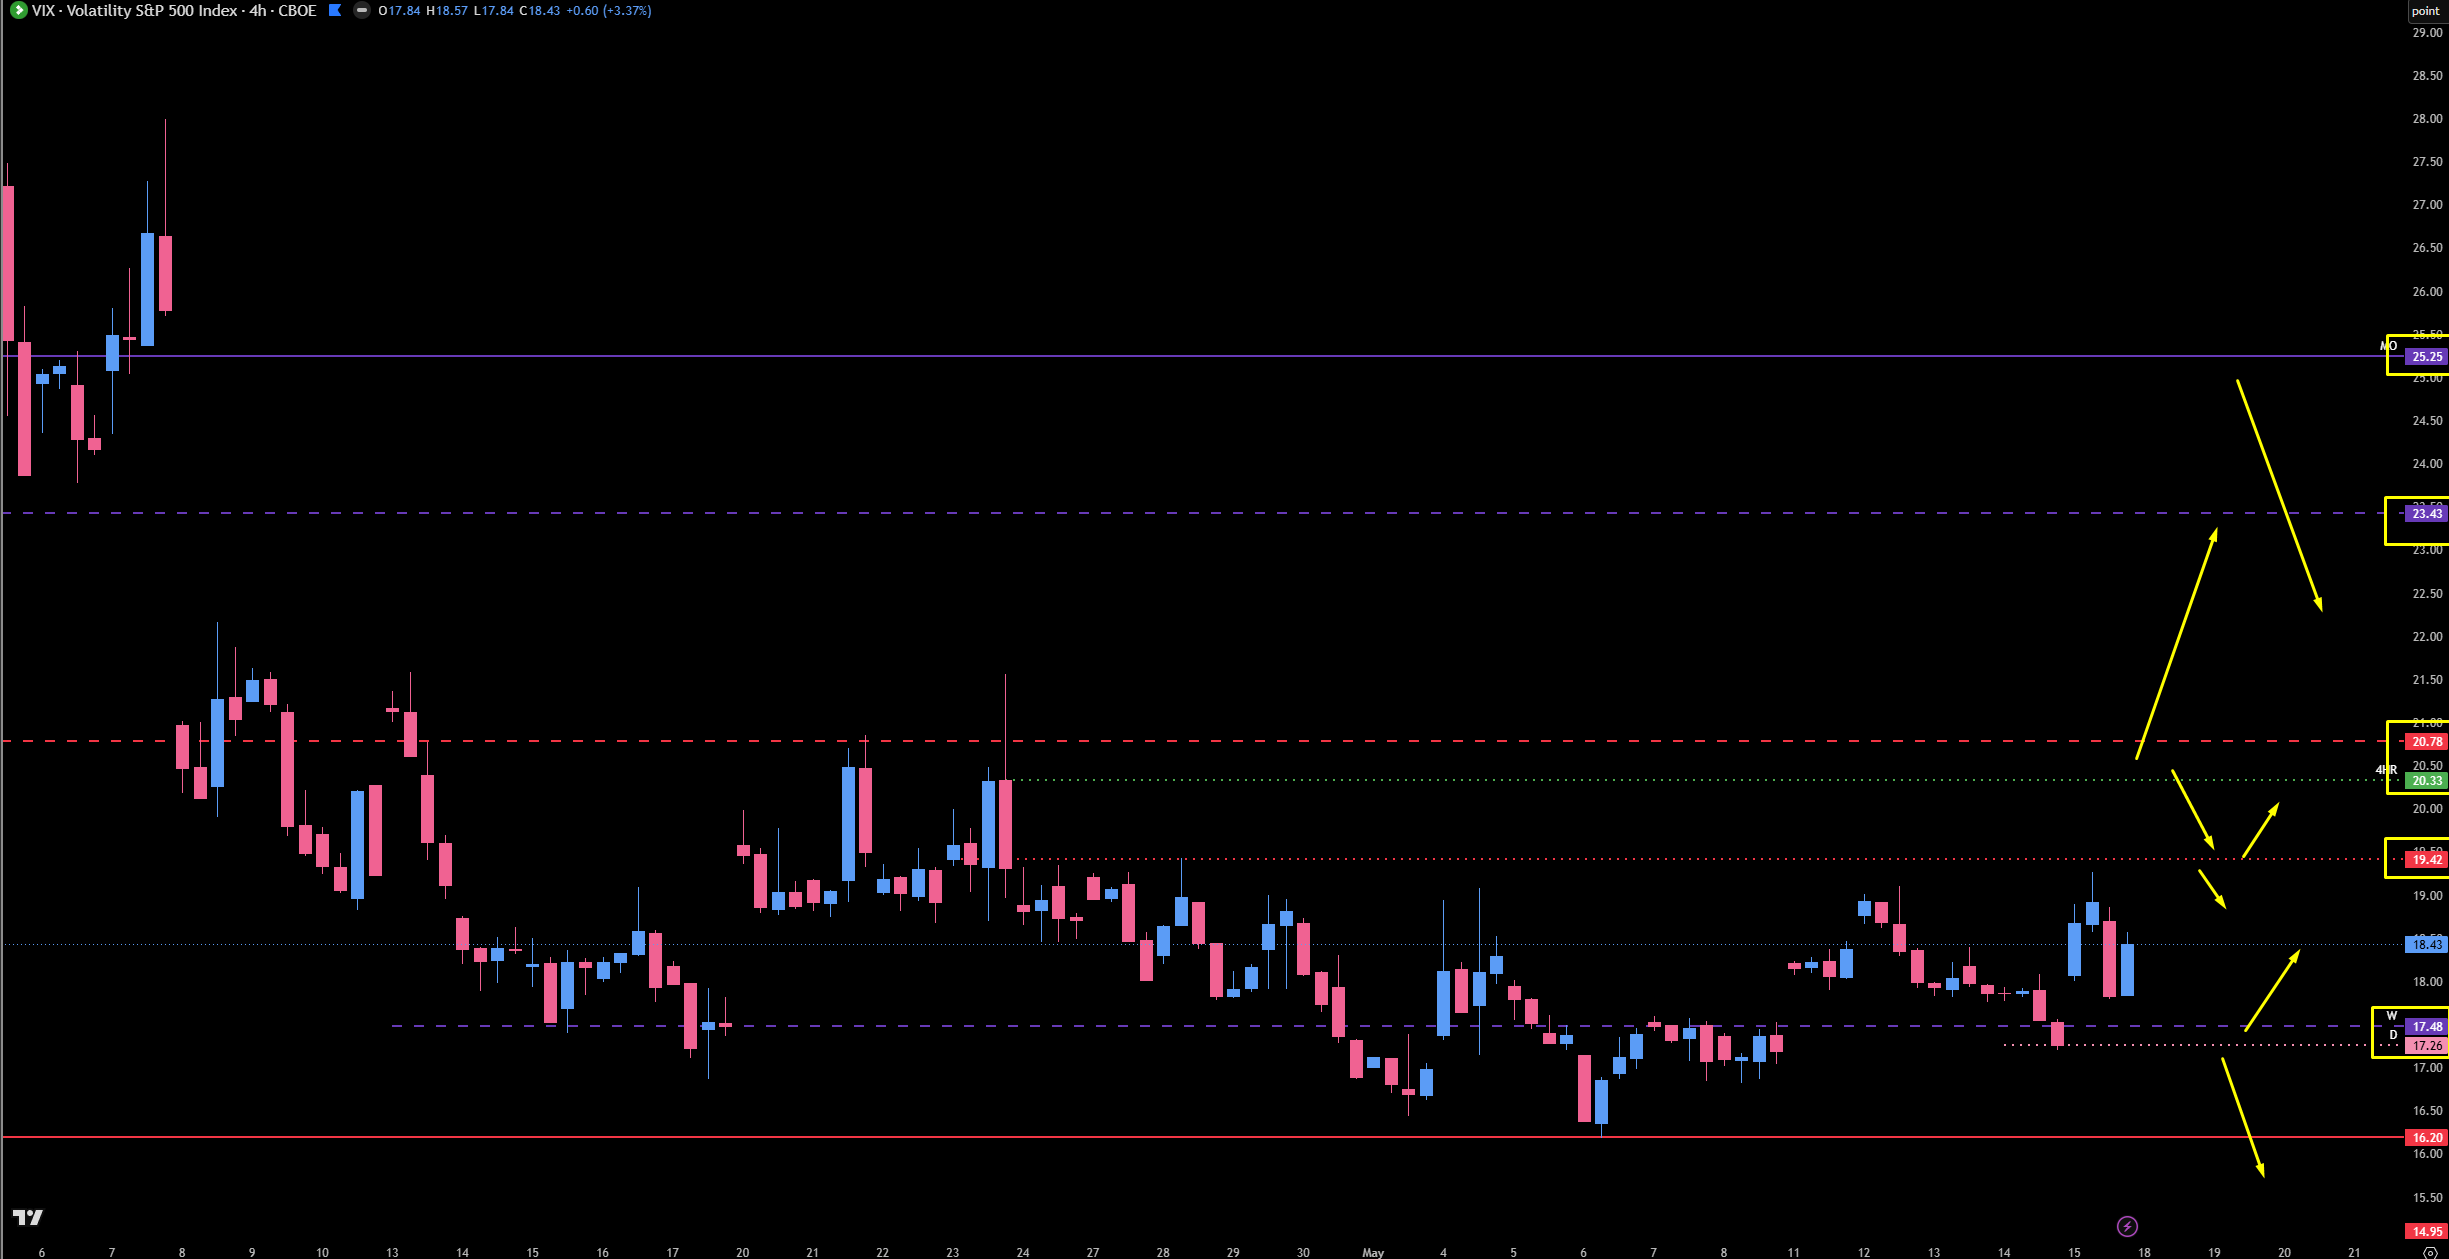
VIX is still fairly suppressed. We have been accumulating sideways down here, holding the 16.20 Monthly fairly well — and the chart looks like it is prepping for a potential pop based on the basing structure. I am not making price predictions, but the setup is what it is, and I am being upfront that I do anticipate VIX higher based on what we are looking at. That said, it does not have to — and there is one specific spot on the indices that determines everything.
The Untested Support Zone: 17.48 to 17.26 (Untested Area). This is the one untested area down here as we move sideways. If this zone holds, we could come higher again. Beneath 17.26, VIX comes down pretty rapidly into a retest of the 16.20 Monthly.
The Ceiling: 19.42 (Daily). This has been our significant ceiling for some time. As long as VIX stays below 19.42, the indices have room to drift higher without volatility headwinds. A push above 19.42 would take us into the untested 4-Hour at 20.33 — but that alone would not send things cascading lower.
The Real Inflection: 20.78 (Weekly). A push above the 20.78 Weekly takes us up into the bigger Weekly and Daily resistance areas above — and that is the big area that will more than likely be the ceiling for some time. If it plays, it should get a pretty solid pullback before relaunching. If SPX breaks 7358/7334 and rotates down toward 7200, VIX will get the pop into this upper zone. That is the cross-reference to keep in mind for the entire week.
🎯 Detailed Actionable Trade Plan (ES Futures)
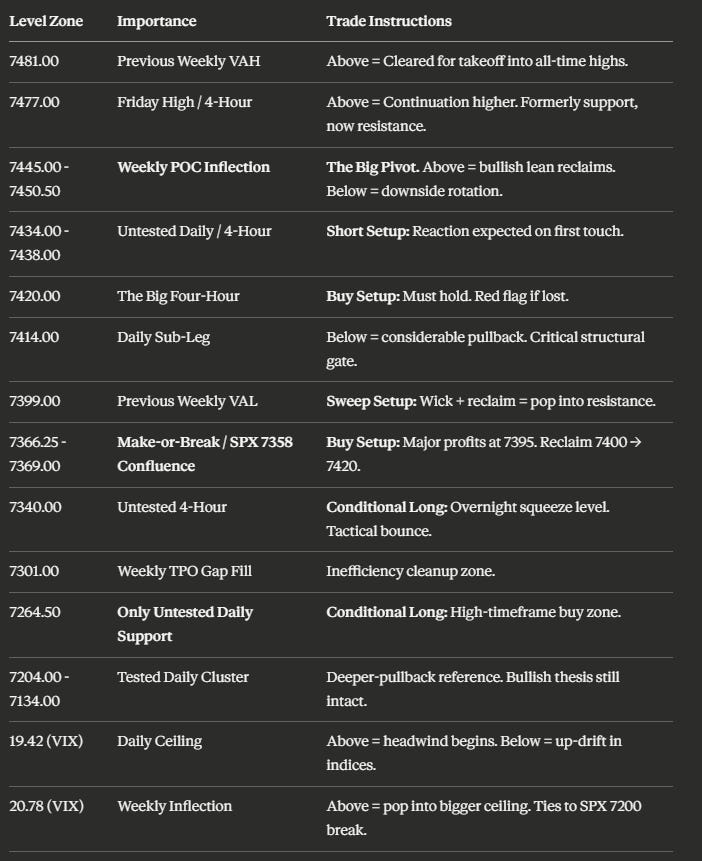
We are playing for a near-term rotation lower with the higher-timeframe bullish thesis fully intact. The major above/below pivot is the 7450.50 4-Hour leg down paired with the 7445 Previous Weekly POC — above that level, the bullish lean reclaims and we push back up; below it, we work toward the downside targets. Above 7477 and ultimately 7481 (Previous Weekly VAH), we are cleared for takeoff back into all-time highs. The make-or-break is 7366.25 — confluence with SPX 7358.93 — and below that, the structural map opens up to deeper pullback zones.
🔴 Key Resistance Zones & Setups
The First Major Resistance: 7434.00 - 7438.00
7438.00 (4-Hour), 7434.00 (Untested Daily).
Context: This is our first major area of resistance on a bounce. The Untested Daily at 7434 paired with the 4-Hour at 7438 creates a clean confluence right above current price. If we pop into this area, expect a reaction.
Actionable Setup: Short Setup: Look for a reaction at 7434 - 7438 on first touch. If price gets rejected here, watch for continuation back down toward the lower support zones. If price accepts above 7438, the next major test is the 7450 inflection right above.
The Major Inflection — Weekly POC Combo: 7445.00 - 7450.50
7450.50 (4-Hour Leg Down), 7445.00 (Previous Weekly POC).
Context: This is the spot for the whole week. The 4-Hour Leg Down at 7450.50 lines up almost perfectly with the Previous Weekly POC at 7445, making this the big inflection point above or below. Everything goes bad above 7450 for the bears — it starts going right back up. This is all tested above, and a reclaim above 7450 essentially opens the door back to all-time highs.
Actionable Setup: Above 7450.50, the bullish lean certainly starts to reclaim in the bull’s favor. We still have to deal with the resistance just above, but the structural picture flips back to the bulls’ side. Below 7450, we continue our downside rotation toward the buy zones.
Warning: This is the single most important pivot for the week. Trading directionally without respecting this level will result in being on the wrong side of the move.
The Friday High Resistance: 7477.00
7477.00 (4-Hour — Friday’s High / Formerly Support).
Context: This is the four-hour level that played impeccably as our resistance into the high on Friday. We talked about it on Thursday as the big make-it-or-break-it that took us to all-time highs, and once we were below it, it became resistance. Textbook flip — formerly support becomes resistance when you are back underneath it.
Actionable Setup: A clean reclaim above 7477 signals the rotation lower is done and we are continuing the drift higher. Below 7477, we maintain the near-term downside lean.
Cleared for Takeoff: 7481.00
7481.00 (Previous Weekly Value Area High).
Context: This is the gray line on the weekly profile — our Previous Weekly Value Area High. Friday’s high was right at this level. Above this, we are cleared for takeoff.
Actionable Setup: A sustained move above 7481 confirms the breakout back into all-time-high territory. Above value area, we break out — clean, simple, structural.
🔵 Key Support Zones & Setups
The Big Four-Hour: 7420.00
7420.00 (4-Hour — Played Multiple Times).
Context: This is the 4-Hour we played about four different times over the course of last week, including the perfect tick long off it on Free Alpha Friday for over 100 points. It is a very important spot. Losing support on 7420 is a big red flag for us going into the new week.
Actionable Setup: Buy Setup: If price holds above 7420 and reclaims, we want to see it get back above 7414 as confirmation, then above 7434, and ultimately above 7450 for the bullish lean to fully reclaim. This is the first support that needs to hold for the bulls.
Warning: A sustained break below 7420 is a structural red flag and shifts the bias toward the deeper pullback targets below.
The Sub-Leg Daily: 7414.00
7414.00 (Tested Daily — Sub-Leg to All-Time High).
Context: This is the daily level that defines the sub-leg up to the all-time high — it is going to be huge for us to hold. Below 7414, we start to come down considerably and could fill the weekly gap all the way down toward 7301 and into the 7264.50 Daily.
Actionable Setup: As long as we stay above 7414, the structural bullish thesis on the daily holds. Watch this level carefully — it is the gate between a healthy rotation and a meaningful pullback.
Warning: Underneath 7414, we could come down considerably. This is the daily-timeframe gate to the deeper inefficiency below.
The Previous Weekly VAL Sweep: 7399.00
7399.00 (Previous Weekly Value Area Low).
Context: This is the previous weekly value area low, and I have it drawn as a potential sweep zone with a question mark. Just poking below this a little bit could give us the anticipation that we pop back up. In fact, they could do this in the overnight session — if we open below this and start to reclaim, that could take us back into some of the resistance areas, and Monday opens right at the spot where we determine what happens next.
Actionable Setup: Sweep Setup: Watch for a wick/sweep below 7399 in the overnight or early Monday session, followed by an immediate reclaim. A reclaim back above the VAL could pop us into the 7414 / 7420 / 7434 resistance ladder. These are assumptions — but the setup is on the radar.
The Make-or-Break Confluence: 7366.25 - 7369.00
7369.00 (1-Hour Support), 7366.25 (4-Hour Next Leg Up) — lines up with SPX 7358.93.
Context: This is the make-or-break for the entire bias. The 7366.25 4-Hour is the next leg up, and the 7369 1-Hour provides clean support back into this spot. Based on the structure I can see, this is the same thing as SPX 7358.93 — when SPX comes into that spot aligned with where ES is at 7366, that confluence tells you whether the spot pays. I kind of like this area despite my earlier hesitation — the only concern is that if we play this, we have to get back above 7400 and ultimately 7420 to confirm.
Actionable Setup: Buy Setup: Look for 7366.25 to play with confirmation from SPX at 7358.93. If the spot plays, I would be looking to take major profits around 7395 on the first push back up. The key reclaim sequence is: get above 7400 → then above 7420 → then engage the upper resistance ladder.
Warning: Losing 7414 and failing to hold 7366.25 is the structural red flag. Below the 7366 area, the structural map opens up to deeper pullback zones — and that is where VIX gets the pop we discussed.
The Overnight Squeeze Level: 7340.00
7340.00 (Untested 4-Hour — Overnight Session Origin).
Context: This 4-Hour was created during the overnight session on the day we gapped down and then squeezed to all-time highs for an insane 75-point run throughout the overnight. It is certainly left untested and worth keeping an eye on. However, the concern is that if this plays, we essentially need to get back up to 7366 and be almost empty at that point — we cannot count on going much higher from there without more confirmation.
Actionable Setup: Conditional Long: If price reaches 7340, treat it as a tactical bounce candidate with a target back into the 7366 area. Tighter risk, faster scalp. Below this, we are heading into the deeper inefficiency.
The Weekly TPO Gap Fill: 7301.00
7301.00 (Weekly TPO Gap / Inefficiency Fill).
Context: Below the recent lows of last week, we have a serious weekly TPO inefficiency that needs to get cleaned up at some point — 7301 is where we would clean the bulk of the gap. Coming down into this area is not the worst thing in the world because it brings us into more untested support that we can play for a long ride right back up.
Actionable Setup: A push into 7301 completes the weekly inefficiency fill and sets up the structural buy into the daily top-down at 7264.50 just below.
The Daily Top-Down Support: 7264.50
7264.50 (Only Untested Daily Support).
Context: This is the only untested daily I have for support if we break the 7414 structure. It is the top-down support of the bigger area and a spot I like very, very well. Given that we have moved up so fast without a real retracement, we have quite a ways to come down before we get to any significant high-timeframe support — and 7264.50 is the first real one.
Actionable Setup: Conditional Long: A pullback into 7264.50 would be the high-timeframe buy zone for the deeper rotation scenario. Look for first-touch reaction and reclaim work above for confirmation. This is the spot that anchors the higher-timeframe bullish thesis.
The Deeper Tested Daily Cluster: 7134.00 - 7204.00
7204.00 (Tested Daily), 7134.00 (Tested Daily).
Context: Below 7264.50, we get into the deeper tested daily support — 7204 (tested, marked in red on my chart) and 7134 below. These would only come into play in a meaningful structural pullback scenario. Critical that levels hold here or we make new untested daily areas for support.
Actionable Setup: These are reference levels for the deeper-pullback scenario. The structural bullish thesis remains intact even hundreds and hundreds of points lower — this market is absolutely 100% pointed to the upside on the higher timeframe.
📌 Cheat Sheet – Key Levels Recap
🧠 Final Thoughts
Without over-embellishing or taking it too far, I think we are going to get a little rotation lower this week. We have officially closed below the four-hour support that took us to all-time highs, the weekly TPO printed a poor low that needs to round out, and the MACD/RSI divergence is pointing down. The plan is clean: above 7450 on ES, the bullish lean reclaims; above 7477 and ultimately 7481, we are cleared for takeoff back to all-time highs. Below those levels, we work the downside buy zones — first the 7420 big 4-Hour, then the 7414 sub-leg daily, then the 7399 Previous Weekly VAL sweep, and ultimately the 7366.25 / SPX 7358.93 make-or-break confluence where I would be taking major profits around 7395 on the first bounce.
The longer-term picture is unchanged: this market is absolutely 100% pointed to the upside, even if we come down hundreds and hundreds of points. We are not calling a top — we are setting up the buy zones for the next leg up. Stick to the plan, stay patient, and watch the 7366 / 7358 SPX-ES confluence for the make-or-break spot of the entire week. If we get the rotation into the 7200 area on SPX, that is when VIX gets the pop into the 20.78 Weekly. Use VIX as your barometer the whole way through. Money will be made on both sides — let the setups prove themselves and execute the plan.
I will see you guys on Monday in the Discord room and on the stream, with the full daily plan out Tuesday. Let’s go conquer the markets together.
Until next time—trade smart, stay prepared, and together we will conquer these markets!
Ryan Bailey, VICI Trading Solutions.
📣 Announcements & Calls to Action
🚀 SPX Edge AM Brief — Limited Capacity Remaining
We still have limited capacity available on the free SPX Edge AM Brief. This is the daily pre-market brief I personally use every single morning with my coffee — it delivers point of controls and value areas for the week, month, and day on SPX, TWAP positioning, pattern intelligence reports, and fresh news that is no more than eight hours old, all in a 60-to-90-second read that hits your inbox before the open. If you have not signed up yet, do it now while the free tier is still open — once we hit capacity, this becomes a paid product.
Sign up here → https://pages.vicitradingsolutions.com/spx-edge
🎓 Webinar — How to Trade the Trade Plan — May 28th
We are running another How to Trade the Trade Plan webinar on May 28th. By popular demand, this is your opportunity to learn directly from me exactly how I read the levels, how I use the options levels, and how to execute the plan more effectively in real time. We are also giving away two prop firm evaluations as prizes to attendees — you have to show up live to win, so put it on your calendar.
The webinar includes a full live Q&A at the end. Bring every question you have about the process, the levels, the methodology, risk management, options sizing, anything — and I will answer them on stream. This is one of the most direct ways to sharpen your edge and tighten up your execution heading into the back half of the year.
Sign up here → https://pages.vicitradingsolutions.com/tradetheplan
Reserve your seat, bring your questions, and let’s win some prizes together.
📊 TradingView Indicator String
Copy and paste the levels below into your S&P Edge Levels indicator to automatically plot today’s key levels on your chart:
7481.00|P.W. VAH|GD
7477.00|4HR|4H
7450.50|4HR|4H
7438.00|4HR|4H
7434.00|D|D
7420.00|4HR|4H
7414.00|Tested D|TD
7399.00|P.W. VAL|GD
7369.00|1HR|1H
7366.25|4HR|4H
7340.00|4HR|4H
7264.50|D|D
7204.00|Tested D|TD
7134.00|Tested D|TD

