

📬 Important Subscriber Notice: Please Check Your Spam Folder
Before we get into the Weekend Review, I want to make sure everyone sees this.
I’ve been sending out follow ups, touchpoints, and important information to subscribers from rbailey@vicitradingsolutions.com and info@vicitradingsolutions.com. This includes updates for current subscribers and those who have subscribed to the SPX Brief.
I can clearly see that many of these emails are not being opened, and there is a very good chance they are getting stuck in spam or promotions folders.
Please take a minute today to check your spam folder, promotions folder, or any filtered inbox tabs. If you see an email from rbailey@vicitradingsolutions.com or info@vicitradingsolutions.com, mark it as Not Spam and add the email to your contacts or safe sender list.
There is valuable information going out to subscribers, and I do not want you guys missing anything simply because your inbox is filtering the emails incorrectly.
Hello everyone, and happy Sunday.
It is time for the Weekend Review, and first off, happy Mother’s Day. If you have a mom, or somebody in your life who is a mom, make sure you get out there and thank them. I’m getting ready to cook breakfast myself, but before we digest the Mother’s Day meal, we need to get into the charts and make sure everyone is prepared for Monday.
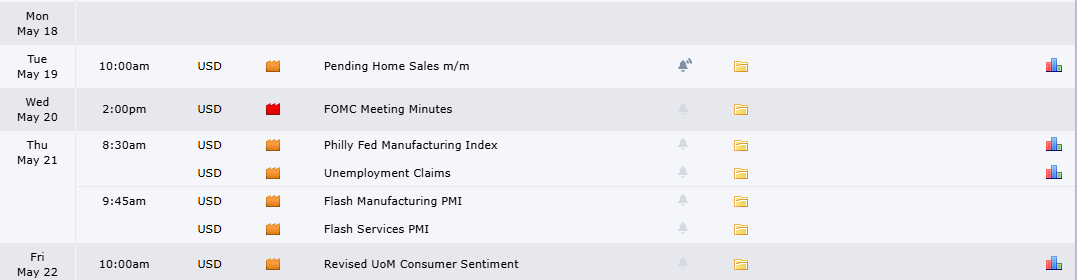
Coming into next week, we have a very light scheduled news calendar. The only real Red Tag event on the calendar is FOMC Minutes on Wednesday. We can call that important, but the actual FOMC announcement was the major event. The minutes are more of a follow up, which means we do not have much scheduled news to lean on for volatility this week.
That creates a tricky environment. We could easily see another low relative volume, headline driven week. A lot of the recent rotations have happened during the overnight session, which makes life more difficult for cash session traders. This is becoming a patience game, and that is pretty normal as we approach summertime trading while sitting near all time highs.
A Note on This Week’s Market:
News: Very limited scheduled Red Tag news. The only major item is FOMC Minutes on Wednesday.
Volume: With limited scheduled catalysts, this could become another low relative volume, headline driven week.
Range: We are mapping more than 200.00 points of actionable structure between the upper price discovery zone and the deeper support pivots.
Gamma: No specific gamma levels were discussed this week. Structurally, the market remains in buy the dip territory until support proves otherwise.
Trend: The trend is still up. We are overextended, but we are still pointed higher until the major support layers start breaking.
🧠 Current Market Context
Price Discovery, Thin Support, And A Patience Game
The bigger picture is simple. We have been pushing higher for weeks with limited rotations. The weekly chart looks like a rocket ship, and the 4 hour chart has been nothing but a series of aggressive green candles with very few meaningful pullbacks. That is bullish, but it also creates a problem: support becomes extremely thin underneath price.
When we push up this aggressively without proper rotation, the market does not build clean structure underneath. That means if we lose the first few support layers, price can move quickly through inefficient areas. This is why I want everyone focused on the exact above below levels this week. We are still bullish, but we need to know where things start to change.
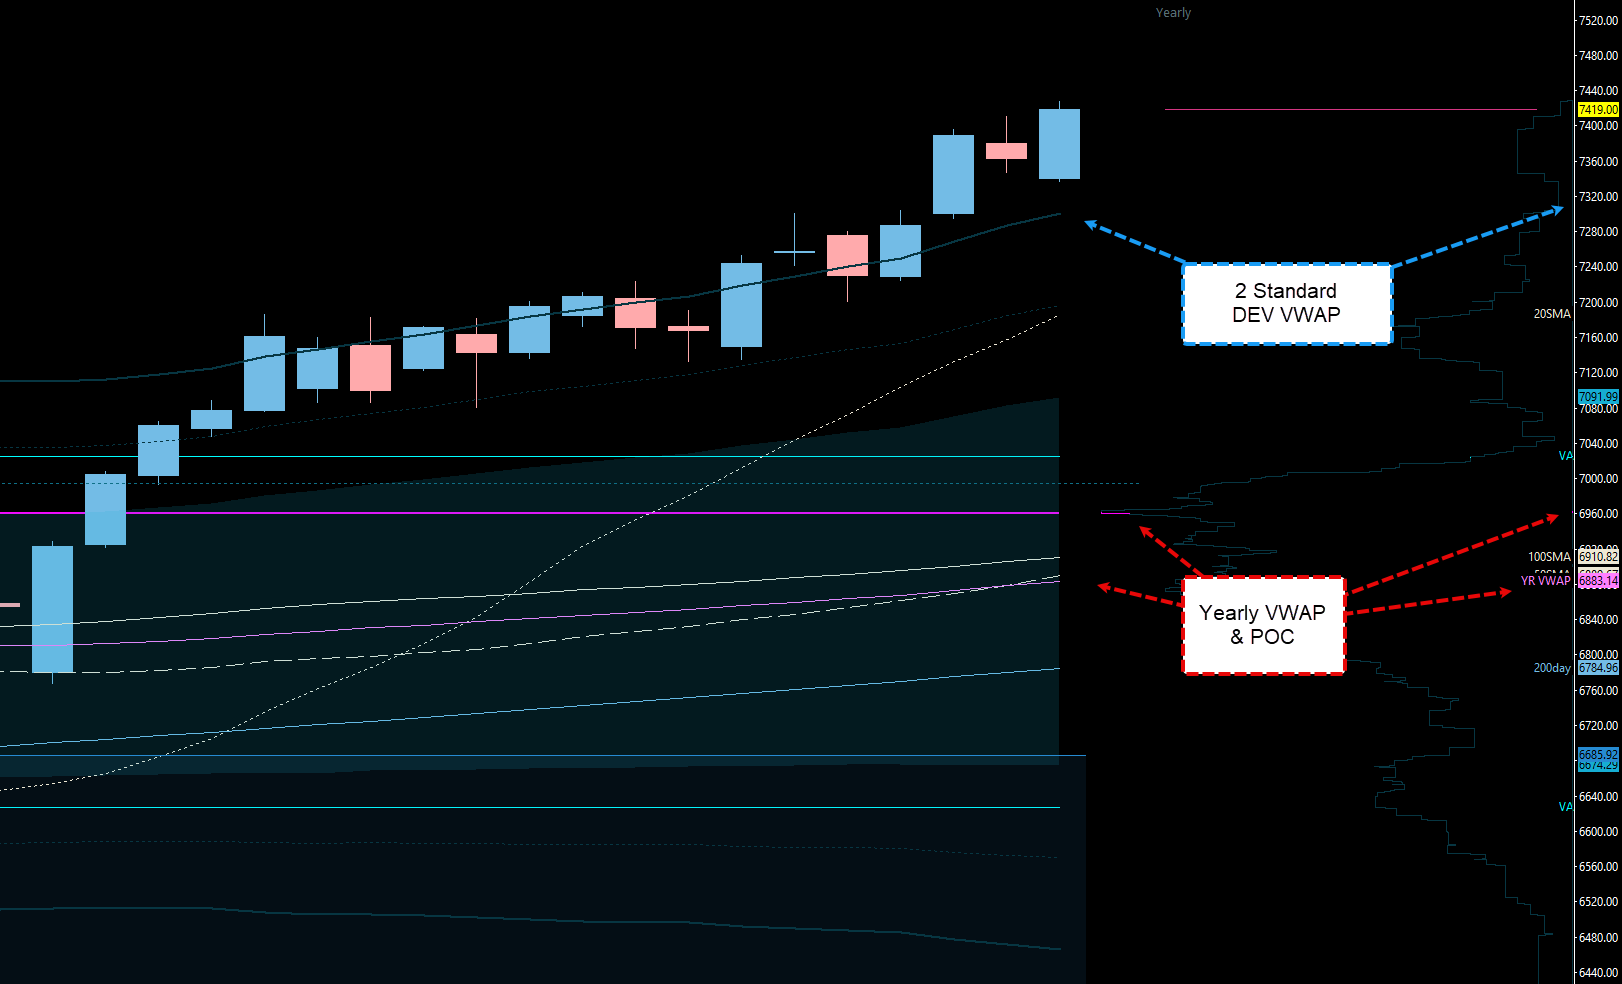
The other major piece is value. We are extremely far outside the yearly two standard deviation structure. It is not common for ES to be this far outside value. When price pushes this far beyond value, it does not mean it has to immediately collapse, but it does tell us that a pullback toward the mean becomes increasingly likely. We saw this type of behavior two weeks ago, and it led to a nice pullback. Now we are seeing it again.
🚨 SPX Analysis: Use SPX As The Guide
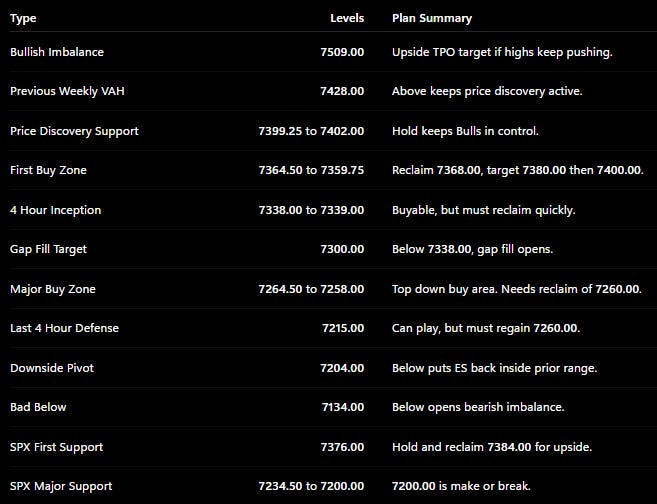
This week, SPX is one of the cleanest guides we have. The key SPX levels are 7376.00, 7334.00, 7234.50, and 7200.00.
The first important area is 7376.00. This is an untested daily level on SPX. If price pulls back into 7376.00, holds, and then reclaims 7384.00, we can continue higher in price discovery mode.
Below 7376.00, the next major SPX support is 7334.00. This is the last untested support area I have on SPX in that upper structure. It is both a 4 hour and 1 hour level. It also lines up with Thursday’s naked point of control and an RTH gap fill. That gives us real confluence. If 7334.00 plays, I would look for a move back toward 7360.00 into 7380.00.
If SPX loses 7334.00, we could come down another 100.00 points into the 7234.50 area. That level aligns beautifully with a 1 hour level at 7234.00, creating a very precise high timeframe and low timeframe support zone. If 7234.50 plays, I would look for a move back toward 7300.00, 7310.00, and potentially back into the 7334.00 area.
The real make or break area on SPX is 7200.00. If 7200.00 plays, it needs to reclaim 7234.00 desperately. If it does, we can squeeze higher and potentially travel back 100.00 points into the major structure above. But underneath 7200.00, she gives it up. That is the line where the downside opens much more aggressively.
📊 Market Profile And TPO Context
Bullish Imbalance Above, Gaps Below
The weekly TPO is giving us two competing pieces of information.
On the upside, the previous weekly value area high sits at 7428.00. Above that, the bullish imbalance measured move points toward 7509.00. The reason this matters is because last week’s profile has a clean value area low, a large value area in the middle, and essentially no proper value area high. That is a bullish imbalance, and eventually the market may want to clean that up.
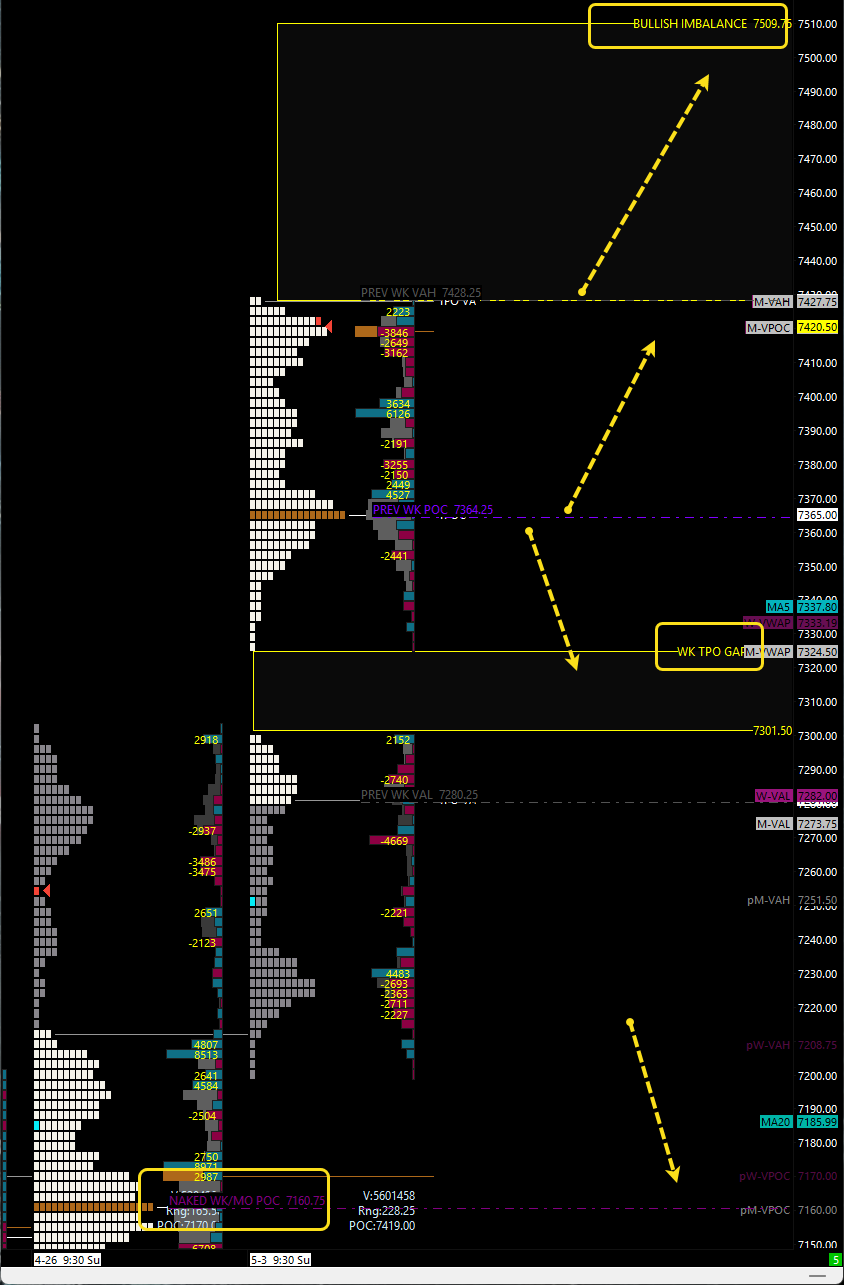
So yes, we are overextended, but the weekly TPO still leaves an upside path toward 7509.00 if price can continue holding and pushing through the highs.
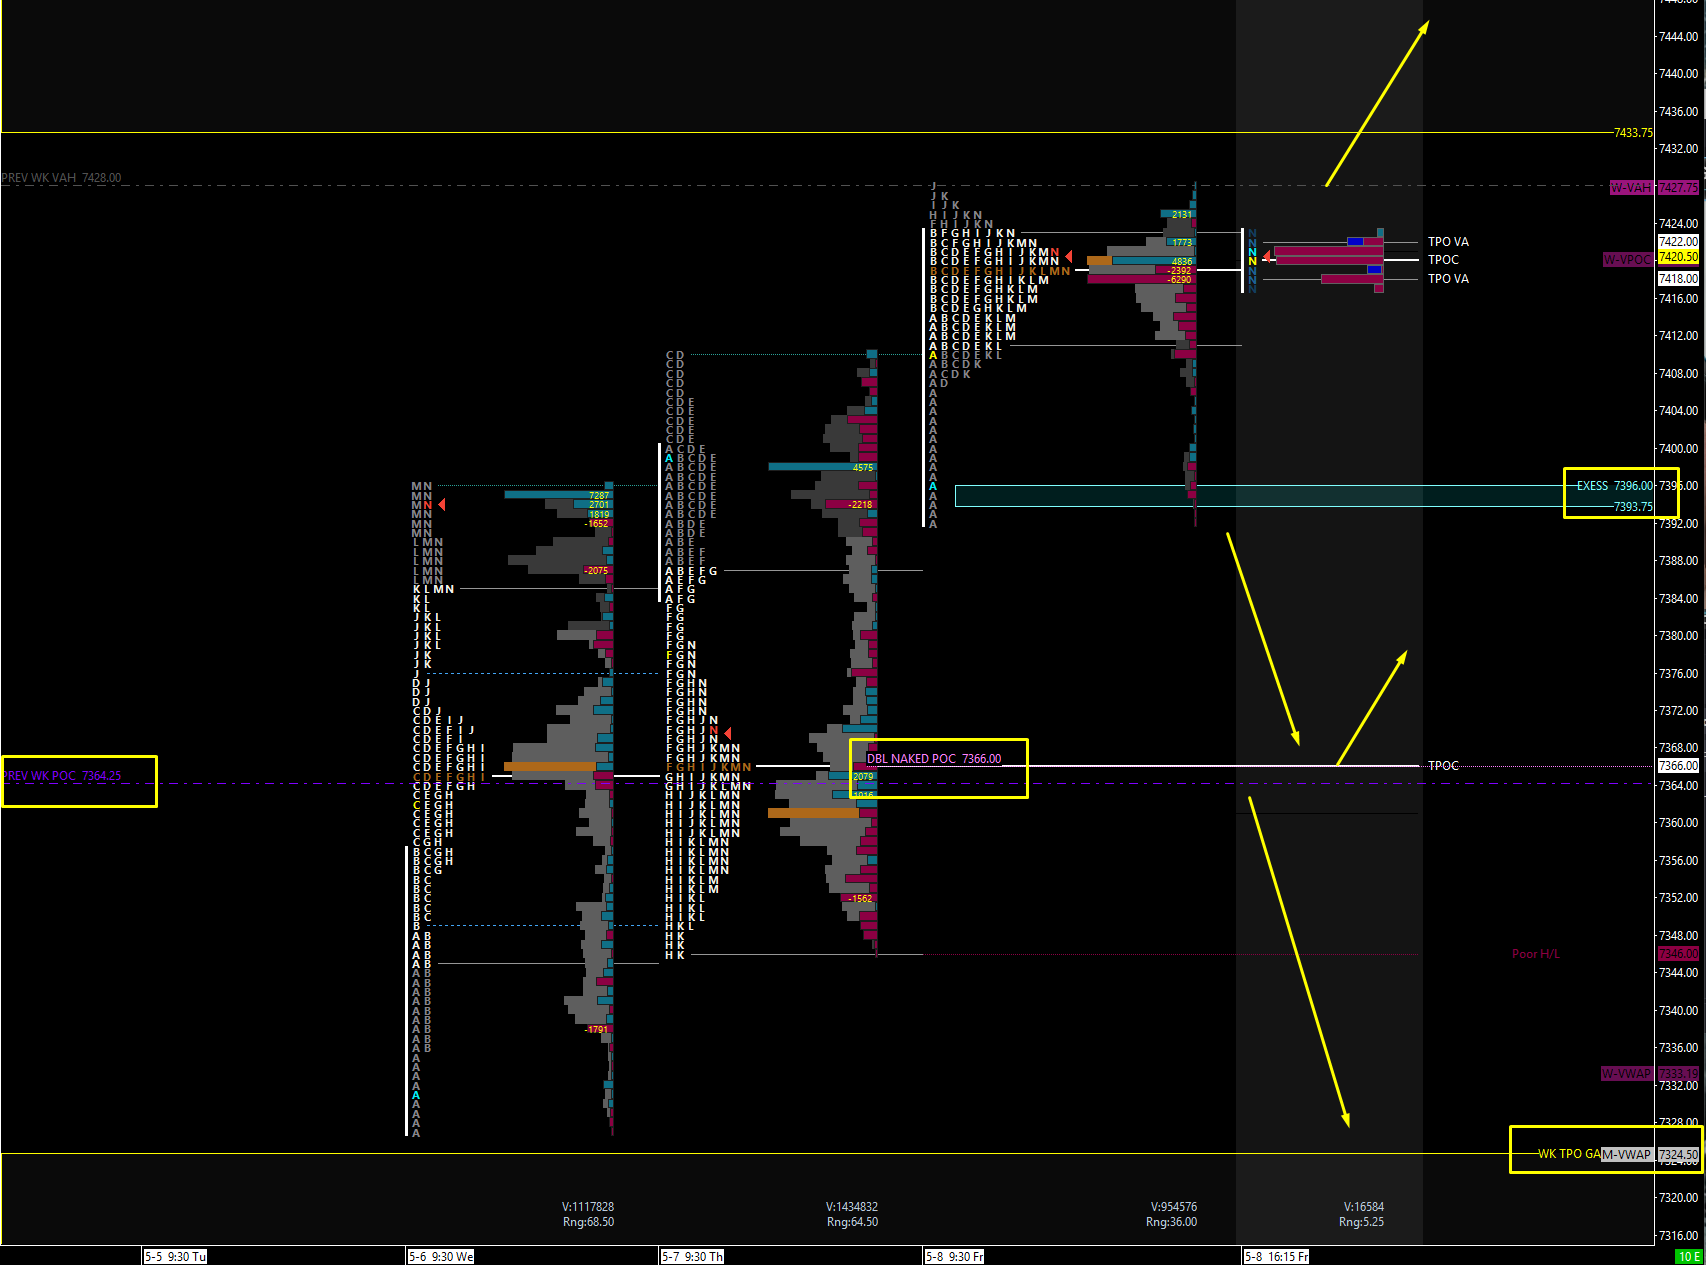
On the downside, the first major TPO support is the weekly point of control at 7364.00. This area is not just the previous week’s point of control. It also lines up with Wednesday’s point of control and Thursday’s point of control. That gives us a highly confluent naked POC cluster, and I do think it can get a reaction on first touch.
The issue is simple: if 7364.00 does not hold, we start filling gaps below. That is where price can move quickly because of how inefficient the structure is underneath.
🎯 Detailed Actionable Trade Plan
The plan for this week is to stay bullish while respecting the fact that we are overextended.
We are not blindly chasing highs. We are not pretending the market cannot pull back. We are identifying the exact levels where the pullbacks become buy opportunities, and the exact levels where things start to get more dangerous.
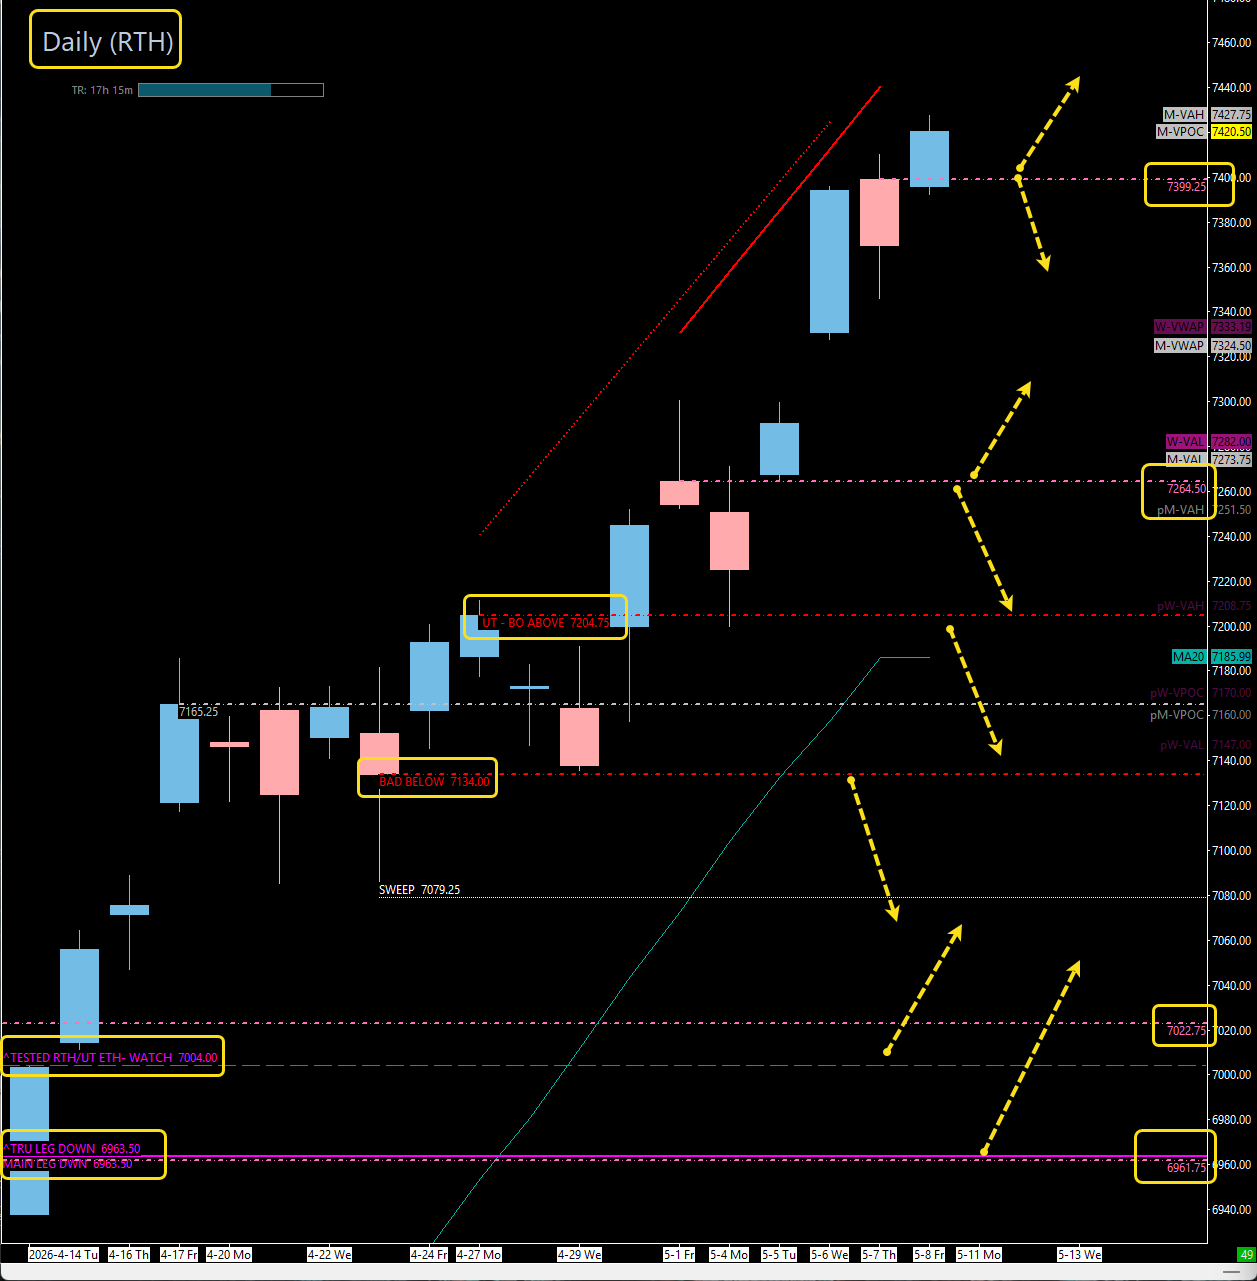
The primary ES levels this week are 7399.25, 7364.00, 7339.00, 7264.50, 7215.00, 7204.00, and 7134.00.
🔴 Key Resistance Zones & Setups
The Previous Weekly VAH And Bullish Imbalance Zone: 7428.00 to 7509.00
7428.00 is the previous weekly value area high. 7509.00 is the upside bullish imbalance target.
Context: The weekly TPO shows a bullish imbalance above price. If ES clears and holds above 7428.00, the profile suggests the market can continue working toward 7509.00.
Actionable Setup: Above 7428.00, do not fight the upside. That would put ES back into active price discovery and imbalance cleanup.
Warning: We are already extended, so any upside continuation needs to be managed with discipline. This is not the area to start forcing late longs without structure.
The Price Discovery Hold Zone: 7400.00 to 7402.00
7399.25 is the key daily support from the top down, and it aligns with the 7402.00 4 hour area.
Context: This is the first major above below zone for upside continuation. If this area holds, the Bulls can keep control and continue pressing higher.
Buy Setup: A pullback into 7399.25 to 7402.00 that holds can send ES back into all time high discovery.
Warning: Underneath 7399.25, things get real quickly because there is no untested daily support until 7264.50.
The Upper Reclaim Target: 7380.00 to 7400.00
This is the first major target zone if we buy support lower from the 7364.50 to 7359.75 area or the 7339.00 area.
Context: Once price loses the upper structure, 7380.00 and 7400.00 become targets and then major hurdles.
Actionable Setup: If we buy lower support, this is where we want to take profits.
Warning: If ES loses the upper structure and then rallies back into 7400.00, that area can become serious resistance.
🔵 Key Support Zones & Setups
The Naked POC Cluster: 7364.50 to 7359.75
7364.50 and 7359.75 are the 1 hour levels I would consider buying. This zone also aligns with the previous weekly POC at 7364.00, Wednesday’s POC, and Thursday’s POC.
Context: Even though this is not a 4 hour or daily level, there is enough confluence here to take a poke on first touch. The stacked naked POCs make this a meaningful area.
Buy Setup: I want to see 7364.50 or 7359.75 play, then reclaim 7368.00. That gives us the trigger.
Targets: First target is 7380.00. After that, the bigger target is 7400.00.
Warning: If we lose this zone, the market starts moving into the next lower structure quickly.
The 4 Hour Inception Zone: 7338.00 to 7339.00
7339.00 is the untested 4 hour level that I do not love, but it is there. It represents the 4 hour inception of the leg from Thursday’s sweep and squeeze.
Context: The reason this level matters more than it otherwise would is because the weekly and monthly VWAPs are crawling into the same area. Big funds and CTAs often defend and trade around these value areas.
Buy Setup: If 7338.00 to 7339.00 plays, I want to see a reclaim back through the broken structure. This can create a trade back toward 7368.00, 7380.00, and possibly 7400.00.
Warning: Below 7338.00, we begin filling the weekly gap toward 7300.00, and potentially much lower.
The Gap Fill And Major Buy Zone: 7264.50 to 7258.00
7264.50 is the next untested daily support and also aligns with 4 hour structure. The broader zone includes 7258.00, which is where things start to get more serious if lost.
Context: This is the big spot that is screaming at me. We saw a similar setup two weeks ago where price came down into support and ripped back up. This is the same type of scenario.
Buy Setup: If ES comes into 7264.50 and holds, I like this area for a top down buy on first touch.
Reclaim Requirement: If this plays, we need to reclaim the 7260.00 area and then work back toward the higher barriers.
Targets: First major target is back toward 7338.00 to 7339.00. Above that, 7400.00 becomes the bigger barrier.
Warning: If ES loses 7258.00, things are seriously in trouble.
The Last Untested 4 Hour Defense: 7215.00
7215.00 is the last untested 4 hour level underneath the 7264.50 zone.
Context: I do believe this level can play, but if we get here, we are already losing multiple layers of support.
Buy Setup: If 7215.00 plays, we need to see a reclaim back above the 7260.00 area. Without that reclaim, this can remain heavy.
Warning: If 7215.00 bounces but rejects into 7260.00, that is not strength. That is overhead resistance doing its job.
The Downside Range Pivot: 7204.00
7204.00 is the major 4 hour level and downside pivot. It is still untested, and it is extremely important.
Context: Under 7204.00, we get stuck back inside the prior range. Once that happens, the market can start pulling back much deeper.
Actionable Setup: If 7204.00 holds and reclaims higher structure, we can still look for upside continuation.
Warning: Underneath 7204.00, we can easily push toward 7134.00.
The Bad Below Level: 7134.00
7134.00 is clearly labeled bad below and opens the door to the bearish imbalance created weeks ago.
Context: This is where the downside gets much more serious. If ES loses 7134.00, we are no longer talking about a simple upper level pullback. We are talking about filling a real bearish imbalance.
Short Setup: Below 7134.00, shorts can work into lower support.
Warning: This is not where I want traders blindly trying to catch knives. Let the market prove itself.
🚨 Momentum Shift Levels
Upside Continuation Pivot: 7399.25 to 7402.00
Above this area, ES can stay in price discovery mode.
First Buy The Dip Trigger: 7364.50 to 7359.75
This is the first area I would consider buying, but I want the reclaim of 7368.00.
Gap Fill Trigger: Below 7338.00
Below 7338.00, we start filling the gap toward 7300.00 and potentially the 7264.50 area.
High Time Frame Buy Zone: 7264.50
This is the major daily and 4 hour support zone I like for a top down buy.
Major Downside Pivot: 7204.00
Below 7204.00, we are back inside the prior range.
Bad Below Level: 7134.00
Below 7134.00, we start filling the bearish imbalance.
📌 Cheat Sheet — Quick Levels Map
🧠 Final Thoughts
This week is all about patience. We are overextended. We are outside value. The weekly and daily profiles show inefficiencies above and below. The upside bullish imbalance can still take us toward 7509.00, but the support underneath price is thin because the market has been pushing vertically without meaningful rotation.
That means we stay bullish, but we do not get sloppy. The best trades this week are likely going to come from waiting for high probability support. If 7399.25 holds, we can continue higher. If we lose it, I am watching 7364.50 to 7359.75, then 7338.00 to 7339.00, and then the real high timeframe buy zone at 7264.50. Below 7204.00, things get more dangerous, and below 7134.00, we start filling a deeper bearish imbalance.
Use SPX as your guide. Respect the important pivots. Understand that we are still in buy the dip territory, but that does not mean shorts cannot happen. It simply means those shorts are tactical, not long term. The ultimate move is still to the upside until the market proves otherwise.
Being patient is half the battle. We cannot control the market, but we can control our setups. I would rather take one or two high probability trades this week than force five or six garbage trades and spend the rest of the week digging out of a hole.
Enjoy the rest of your Sunday, enjoy Mother’s Day, and I’ll see everyone Monday for the post market breakdown and in the room at 9:15.
Until next time—trade smart, stay prepared, and together we will conquer these markets!
Ryan Bailey, VICI Trading Solutions.
📊 TradingView Indicator String
Copy and paste the levels below into your S&P Edge Levels indicator to automatically plot today’s key levels on your chart:
7428.00|P.W. VAH|GD
7402.00|4HR|4H
7399.25|D|D
7364.50|1HR|1H
7359.75|1HR|1H
7339.00|4HR|4H
7264.50|D|D
7215.00|4HR|4H
7204.00|4HR|4H
7134.00|D|D
📌 Final Subscriber Notes
We still have limited capacity available for the SPX Brief, and if you have been thinking about getting access, now is the time to lock it in. This is designed to give you a clean, focused read on the SPX levels that matter most, so you can come into the market prepared instead of guessing. 100% Free and Delivered in the AM with coffee.
You can sign up here:
https://pages.vicitradingsolutions.com/spx-edge
Also, we are running another How to Trade the Trade Plan webinar on May 28th. This session is built specifically to help you understand how to use the daily trade plan more effectively, how to read the levels, how to approach the setups, and how to execute with more confidence.
We will also be giving away two prop firm evaluations, and you will have the opportunity to ask any questions you may have about the process, the plan, and how to trade it more effectively.
You can sign up for the webinar here:

