

Welcome back, everybody — it is time for the Week in Review. It is April 5th, and we come off another incredible week. Last week the trade plans were epic — we had some insane moves, some insane catches, and I am super excited to do it all again this week. I have actually been working my tail off this weekend getting the 10-Day Challenge Packs ready for all subscribers. These will be coming out to give you a little push, along with some detailed information on exactly how to trade the plan and see things a little bit better. For those of you who are not subscribers to the S&P Edge, I highly recommend it — you are going to enjoy these challenge packs. It is going to be a lot of fun as I challenge all of you to put up some numbers and follow the plans.
Coming into the week, we are still pointed down. A lot can happen, and it is possible we can continue to move up a little bit. Right now we are bumping our head on some major resistance. We are going to focus strictly on the ES charts today as we examine the current candlestick price action, the 4-Hour structure, and what the chart is currently telling us.
A Note on This Week’s Market:
News: Multiple Red Tag news events expected this week. Stay aware of the scheduled releases, as each one has the potential to create significant intraday volatility in this environment.
Volume: Expect continued participation as we remain in a highly volatile regime. Institutional flows continue to dominate the tape as we balance between major support and resistance.
Range: Ranges continue to be massive. Given the magnitude of the moves over the past two weeks, expect another large-range week with significant moves in both directions. The overnight sessions have been producing 100+ point swings.
Gamma: We are still in Negative Gamma territory. Dealers are hedging to the downside. This means squeezes can be imminent and violent — be prepared for action in both directions. These bear market squeezes will continue to happen on the way down.
Trend: Still extremely bearish. We have still not gained on the Daily, Weekly, or 4-Hour time frame. The 4-Hour cannot gain — we have got to start there, and it has not done it yet. However, we do have a bullish imbalance on the Weekly TPO after pushing all the way back up from making new lows. VIX is also getting hammered, sitting near the 24.70 Monthly with potential to push lower, which could give the indices a tailwind for a continued push higher.
🧠 Current Market Context
The Bullish Inefficiency vs. The Bearish Structure
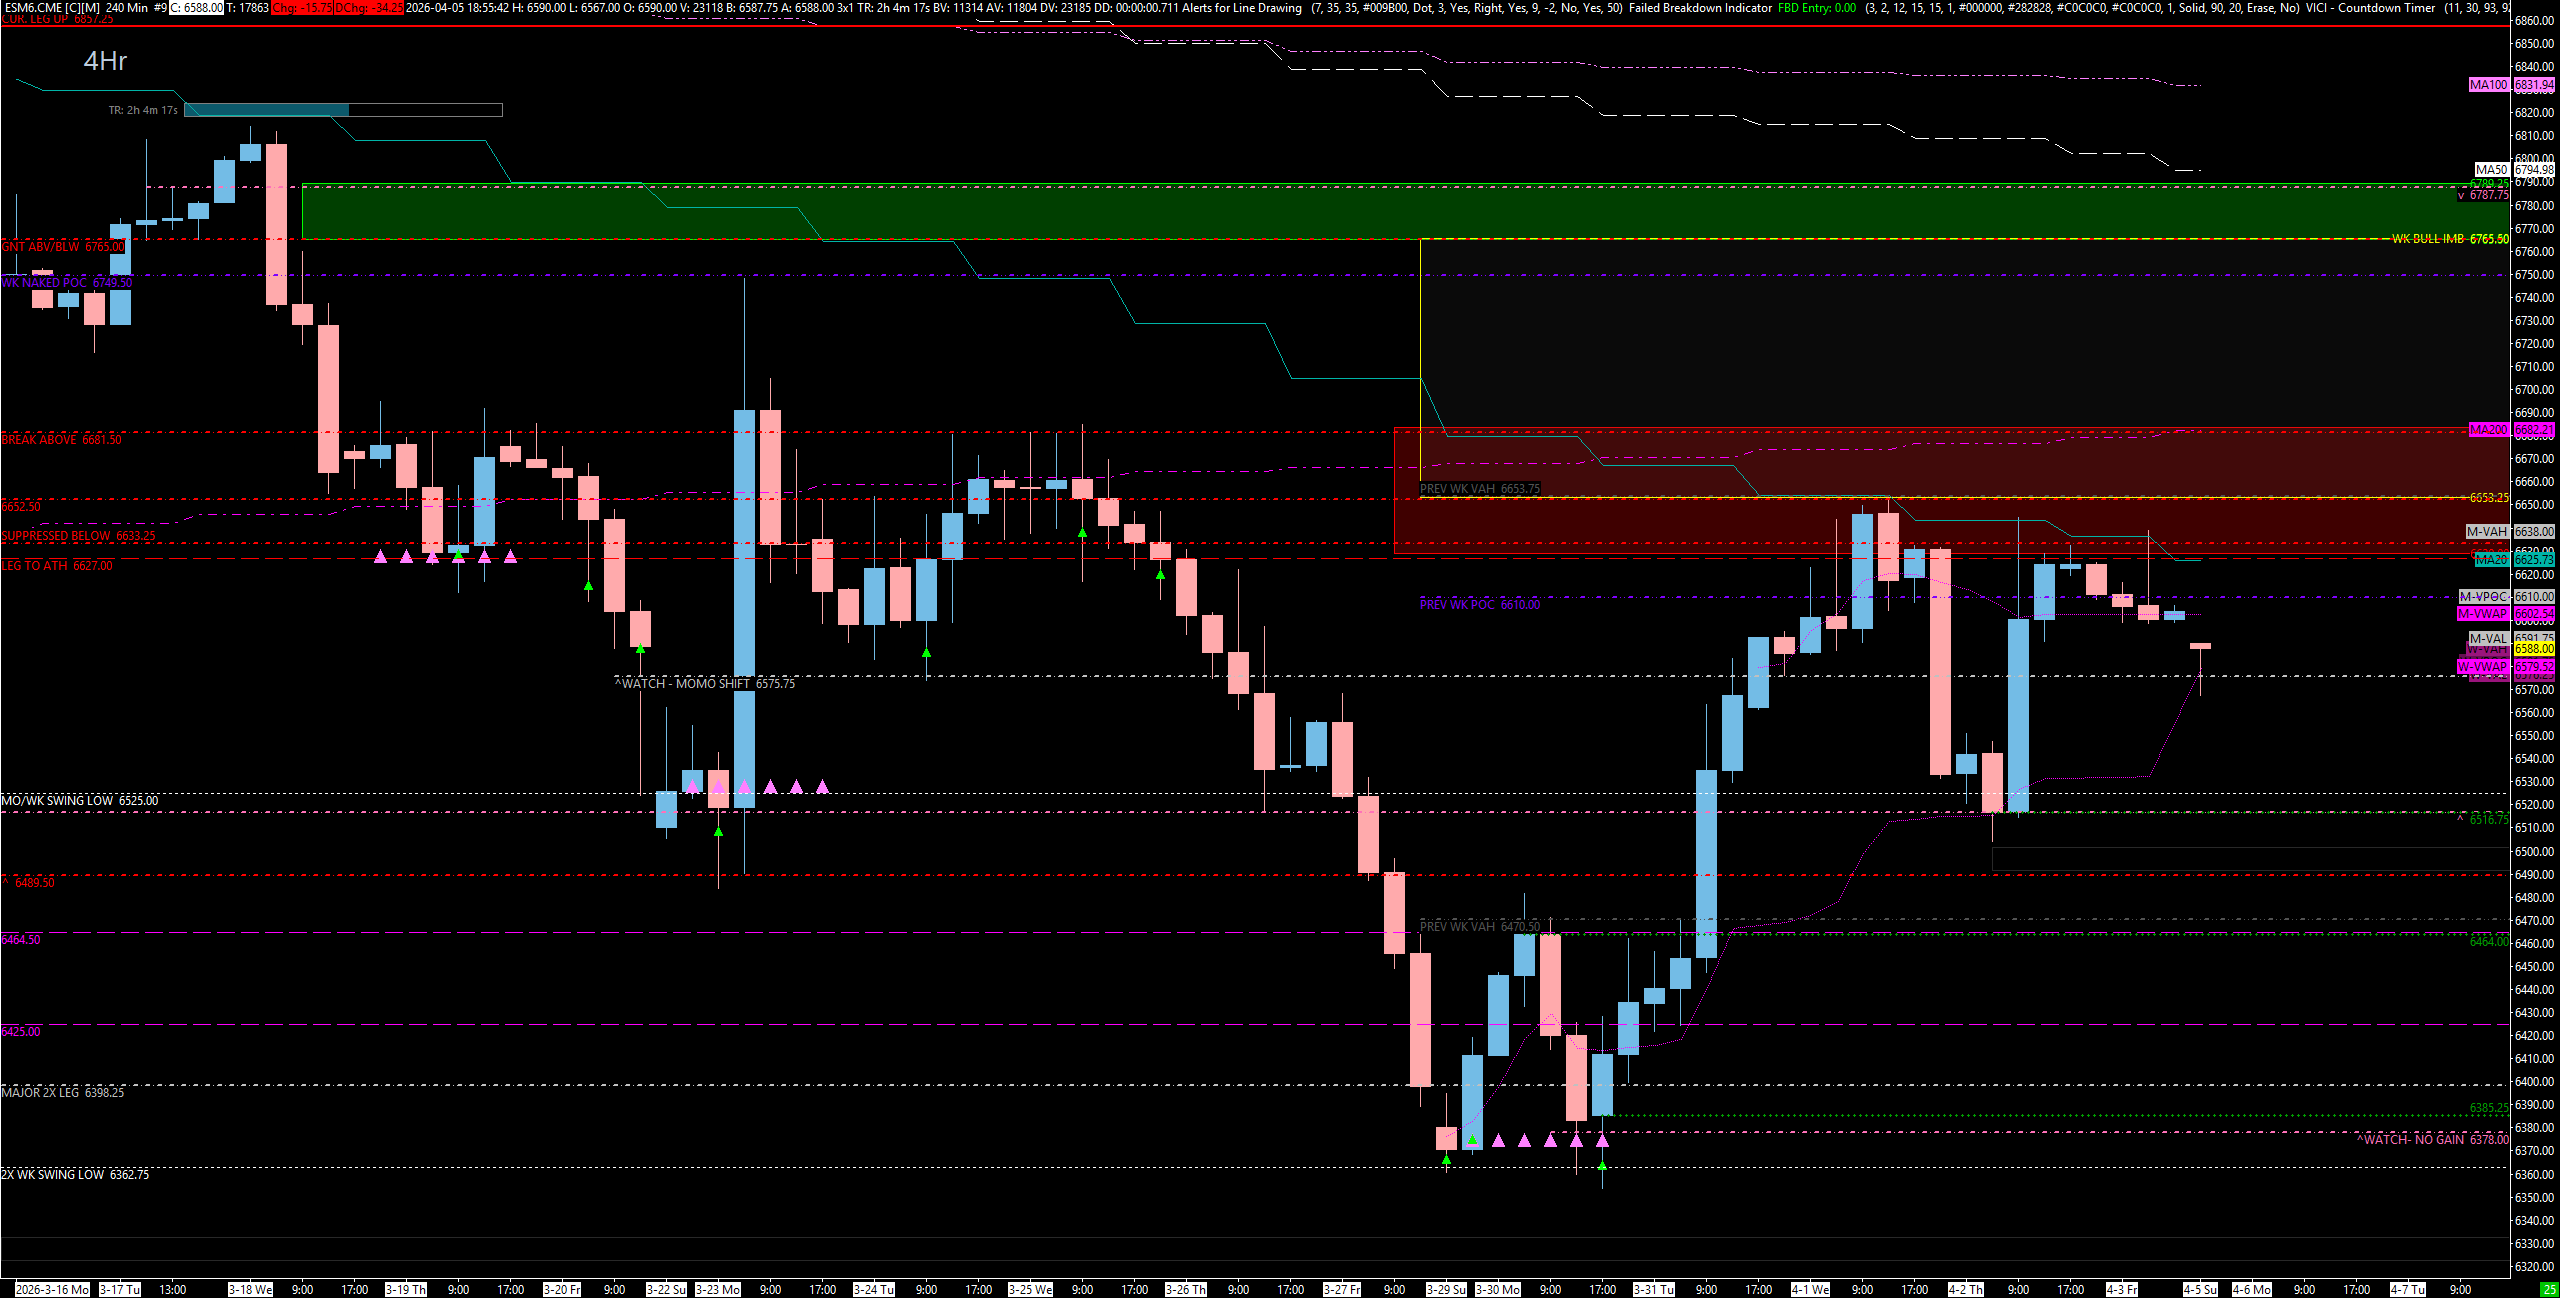
We find ourselves at a very interesting crossroads. After making new lows and sweeping the 6362.75 area, we have pushed all the way back up and are now spending time in this week’s value area. This is a very aggressive push. We have a bullish imbalance on the Weekly TPO, and there is a massive bullish inefficiency above us that will eventually need to get filled — and it comes pretty high, all the way up to 6765.00, which sits right by the Daily leg down that we are looking to short. This is a big tell in my opinion.
However — and this is critical — we have still not gained on the Daily, Weekly, or 4-Hour time frame. The pop was nice, but we are really just going to watch the 6627.00 / 6633.25 zone for above/below continuation. It is as clean as I can get it: we are bearish below 6633.25 and bullish above 6633.25. If they can push above 6652.50, we will pop 6681.50 this time — I doubt it will stop there — and then push higher up into the Previous Weekly POC and ultimately into the big Daily leg down at 6765.00 for a great short. If they cannot get above the 6633.25 / 6627.00 spot and hold it, this is going to come down anyway. It very well could, and that is the base case as long as we have no support gained.
Right now, price is playing off the 6575.75 Daily, which is a momentum shift level for me — up or down. It has some nice structure here, and if they hold this, we could push up. With VIX being as low as it is, they could pop this up in the overnight session. But if this level fails, we will start working back toward the lower support zones, and ultimately this whole thing could come all the way to 6268.00 — which is still a great buy and an awesome spot, about 300 points from where we sit. It is certainly possible, and I do not think it is not possible.
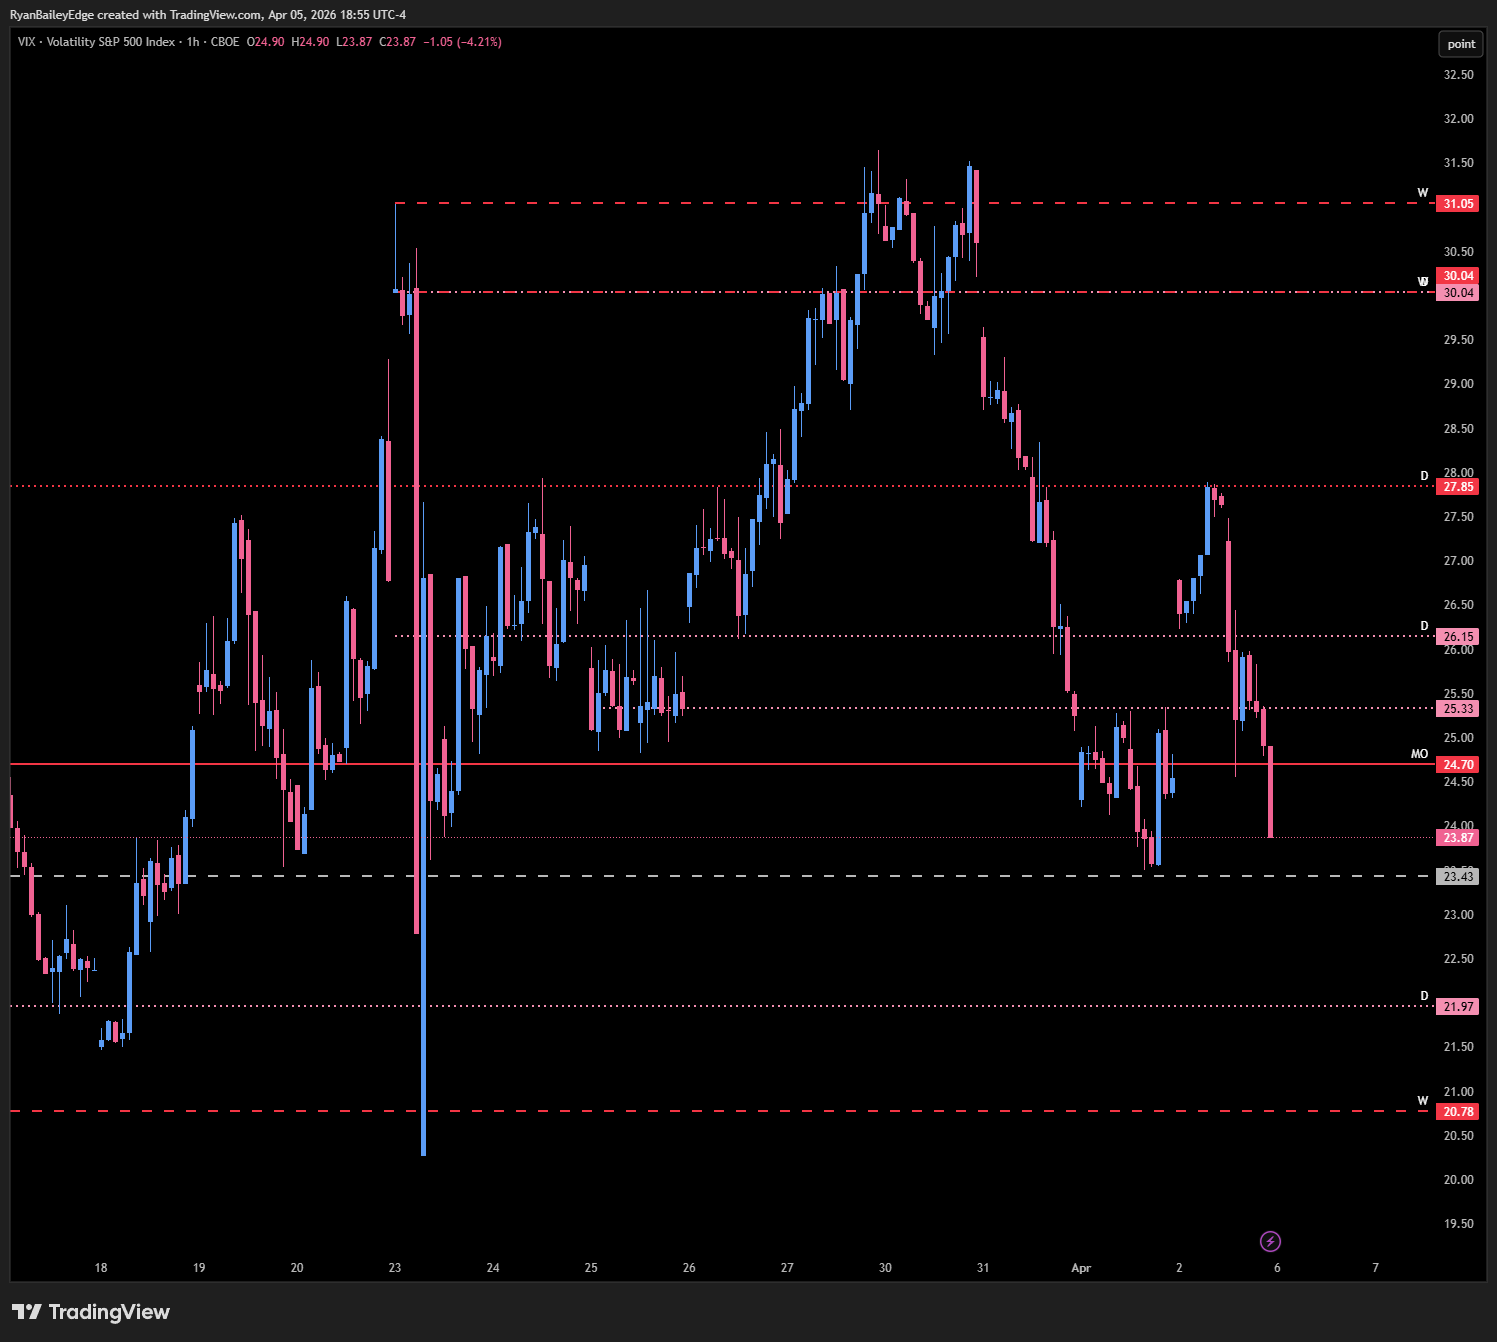
🚨 VIX & Volatility Context
VIX is getting hammered. We are coming off the 27.85 Daily and have been crashing, now sitting right at the big 24.70 Monthly that we have been toying with for weeks. It looks like VIX has the potential to push lower from here, and if it does, the indices will continue to have a tailwind for a push higher.
The Monthly Floor: 24.70 (Monthly). VIX is sitting right at this level. As long as VIX stays above 24.70, the indices remain somewhat suppressed. However, given how hard VIX is getting hammered, a push below could be imminent.
The Tailwind Trigger: If we break below the 23.43 Weekly, the indices are going to have another tailwind for a push higher. Below that, I am watching 21.97 as support — if VIX plays there, we shall see, but there is some potential for a further decline.
The Headwind Return: If VIX bounces off this area and pushes back above 24.70 and reclaims the 26.15 Daily, the headwind returns for the indices and we could see a swift move lower. Keep VIX on your radar — it is a major barometer for everything this week.
🎯 Detailed Actionable Trade Plan (ES Futures)
The structure is crystal clear: we are bearish below 6633.25 and bullish above 6633.25. This is the line in the sand. Above this, the bullish inefficiency takes us to 6765.00 for a prime short. Below this, the support structure starts to thin out quickly, especially underneath the 6516.75 Daily, which is holding the weight up. If we lose the Weekly support at 6450.00, it is lights out and we are heading for 6268.00. Until we gain on the 4-Hour time frame, the lean remains to the downside.
🔴 Key Resistance Zones & Setups
The Line in the Sand — Weekly/Daily: 6627.00 - 6633.25
6633.25 (Daily), 6627.00 (Weekly).
Context: We have talked about this area for weeks. This big Weekly/Daily zone is where it all goes down — we are bearish below here and bullish above here. That is as clean as I can get it. Price has been unable to gain above this area, and as long as we remain below 6633.25, the Bears maintain their structure. If they cannot get above this spot and hold it, this is going to come down anyway.
Actionable Setup: If price pushes into this zone and rejects, look for continuation lower back toward 6575.75 and below. If price accepts above 6633.25, the picture shifts — see the zones above.
The Midpoint Pivot & Prev WVAH: 6652.00 - 6652.50
6652.50 (Previous Weekly Value Area High / Midpoint Pivot).
Context: I went fishing and found this level — it is basically the midpoint pivot and was also the Previous Weekly Value Area High. We played it the other day, and price has not been able to get back above this area. If they can push above 6652.50, we will pop 6681.50 this time — I doubt it will stop there.
Actionable Setup: A push above 6652.50 is the trigger for the breakout through 6681.50 and continuation into the Previous Weekly POC and higher.
The Tested Daily Breakout Trigger: 6681.50
6681.50 (Tested Daily).
Context: If we break out above 6681.50, we push higher. This time I would be very surprised if it stops here, given the bullish inefficiency above and the Weekly TPO imbalance.
Actionable Setup: A breakout above 6681.50 takes us into the Previous Weekly POC and ultimately the Daily leg down target at 6765.00. Use this as a waypoint — acceptance above means the inefficiency fill is underway.
The Prime Short — Daily Leg Down & Inefficiency Fill: 6765.00 - 6787.75
6787.75 (Untested Daily / Leg Down), 6765.00 (Tested Daily / Inefficiency Fill Target).
Context: This is where the bullish inefficiency fills to — all the way up to 6765.00, which sits right by the Untested Daily leg down at 6787.75. This is a great short setting up. If we push all the way up here, I would be looking for a massive smack and reaction to the downside. We would want to see price play this area and get back below 6765.00 and the pivot at 6750.00 — if that happens, this thing will come all the way down.
Actionable Setup: Short Setup: Look for this area to play and get back below 6765.00 and ultimately below 6750.00 for continuation lower. If this plays, it could produce a monster move to the downside all the way back toward the lows.
Warning: If price holds this area and pushes higher above 6787.75, they will continue to push much higher and the Bears will lose control entirely. Until the daily closes above 6787.75, we remain with a downside lean.
🔵 Key Support Zones & Setups
The Momentum Shift Level: 6575.75
6575.75 (Daily / Momentum Shift Pivot).
Context: This is a momentum shift level for me — up or down. Price is currently playing off of this level and it has some nice structure here. If they hold this, we could push up into the resistance above. This is the first gauge for continuation in either direction.
Actionable Setup: If price holds 6575.75 and pushes back above 6627.00, we are looking at a potential breakout higher. If price breaks below this level, we are heading toward the weight-bearing support at 6516.75.
The Weight-Bearing Support: 6516.75 - 6525.00
6518.75 (4-Hour), 6516.75 (Daily), 6525.00 (Monthly/Weekly Swing Low).
Context: This is such a big deal for me. The Daily at 6516.75 is kind of holding the weight up, in my opinion. The 4-Hour at 6518.75 lines up with it, and the Monthly/Weekly swing low at 6525.00 caps the zone. I actually really like this spot — I think this is worth taking a buy. Your risk would be very limited, but you would have to be careful because we have not gained anything.
Actionable Setup: Buy Setup: Let 6516.75 play and get back above 6525.00 before getting long. That would actually be a solid entry with limited risk. Target the 6575.75 momentum shift level and higher. However, if this level fails, we are heading into the Weeklies below, and that is where things get ugly.
Warning: Below 6516.75, the weight drops and price starts accelerating lower. Be very careful on the downside beneath this level.
The Previous Weekly VAL: 6464.00
6464.00 (Previous Weekly Value Area Low).
Context: This could be nice. If price pushes below the 6516.75 zone, this is the next area of support. It is also the Previous Weekly Value Area Low. If it plays, you want to see a reclaim back above for continuation.
Actionable Setup: Look for 6464.00 to play and reclaim. However, I would not trust too much underneath this level.
The Lights Out Trigger: 6450.00
6450.00 (Weekly).
Context: Once you are underneath 6450.00, it is lights out. Below this level, the support thins out dramatically and we are heading for a retest of the lows and potentially much lower. This is the line where the Bulls completely lose any remaining foothold.
Warning: Below 6450.00, price accelerates into the leg lows and there is not much to stop the move until we get to 6268.00.
The Daily Reaction — No Gain: 6378.00
6378.00 (Daily).
Context: This could get a reaction here, but I do not love it — just because we have not gained. I do think it will play, but I would not put a lot of confidence behind a sustained bounce here.
Actionable Setup: If 6378.00 plays, look for a pop, but do not expect anything major. The lack of gained support on any time frame makes this a low-conviction level.
The Major Target — Untested Weekly/Daily: 6268.00
6268.00 (Untested Weekly / Untested Daily).
Context: This is a great buy. This would be an awesome spot. It is still about 300 points from where we are, so it is certainly possible — and I do not think it is not possible. This remains our ultimate downside target and the level where I would expect a massive first-touch reaction. If we continue to push lower, especially underneath the Weeklies, this is where we are heading.
Actionable Setup: Buy Setup: If we reach 6268.00, look for an immediate reaction and a significant pop to the upside. This level should play and play quite well, potentially producing a multi-hundred-point squeeze. If this level fails, we could push significantly lower with no meaningful support below for a very long time.
📌 Cheat Sheet – Key Levels Recap
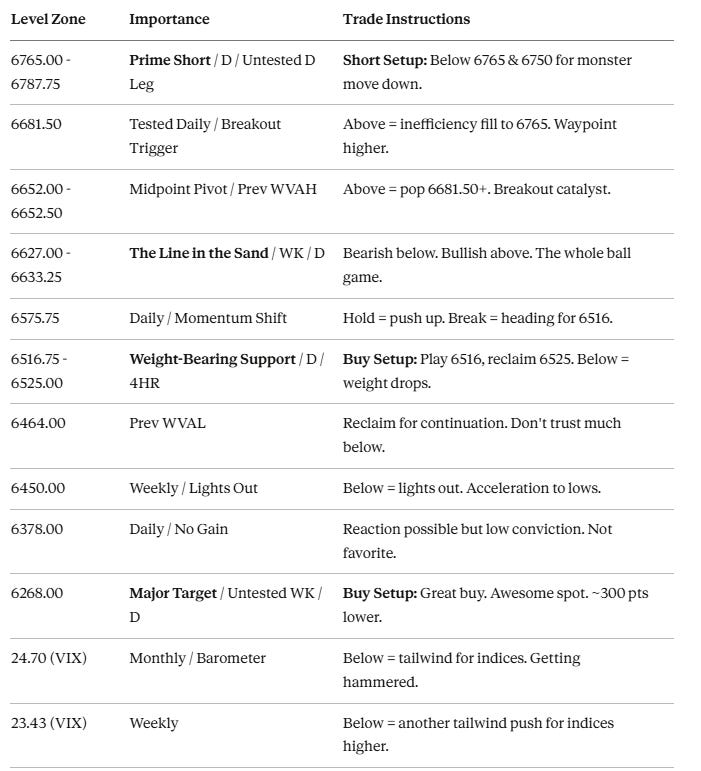
🧠 Final Thoughts
We are still extremely bearish, honestly. That pop was nice, but we are really just going to watch the 6627.00 / 6633.25 spot for above/below continuation. If they can get above it and hold, we are looking at a push up into 6681.50 and potentially all the way to the 6765.00 area where a great short is setting up — the bullish inefficiency on the Weekly TPO supports this thesis. But if they cannot get above it, we are just going to come down, and we will wait for the next leg lower or the next area of support.
The 6516.75 Daily is holding the weight up right now, and that is such a big deal for me. If we lose that, the Weeklies below start to come into play, and underneath 6450.00 it is lights out — we are heading for 6268.00, which remains our ultimate target and an awesome spot for a buy if we get there. VIX is getting hammered and sitting right at the 24.70 Monthly — if it pushes below 23.43, the indices get another tailwind for a push higher. But as long as we have not gained on the 4-Hour, the lean remains firmly to the downside.
Please look for the 10-Day Challenge Packs in your inbox — all subscribers are getting these. I challenge all of you to follow the plans and put up some numbers. It is going to be a lot of fun. I will see everyone tomorrow for the live stream at 5:00 PM ET.
Until next time—trade smart, stay prepared, and together we will conquer these markets!
Ryan Bailey, VICI Trading Solutions.
📊 TradingView Indicator String
Copy and paste the levels below into your S&P Edge Levels indicator to automatically plot today’s key levels on your chart:
6787.75|D|D
6765.00|Tested D|TD
6681.50|Tested D|TD
6652.50|P.W. VAH|GD
6633.25|D|D
6627.00|WK|W
6575.75|D|D
6518.75|4HR|4H
6516.75|D|D
6464.00|P.W. VAL|GD
6450.00|WK|W
6378.00|D|D
6268.00|WK|W

