

🧠 Current Market Context:
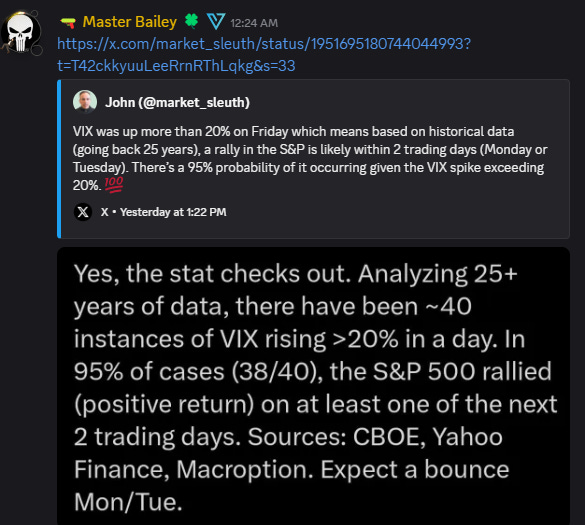
After a significant sell-off last week, retracing three weeks of action in days, we're trading around 6260.25, holding a critical daily support that previously propelled us to all-time highs. A two-week composite profile reveals a double distribution, with a weekly gap above and inefficiencies (singles at 6166.00) below, suggesting potential for both upside relief and further downside. Catalysts like NFP revisions and geopolitical tensions (e.g., Russia-related news) have spiked volatility, with the VIX surging over 20% on Friday, historically indicating a 95% chance of an S&P rally within two days (Monday/Tuesday). While bearish murmurs persist, the structure remains a healthy pullback in a bullish trend—trade the chart, prepare for rotations, and watch key levels closely. Review the video for visual context.
🎯 Detailed Actionable Trade Plan:
🔵 1) Resistance and Reversal Zone: 6298.50–6294.00 (Daily/Weekly Confluence)
This zone combines an untested daily leg to the high at 6298.50 and a weekly at 6294.25, near a two-week composite POC at 6303.25. It’s a major line in the sand for bearish continuation or reversal.
Actionable Setup (Short Scenario):
If price rallies into 6298.50–6294.00 and shows rejection (e.g., heavy selling volume or failure to hold), this sets up a swing short.
Entry Trigger: Short on rejection below 6294.00 with confirmation (e.g., 1hr candle close below 6287).
Targets: 6248.25 initially, with extension to 6154.00–6143.75 if momentum builds.
Extension Targets: Below 6248.25, target 6129.00 or deeper weekly singles at 6166.00.
Invalidation: Acceptance above 6298.50
🔵 2) Current Support: 6248.25–6240.00 (Daily/4H Support)
This area, with a daily at 6248.25 and 4H at 6240.00, held multiple times on Friday, yielding a 40-point bounce after sweeping a weekly low. It’s a critical pivot for failed breakdowns and due to its significance should be monitored heavily for above or below.
BE AWARE - If price finds acceptance below It could lead to a rapid selloff!
🔵 3) Intraday/Swing Support: 6154.00–6143.75 (HTF Confluence)
This zone includes untested dailies at 6154.00–6149.00, a weekly at 6143.75, a naked POC at 6147.25, and the prior all-time high at 6166.50. It’s a massive swing long opportunity.
Actionable Setup:
Look for a test any where from 6154 into 4143 and an acceptance of support here. A hold of this area and acceptance back above the February ATH at 6111 could lead to a squeeze much higher.
Targets: 6166.50 (prior ATH), then 6240.00–6248.25.
Extension Targets: If above 6166.50, target 6294.00–6298.50 or higher (80–100 points).
Stop Placement: Below the sweep low (e.g., 6140).
🚨 Momentum Shift Levels (Bearish Scenario):
6248.25–6240.00: A daily or 4hr close below 6240 signals significant weakness, opening the door to deeper supports. Watch for a flush.
6223.00: Major high-timeframe line in the sand—closing below confirms bearish control, targeting 6154.00 or lower. HOWEVER Acceptance above this area could push up into the daily at 6344.75 or higher into the low 6400s
📉 Lower Levels & Key Swing Areas (If Market Sells Off):
If downside momentum accelerates, focus on these critical zones:
6129.00–6119.00: Daily at 6123.00, four-hour levels at 6125.50 and 6119.00, and weekly at 6129.00. Reclaim above 6130.00 (with acceptance above the weekly at 6133.00) for a long setup, targeting 6143-6154.00+.
6098.25–6091.00: Weekly at 6098.25, daily at 6093.00, four-hour at 6091.25, and naked POC at 6092.25. Reclaim above 6110.50 triggers a long, targeting 6143.75+.
6063.00–6055.00: Monthly levels at 6063.00–6067.00, daily at 6055.00, and two-week composite value area high. Reclaim above 6093.00 for a monster move toward 6119.00+.
6026.50–6025.00: Weekly/daily at 6025.00, four-hour at 6026.50, and composite POC alignment. Though partially tested, reactive on reclaim above 6028.00.
6010.00: Four-hour level, ideal for a 15–20 point scalp on reaction, targeting 6025.00+.
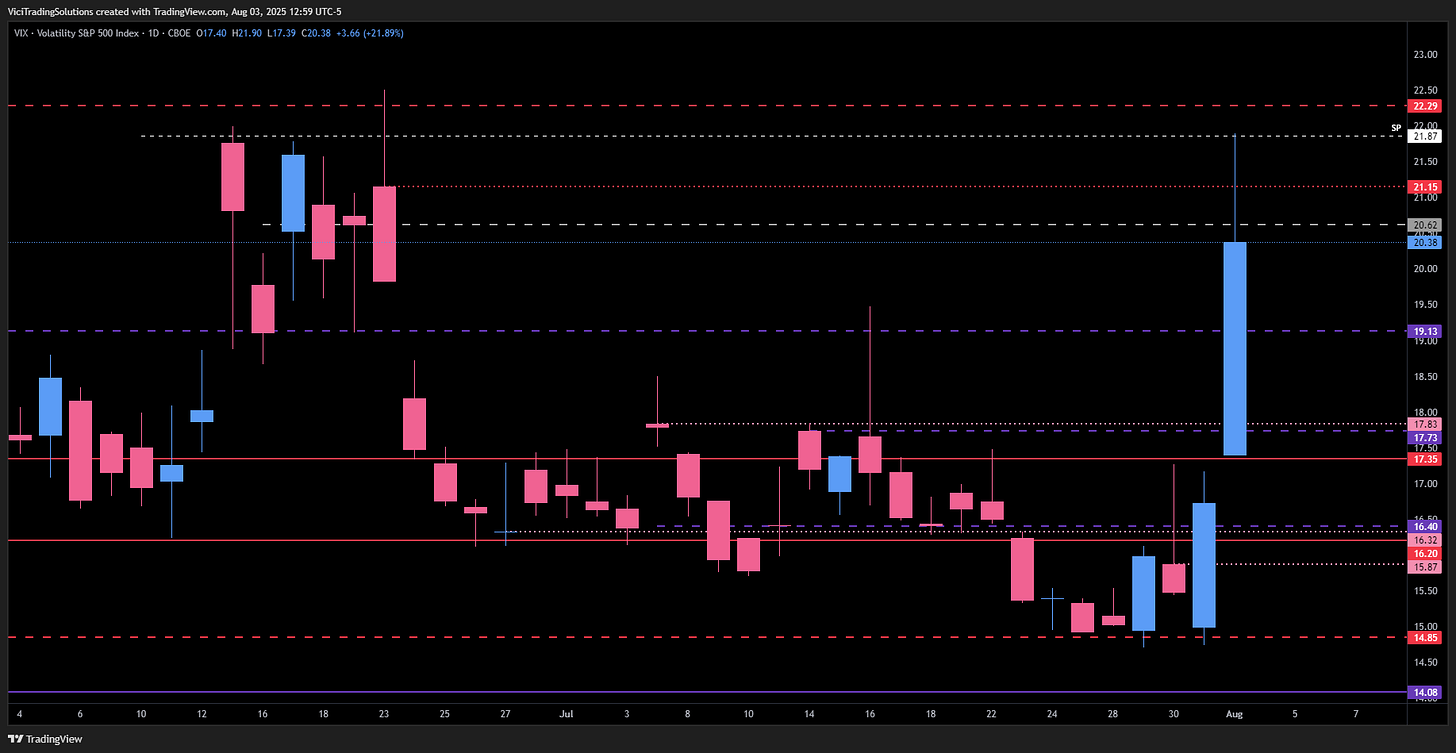
VIX Correlation Levels (Inverse Action):
VIX at 19.13: Key resistance; if rejected, expect ES upside toward 6294.00+.
VIX 17.83–17.73: Strong support zone; a hold here suggests ES downside to 6154.00 or lower.
VIX 16.40: Deeper support; if tested, ES could rally significantly (e.g., to 6344.75).


🧠 Final Thoughts:
Despite the sharp sell-off, the market remains in a bullish framework, with the 6248.25–6240.00 pivot holding firm and VIX spikes suggesting a high-probability rally early this week. Focus on resistance at 6298.50 for shorts with major daily pivot at 6320’s. Manage risk tightly below local lows and prepare for volatility-driven rotations. Watch the accompanying video for a visual walkthrough of these levels and VIX correlations to enhance your setup execution.
Until next time—trade smart, stay disciplined, and together we'll conquer these markets.
– Ryan Bailey, VICI Trading Solutions
