A transcript unlocks clips, previews, and editing.
S&P 500 Weekend Review: The 7458.50 Make-or-Break & The Path to 7527
A detailed ES, SPX & VIX plan for the week of June 15th, breaking down the 7458.50 make-or-break pivot, the 7527 high-volume-node target, and the VIX 16.20 monthly.
Welcome back everyone, and happy Sunday. It is time for the Weekend Review once again — and honestly, I was laughing when I sat down to record this, because I kept asking myself what I was even going to say. The answer is the same as it has been: we had another amazing week. It is almost comical how good it has been — it even surprises me. We have been in a Negative Gamma regime with massive moves in both the overnight and cash sessions, and we have caught every turn, every high, every low, every peak, and everything in between. A ton of people made serious money, and the room is blowing up.
Before we dig in, I want to give a big shout-out to Timmy in the room. Timmy is a course holder, a Substack subscriber, and an Inner Circle member — and he just passed his first prop firm ever. He has only been in here six to eight weeks and he has turned an incredible corner doing all the right things. He is officially a funded trader, and we will get him paid out shortly. Congratulations, Timmy — it is only up from here, brother. This is exactly the kind of life-changing stuff we are here to do.
So let’s get into it. We have had a wild, volatile couple of weeks, and we are sitting in a very critical, make-it-or-break-it area right now. I am going to keep VIX brief, then walk SPX and ES — and I have some serious plays lined up.
📧 IMPORTANT — Please Check Your Spam Folder I have been sending out follow-ups and touch-ups to all subscribers as well as everyone signed up for the SPX Edge AM Brief, and I can clearly see that many of these emails are not getting opened — they are landing in spam folders. Please take 30 seconds to check your spam/junk folder for emails from rbailey@vicitradingsolutions.com and info@vicitradingsolutions.com, mark them as “Not Spam,” and add them to your contacts so you keep receiving them in your inbox. There is valuable information in those emails — daily plan notifications, brief updates, and webinar reminders — and I want to make sure you are actually getting them. Do it now and you will thank yourself this week.
🎓 WEBINAR — Funded Trader Blueprint | Thursday at 7:00 PM I have talked to a lot of people lately who are still unfamiliar with how prop firms actually work — so I put together a presentation for anyone who wants to learn the mechanics and how to capitalize on them. This is for anyone curious about how to take $1,000 and turn it into a potential $10,000 a month in income using other people’s capital. I will walk through exactly how the prop firm industry works, the places I recommend, and how to use very small capital to potentially make serious money. It is Thursday at 7:00 PM — and even if you cannot make it live, register anyway and you will get the video. As always, I am giving away two free 50K prop firm evaluations to all registrants. Register BELOW
News: We have geopolitical headlines into Monday. Trump claims an Iran peace treaty deal was set to be signed today at some point before the market opens — I have not confirmed whether it actually got sealed. If it does get signed, the market will more than likely pop like usual. Monitor for developments into the open.
Performance: Another insane week in a Negative Gamma regime — massive moves overnight and in cash, and we caught every nook and cranny. We also called the 7234 bottom to the tick, which produced a 130-point pop off that level a few days ago.
Range: A wild, volatile couple of weeks. After the 130-point pop off 7234, the issue was we popped hard but did not actually gain anything — so we came back down, held the lower section at 7234-7200 (SPX) / 7264-7225 (ES), and are now starting to move back above. We sit right at a critical make-or-break heading into Monday.
Gamma: We remain in a Negative Gamma environment. That means money can be made both ways and ranges will be huge — great for us, but squeezes can be violent, so stay nimble.
Trend: It is a true make-it-or-break-it at 7458.50 on ES (7438 on SPX). The one thing that makes me lean slightly more bullish: they had a chance to dump this market on Friday and they chose not to. We also touched the 50-day moving average at 7273 on ES — a level CTAs and hedge funds love to buy when accumulating trending assets. I am not a moving-average guy, but when it holds in a significant area, I pay attention.
🧠 Current Market Context
The Make-or-Break & The High-Volume-Node Magnet at 7527
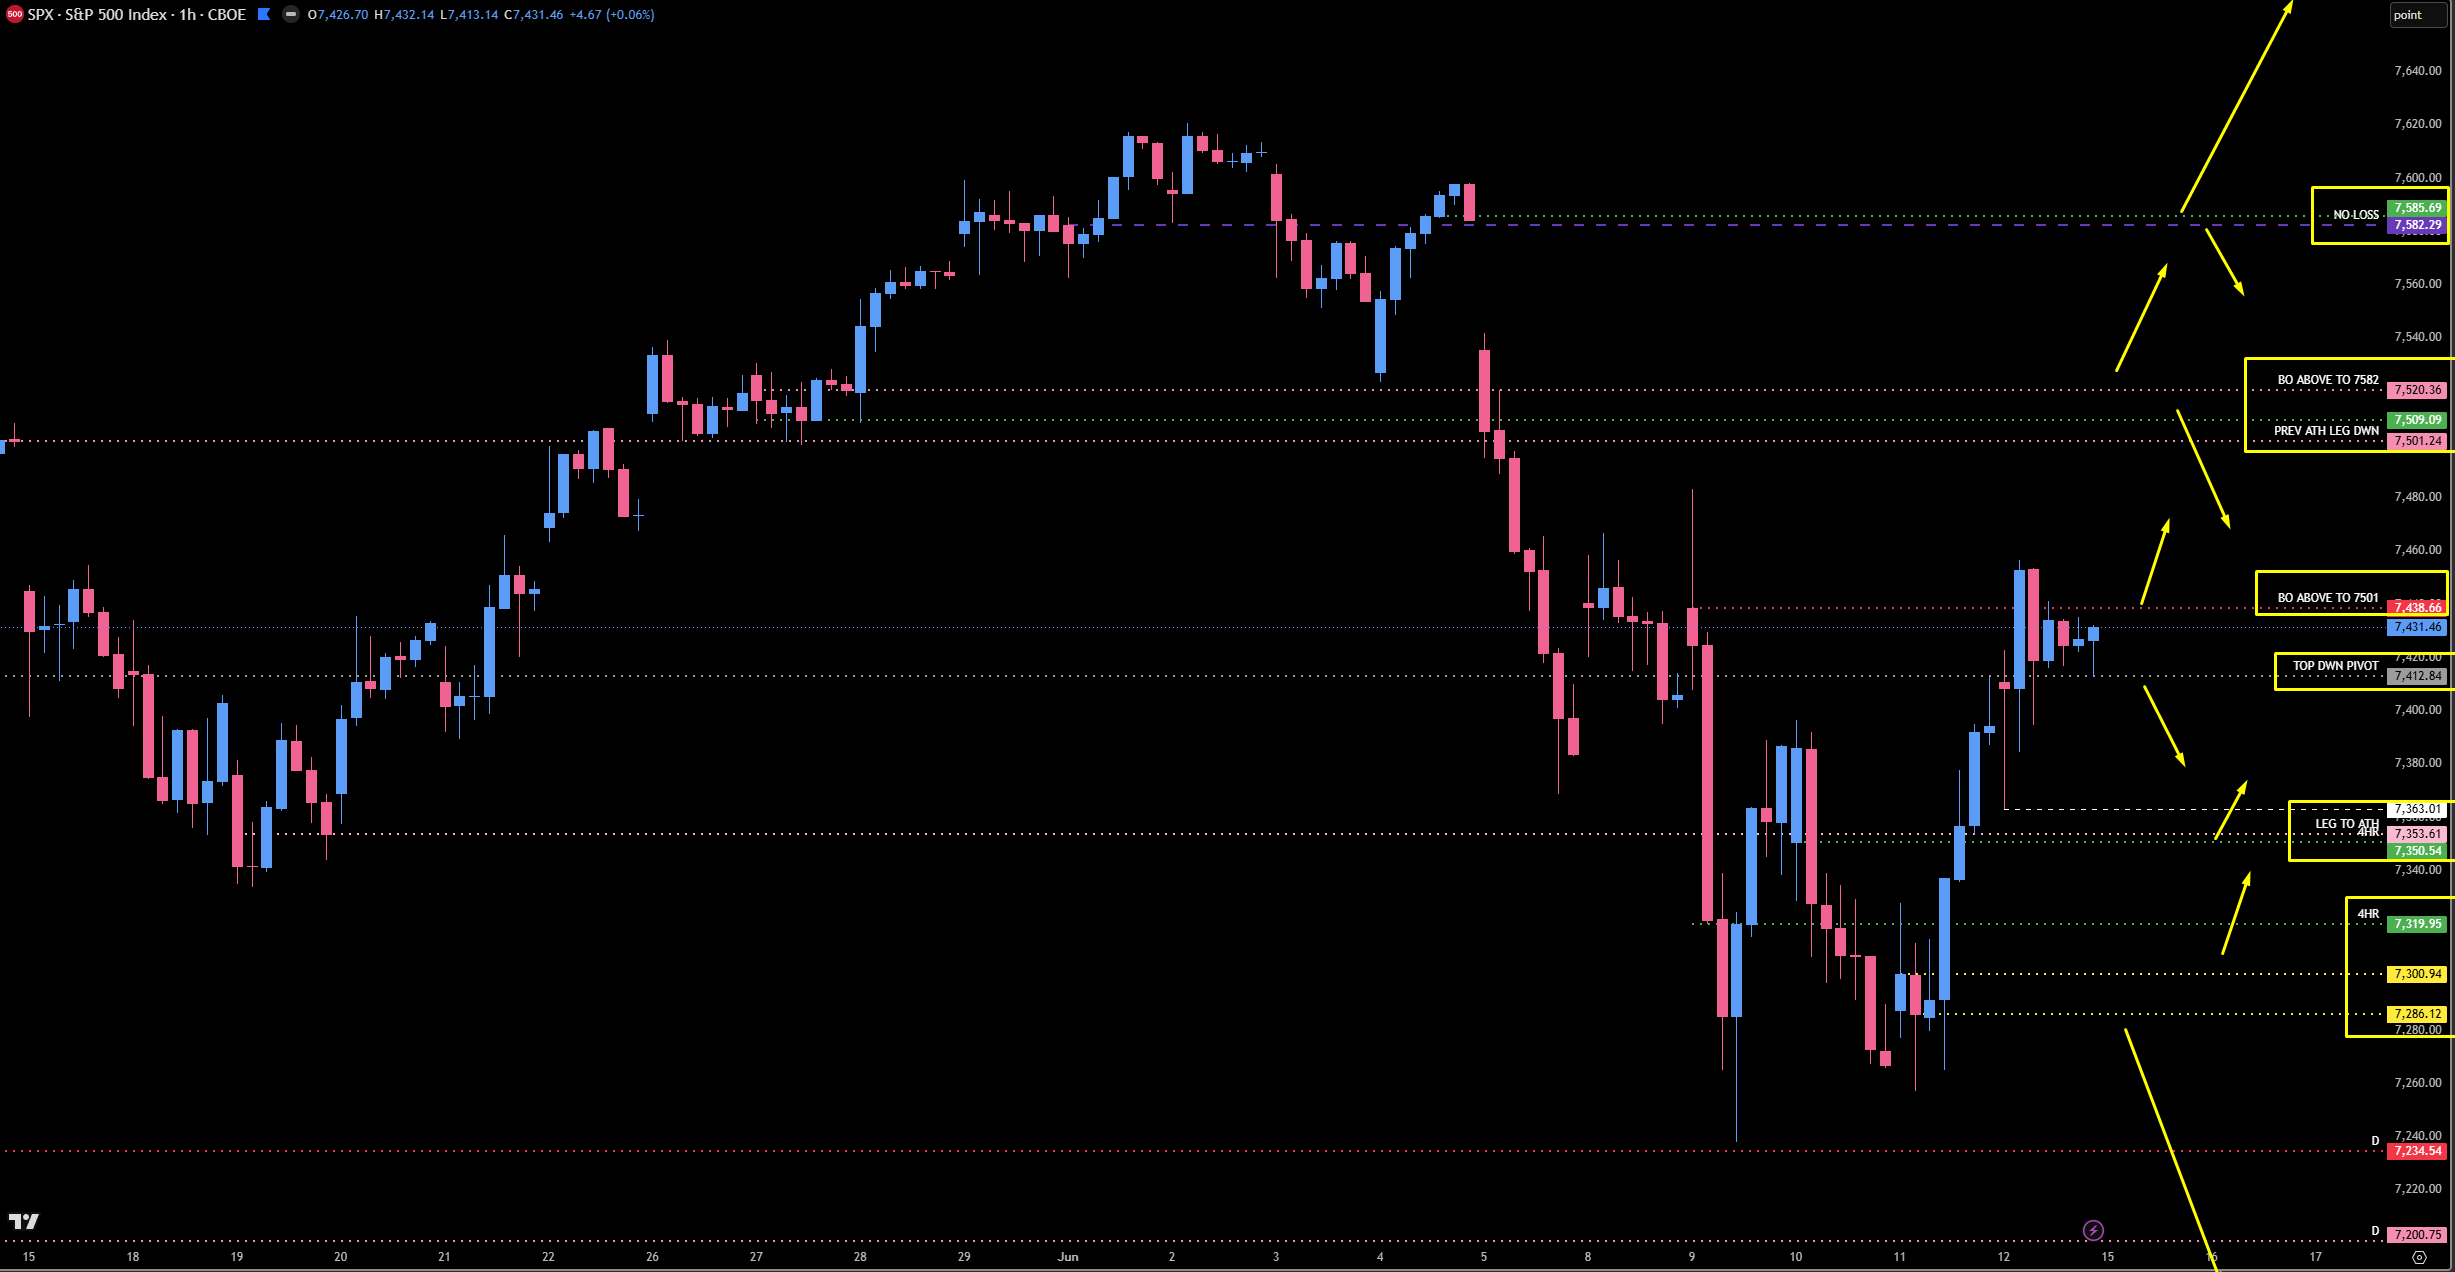
We are sitting in one of the most critical spots we have seen in weeks — a genuine make-it-or-break-it. The story is simple and clean: we called the 7234 bottom to the tick on SPX, got the 130-point pop, came back down, and held the lower section. That zone is our current leg to the all-time high, and it held. Now the entire game comes down to one level — 7458.50 on ES (7438 on SPX) — the daily leg-down level we shorted on Friday for 50 points. Above it, we fill the value area and march to the upside. Below it, we get weak and work the downside supports.
On SPX, a push above 7438 takes us into 7501 and 7520 — and 7501 is my preferred favorite up there, the neckline of a massive head-and-shoulders pattern. I am anticipating a reaction at 7501; if it smacks, get the heck out of the way, because we could roll over from there. My pivot zone is 7438 above / 7412 below — break 7412 and we have a problem, opening the door to 7353 (a solid 65 points lower), then supports at 7319 and 7300. Above 7520, there is a gap fill and then a weekly cluster at 7582-7585. But make no mistake: even on the big-picture timeframe, nothing changes — it all comes down to 7438 on SPX.
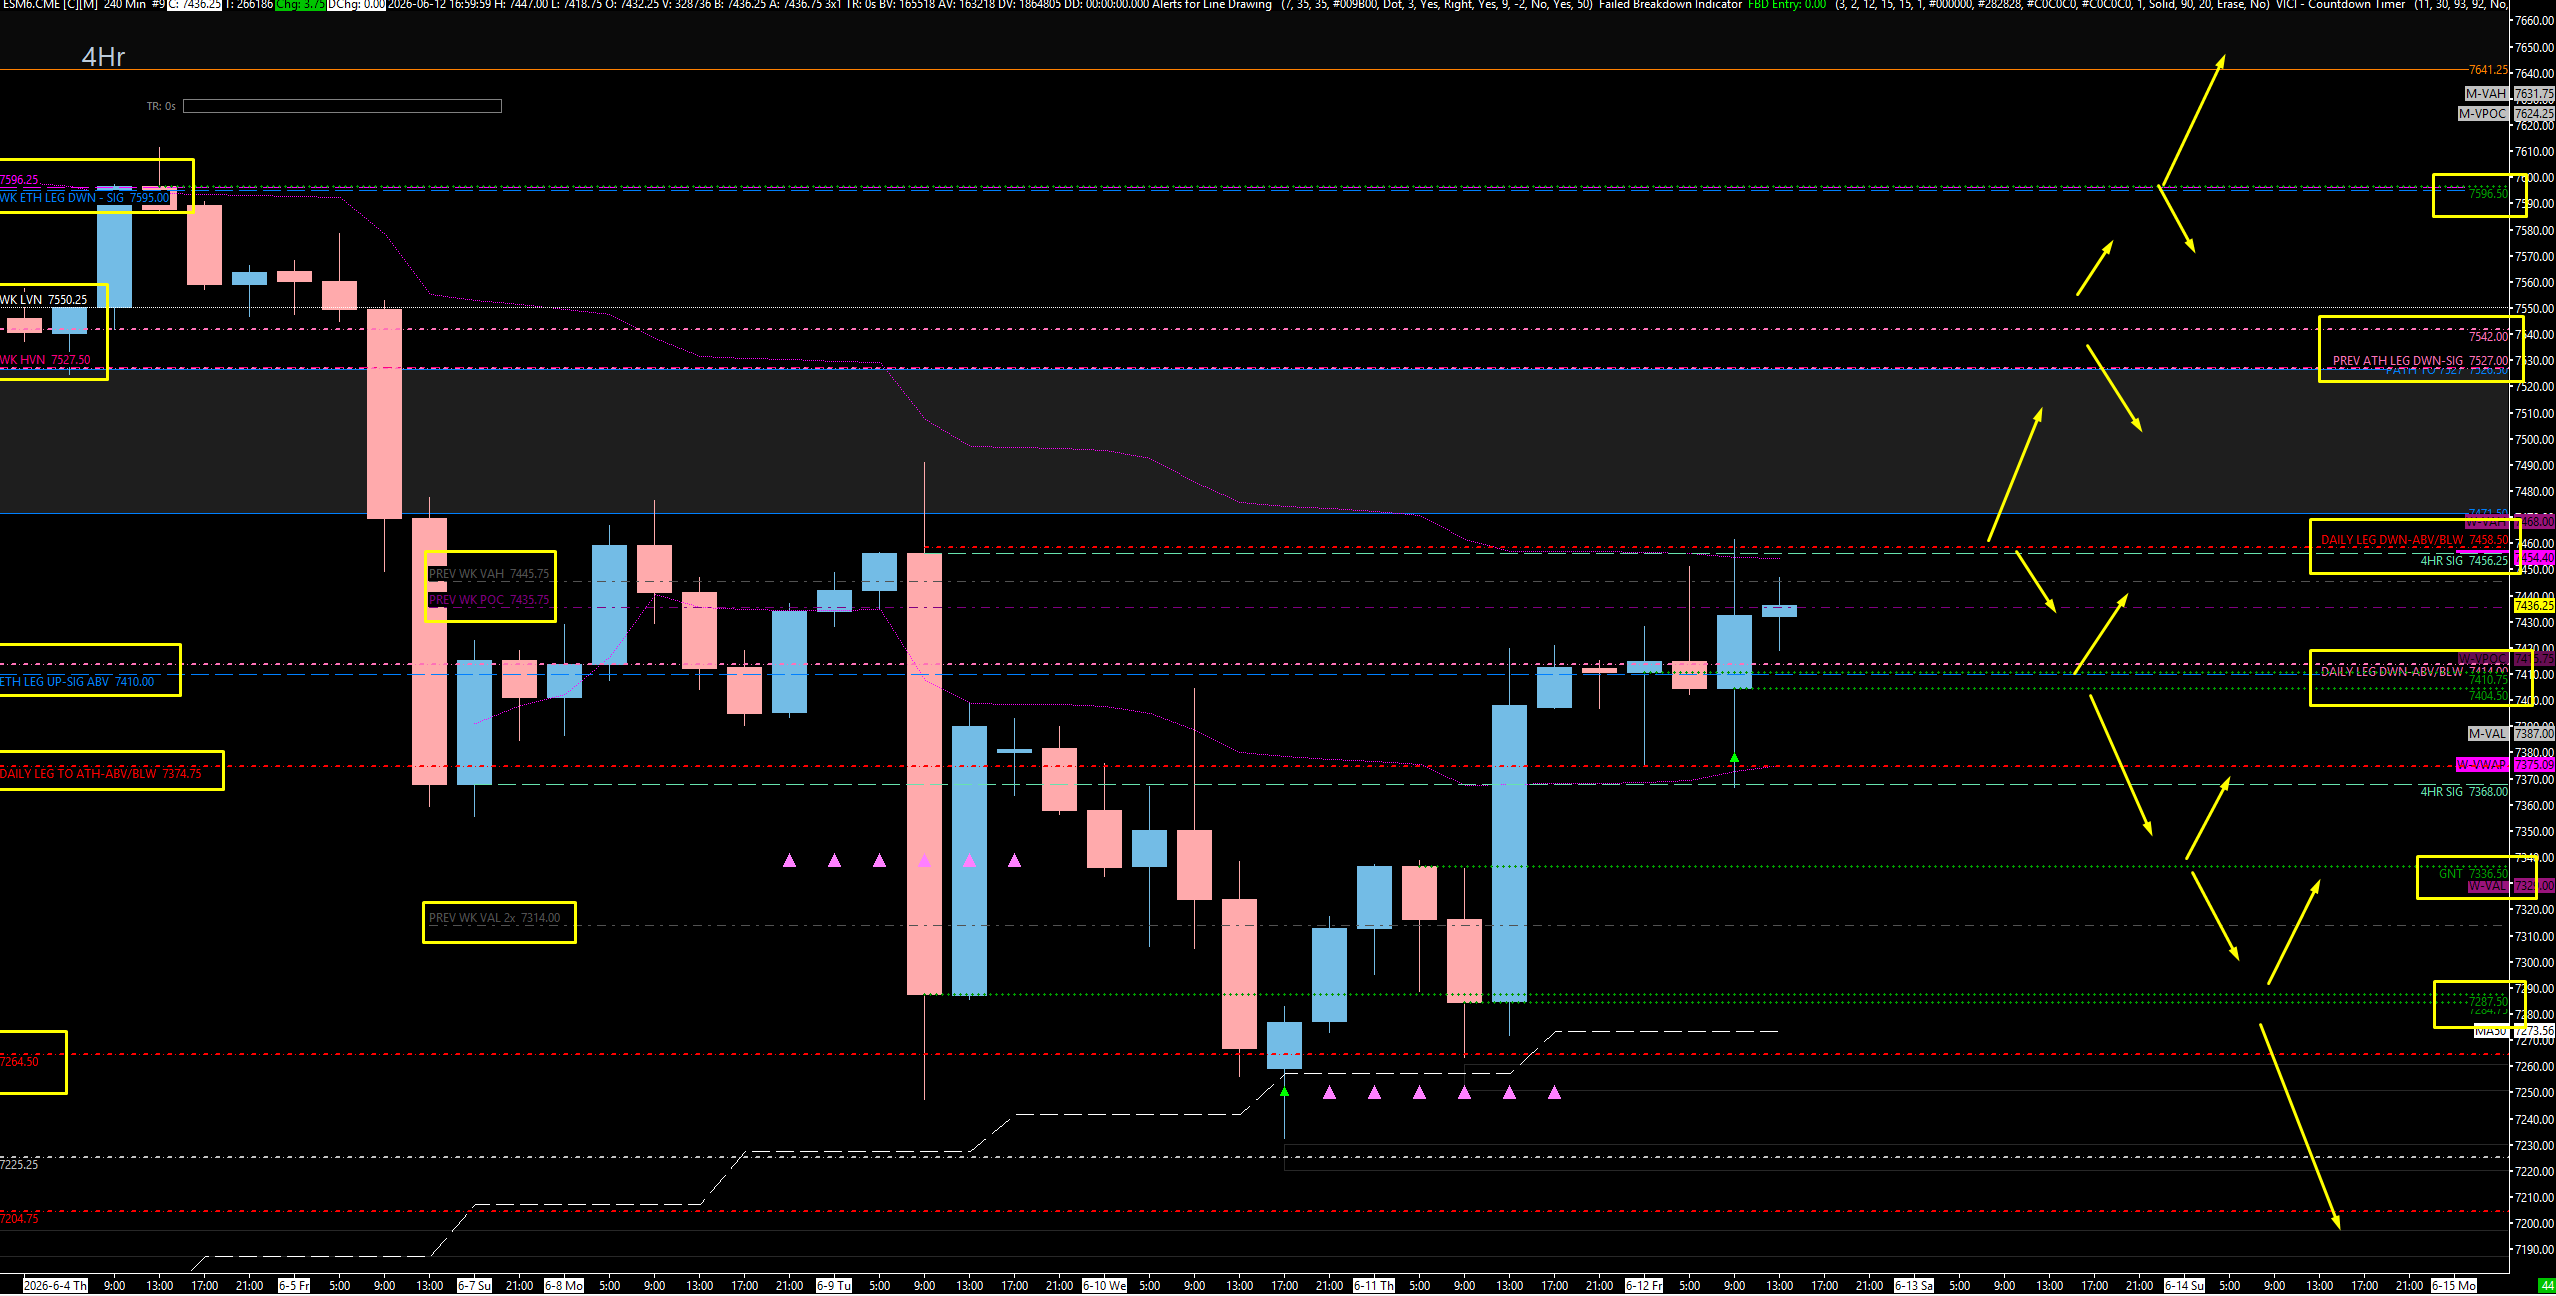
On ES, the picture is nearly identical. The weekly TPO tells a bullish story: we closed right at the previous weekly value area high with the point of control migrated all the way up — a huge bullish indication — and above the composite value-area POC from last week, where there is a lot of buying volume. There is a massive inefficiency above us that needs to be cleaned up. The standout: a massive high-volume node on the weekly timeframe sitting at 7527.50, which lines up perfectly with the big daily at 7527 I have been calling to the tick. That confluence is the magnet. The one thing that makes me a little more bullish here is the same tell as SPX — they had the chance to dump on Friday and didn’t — so above 7458.50, I think filling the value box up to 7527 is absolutely on the table.
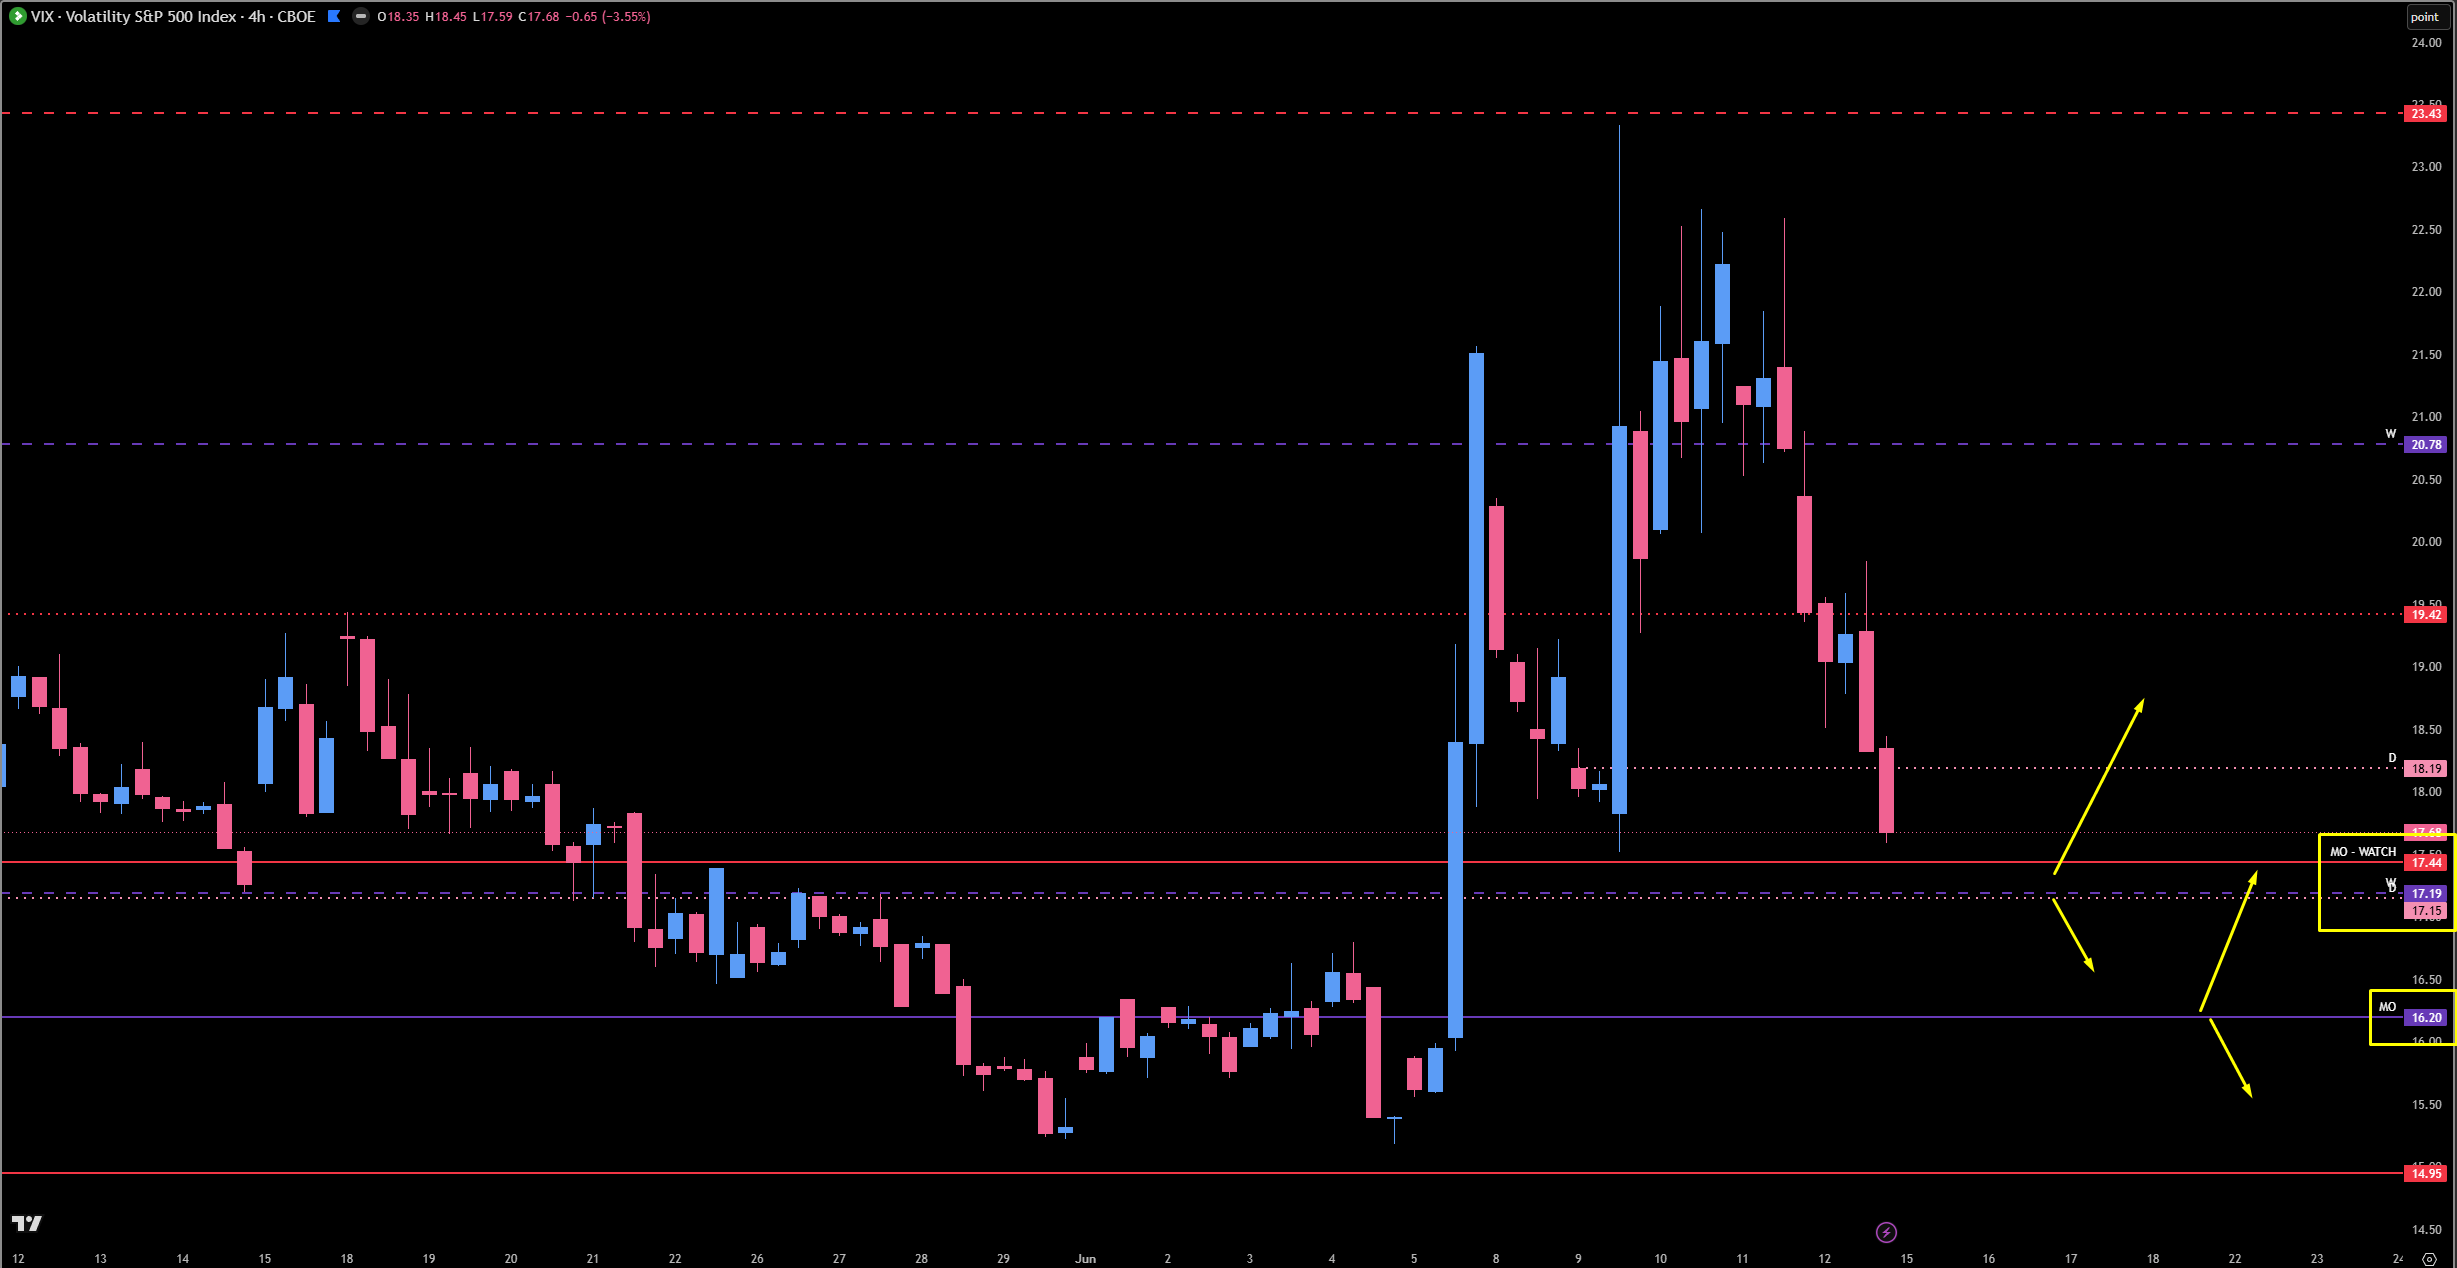
🚨 VIX Analysis: The 16.20 Monthly Pocket
Keeping VIX brief, as promised. We called this entire push up off the 14.95 monthly and the pullback into the 17.44 monthly that propelled us higher. VIX spiked into the 23.43 area and tested the upper monthly/daily zone — a monster hit — but as it comes back down now, it has not truly gained anything. There are two levels I am watching.
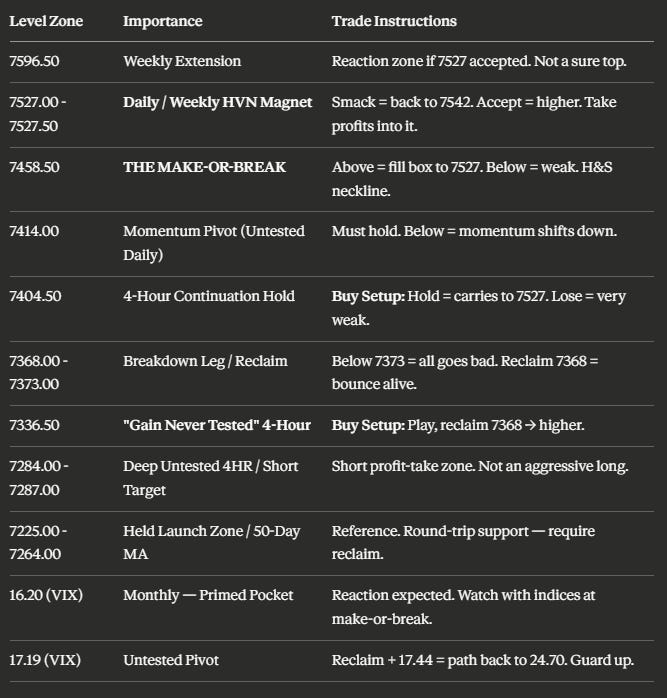
The Primed Reaction Zone:16.20 (Monthly). This looks really, really primed to me — it is right back in the pocket, a massive area of support. This is where I am more than likely looking for a reaction. I would watch for a play down into 16.20, then a pop back above.
The Untested Pivot:17.19 (Technically Untested Under the Sweep). This is still technically untested under the recent sweep, so we could come down and pop right back up through it. A pop back above 17.19 and the 17.44 monthly could send VIX back to the 24.70 area — which would put real pressure on the indices.
The Read: As long as VIX keeps drifting and stays suppressed, the indices have room to push. The 16.20 monthly is the main spot — a reaction there with the indices at the make-or-break would be the tell. If VIX reclaims 17.19 and 17.44, guard up.
🎯 Detailed Actionable Trade Plan (ES Futures)
It all comes down to the make-or-break at 7458.50. Above it, we fill the value box and target the 7527 daily / high-volume-node magnet, then potentially 7542 and the 7596.50 weekly. Below it, we need to hold 7414 and 7404.50 to keep the upside alive — under 7414, momentum shifts, and it all goes bad under the 7373 leg. The deeper buy I like is the 7336.50 4-Hour “Gain Never Tested” setup, with 7287-7284 as the last untested support and short-target zone below.
🔴 Key Resistance Zones & Setups
The Make-or-Break Pivot: 7458.50
7458.50 (Tested Daily — Current Leg Down / Head & Shoulders).
Context: This is everything for us right now. The 7458.50 daily is our current leg down — the level we shorted on Friday for 50 points, adding once we got back below the overnight high exactly as the plan called for. It is also the neckline of a massive head-and-shoulders pattern. Whether we open above or below this level on Monday is the single most important question on the board.
Actionable Setup: A push and acceptance above 7458.50 fills the value box and takes us directly up toward the 7527 magnet. We keep an eye on this level even if we come back below it. The fact that they didn’t dump on Friday leans me bullish — but this is the line that decides it.
Warning: This is a head-and-shoulders neckline. It is entirely possible we push up into the 7527 shoulder and roll over — do not marry the long. Let the level prove acceptance before committing.
The Magnet — Daily & Weekly High-Volume Node: 7527.00
7527.50 (Weekly High-Volume Node), 7527.00 (Daily — Called to the Tick).
Context: This is the magnet above the make-or-break. The big daily at 7527 lines up with a massive weekly high-volume node at 7527.50 — absolutely perfect confluence. If we get above 7458.50 and fill the value box, this is the target. But this is also a major reaction zone with that massive head-and-shoulders shoulder sitting right here.
Actionable Setup: Once we reach 7527, two things happen: either we smack off it and come back down toward the 7542 area, or we accept above it and continue higher. Keep this spot marked on your chart — once we are back above 7527, that shoulder is massive and it changes the whole upside picture.
Warning: Anticipate a reaction at 7527. Take profits into it if you are riding the squeeze up from the lower buys.
The Upside Extension: 7542.00 - 7596.50
7596.50 (Weekly), 7542.00 (Extension Target).
Context: If we smack off 7527 and continue rather than rolling, the 7542 area is the next step, with a big weekly up at 7596.50. I do not know if 7596.50 plays — I think it gets some action, but I am not sure it dumps from there.
Actionable Setup: These are upside continuation targets only relevant if 7527 is accepted. Treat 7596.50 as a reaction zone, not a guaranteed top.
🔵 Key Support Zones & Setups
The Momentum Pivot: 7414.00
7414.00 (Untested Daily).
Context: Here is an important catch — I initially had this as very much tested, but looking closely, the 7414 daily is actually untested right now currently, and I am glad we caught that. It is very much untested from the top down and will more than likely come into play at the open. Under 7414, momentum shifts to the downside.
Actionable Setup: We need to hold 7414 (and 7404.50 just below) to continue the move to the upside. As an untested daily, it should produce a reaction on first touch from the top down.
Warning: Once we get below 7458.50, this thing is in serious trouble — and below 7414, momentum shifts and we start losing support fast.
The Continuation Hold — 4-Hour: 7404.50
7404.50 (4-Hour).
Context: This is the level we truly need to hold to keep momentum moving higher. If it holds, I think it carries us all the way back up to the 7527 area. In the sequence of events, we tested it the right way — came down, pushed up, came back, and created this support. If they want to play it, we go up from here. If not, it is over.
Actionable Setup: Buy Setup: Hold 7404.50 and look for continuation up toward 7458.50 and ultimately 7527. This is the make-or-break support on the four-hour — lose it and we get very weak.
The Breakdown Leg & Reclaim: 7368.00 - 7373.00
7373.00 (The Leg — Everything Goes Bad Below), 7368.00 (Reclaim Trigger).
Context: Under 7414, momentum shifts, but it all goes bad underneath the 7373 leg — the level we have been talking about for a couple of weeks now. The 7368 reclaim trigger sits right here as the line we need to recover to keep any bounce alive.
Actionable Setup: Below 7373, the structure breaks down toward the deeper supports. On any flush, watch for a reclaim back above 7368 as the first sign buyers are stepping back in.
Warning: Below this leg, get cautious — the bullish thesis weakens considerably and we are likely heading for the deeper zones.
The “Gain Never Tested” — 4-Hour: 7336.50
7336.50 (Untested 4-Hour).
Context: This is the spot I really like on the downside — a textbook “Gain Never Tested” setup. If we lose 7404.50, this is my next favorite level. I do not think we come straight down to it; more likely we do one of these stair-step moves into it, and I do think it produces a good reaction.
Actionable Setup: Buy Setup: Watch 7336.50 to play, then look to reclaim 7368 (or reject from the 7404 area) and move higher. It does not matter which trigger — we are just trying to make money. This is a clean textbook long if we get down here.
The Deep Untested 4-Hour & Short Target: 7284.00 - 7287.00
Context: We have some untested 4-Hour support down here around 7287 and 7284, but I am not in love with these levels. If we are this far down, I am bearish as hell, so this is more of a target area for shorts than a place I am rushing to get long — even though I do think it plays.
Actionable Setup: Conditional Long / Short Target: If I am short from above, I will be taking profits into 7287-7284. I would not aggressively long this even though I think it reacts, because if we are way down here, the momentum is broken. Be very cautious once we break 7414 and ultimately 7373.
The Held Launch Zone: 7225.00 - 7264.00
7264.00 - 7225.00 (Big Held Area), 7273.00 (50-Day Moving Average — CTA Buy Zone).
Context: This is the big area we came down to and held, which launched Thursday’s move back up — the same zone I said if we held, we would go right back up, and lo and behold, we did. The 50-day moving average at 7273 sits right in here, which is a level CTAs and hedge funds love to buy when accumulating trending assets. This is where we came from — important structural context, not a primary forward buy this week unless we round-trip all the way back down.
Actionable Setup: Reference zone. If price unwinds all the way back into 7225-7264, this is the high-timeframe support that already proved itself once — but require a confirmed hold and reclaim before trusting it again.
📌 Cheat Sheet – Key Levels Recap
🧠 Final Thoughts
This is as clean a setup as I can give you, so here is the low-down skinny version: it all comes down to 7458.50 on ES (7438 on SPX). Above it, we fill the value box and target the 7527 daily / high-volume-node magnet — and once we are back above 7527, that head-and-shoulders shoulder is massive and the whole upside opens up. To keep the move alive on a pullback, we need to hold 7414 and 7404.50. Below those, we get very weak, it all goes bad under the 7373 leg, and we work down to the 7336.50 “Gain Never Tested” 4-Hour — my favorite downside buy — with 7287-7284 as the deep untested support and short-target zone.
The thing leaning me slightly bullish is simple: they had every chance to dump this market on Friday and they chose not to, and we are sitting on the 50-day moving average at 7273 that the big CTAs love to buy. But this is a Negative Gamma environment — money both ways, huge ranges, violent squeezes. So if you are riding the upside, take profits into 7527; if 7501 smacks on SPX, get out of the way. Watch VIX at the 16.20 monthly pocket for the reaction that tells you which way the make-or-break breaks. Keep it simple, respect the pivots, and let the level decide.
Please sign up for the Funded Trader Blueprint webinar — even if you already understand prop firms, register and win a couple of evaluations. I will see you tomorrow for the post-market breakdown and in the morning on the stream. Have a beautiful rest of your weekend.
Until next time—trade smart, stay prepared, and together we will conquer these markets!