

Welcome back everybody, and happy Weekend Review. It is another gorgeous Sunday outside — a little hot, but a fantastic day to be alive, so I hope you have all given thanks for simply waking up today. We had a fantastic week with some stellar performance in the room, and what really made me feel good was hearing a couple of people say last week was the best trading of their entire lives — not just one person, a couple. That tells me the process is delivering the goods and playing out exactly as it is supposed to. It is a feel-good moment for me, and it should be for you too. So let’s get right into it so we can all enjoy our Sunday. I am going to run VIX, then SPX, then finish with ES as usual.
A Note on This Week’s Market:
News: I read right before turning the stream on that there was some geopolitical development — reportedly Trump waited until after Friday’s close to do something with Iran because he was concerned about volatility. I cannot confirm whether it actually went through, I am just sharing what I saw. We will know more when the market opens in about two hours, so monitor the open carefully.
Volume: We are getting insane moves even on days with no Red Tag news — moves that would normally require a news catalyst, we are getting anyway. This is where the trade plan shines: we risk five or seven points looking for 20, 30, 50 points, and these are the conditions that hand you those outlier gains. Take advantage and let your runners run, because this will not last forever.
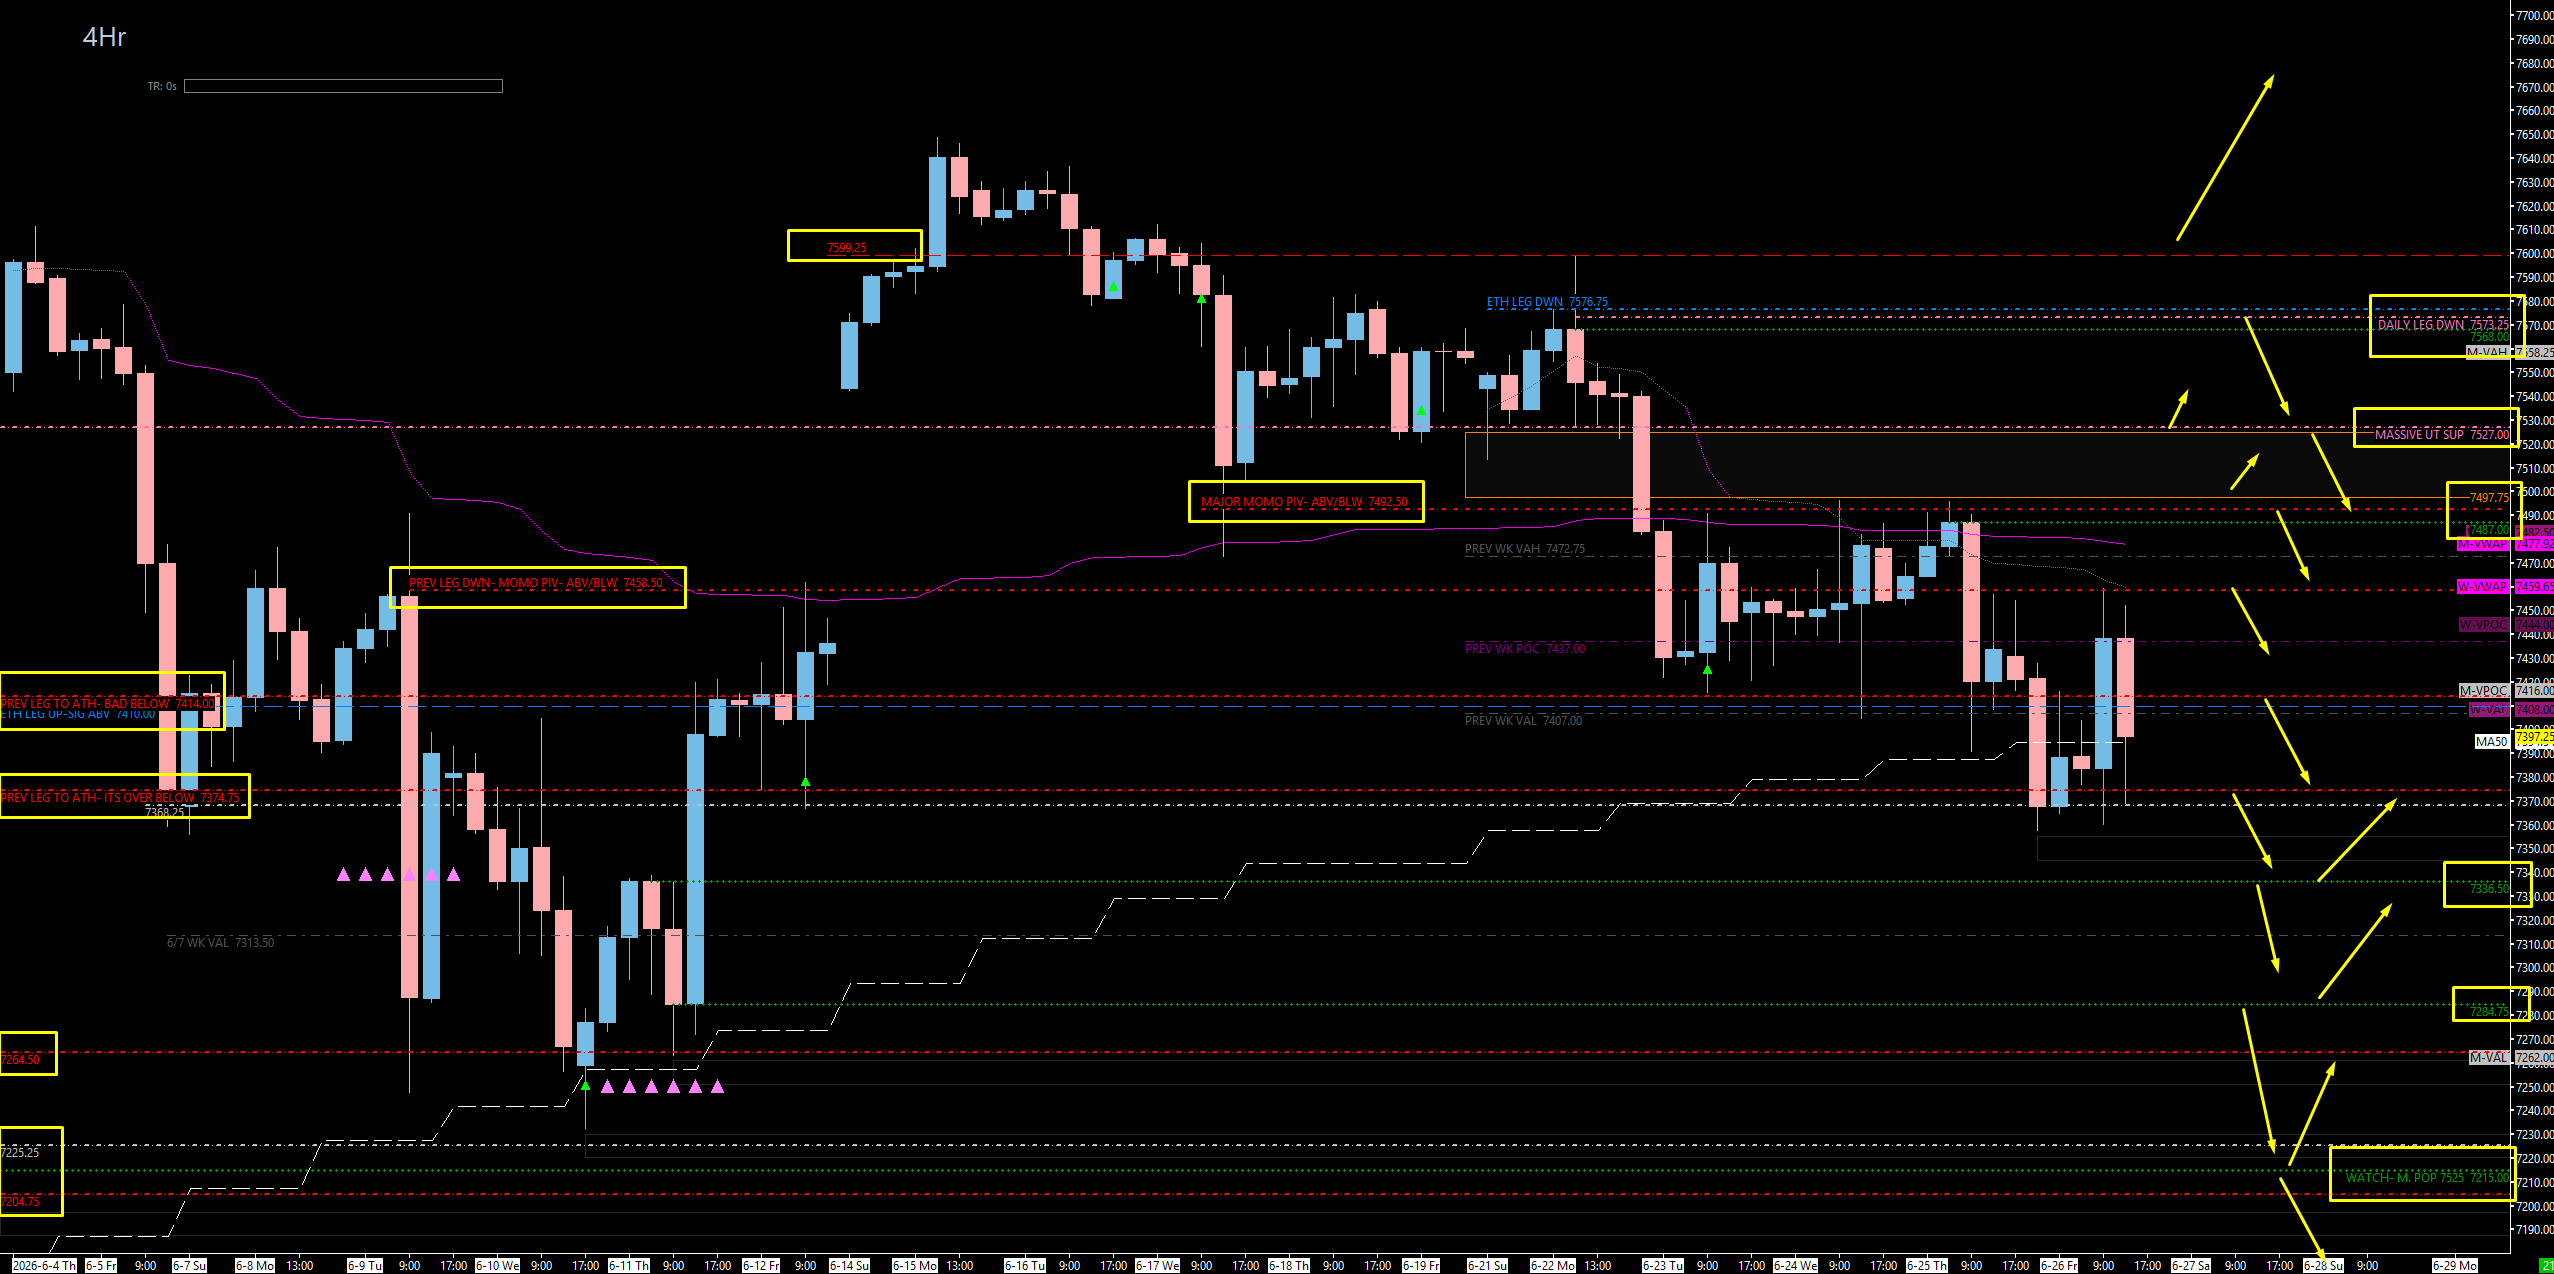
Range: The weekly TPO shows us 100% in balance — overlapping value areas with the points of control slowly drifting down, telling us we are trending down but still very much within range and still inside the previous weekly value area low. There is a massive gap up from roughly 7497 to 7525 that needs to get cleaned up, and a rotation lower targets the 7313 area where we are being sucked in.
Gamma: We remain in a Negative Gamma regime, which is producing 100-point ranges and multiple trades a day, sometimes paying 100 points each way. These are fantastic trading opportunities — soak them up. Once we flip back to Positive Gamma, it returns to the slow, grindy, one-trade-and-done days.
Trend: Down on all timeframes. We have lost support on the daily, four-hour, and one-hour — only the weekly is still holding, and they barely clung to it Friday. The process points down, with higher-timeframe targets all the way down around 7000 to 6800. I am not predicting; I am trading the chart and the structure.
🧠 Current Market Context
The Trend-Down Structure & The High-Timeframe Pull Toward 7000
Let me be upfront: the process has us down on all timeframes, we are in a Negative Gamma regime that pushed us down all week, and I trade the process — not patterns, not my bias. Thank God I trade the chart instead of my opinion, because this entire rally looked artificial and ridiculous to me and I would have been short for months. But the chart is now finally pointing down, and that changes the game for the week ahead.
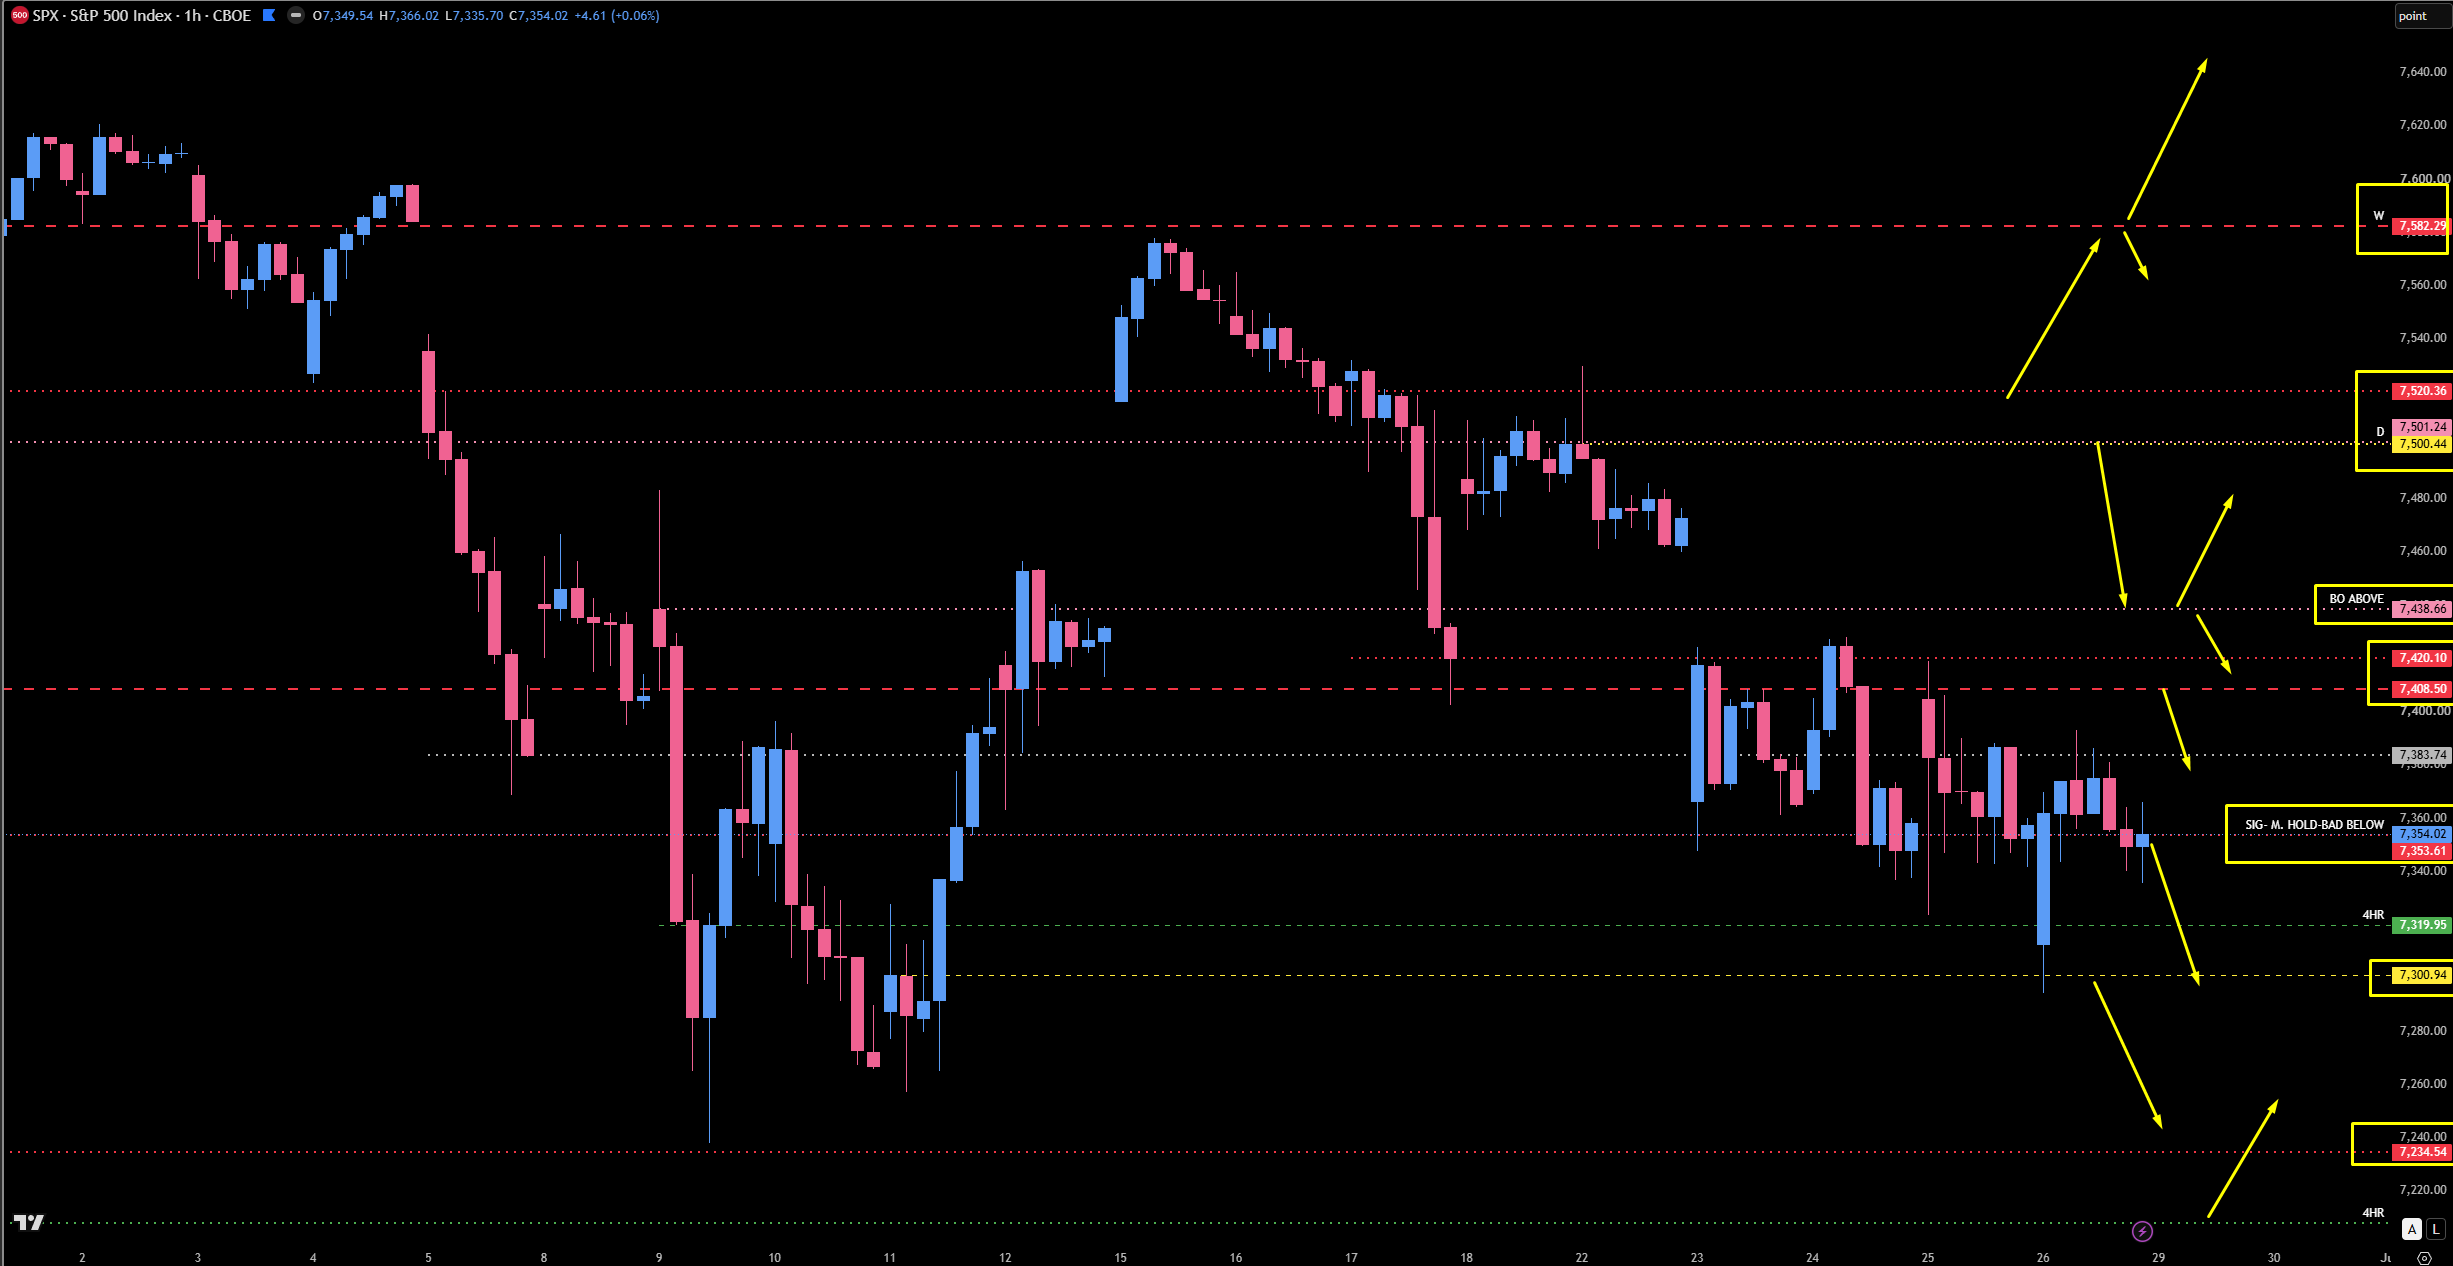
On SPX, it all comes down to the 7353 daily — the support for the all-time high. This level has been so important time and time again; they have struggled to close below it pretty much all week, clinging to life and closing above it again and again, even on Friday by barely 40 cents. This is the major level to stay above or below. We played the 7300 on Friday exactly as expected (and got an even better pop than I anticipated because we played the 7320 the day prior), opening at 7300 and catapulting up. But there is nothing left untested beneath here. Above us sits massive resistance: the weekly at 7408 and the daily at 7420 have been a huge head bump, with the daily at 7438 directly above. If they peak into 7438, I would expect a reaction and look for a slip back below 7420 and 7408 for continuation lower. But a break above 7438 takes us up to test the big 7500 — a massive leg down. Below 7300, the only thing is a four-hour level at 7200-7207 that could get a little love; beyond that, there is nothing high-timeframe and we could come down quite considerably.
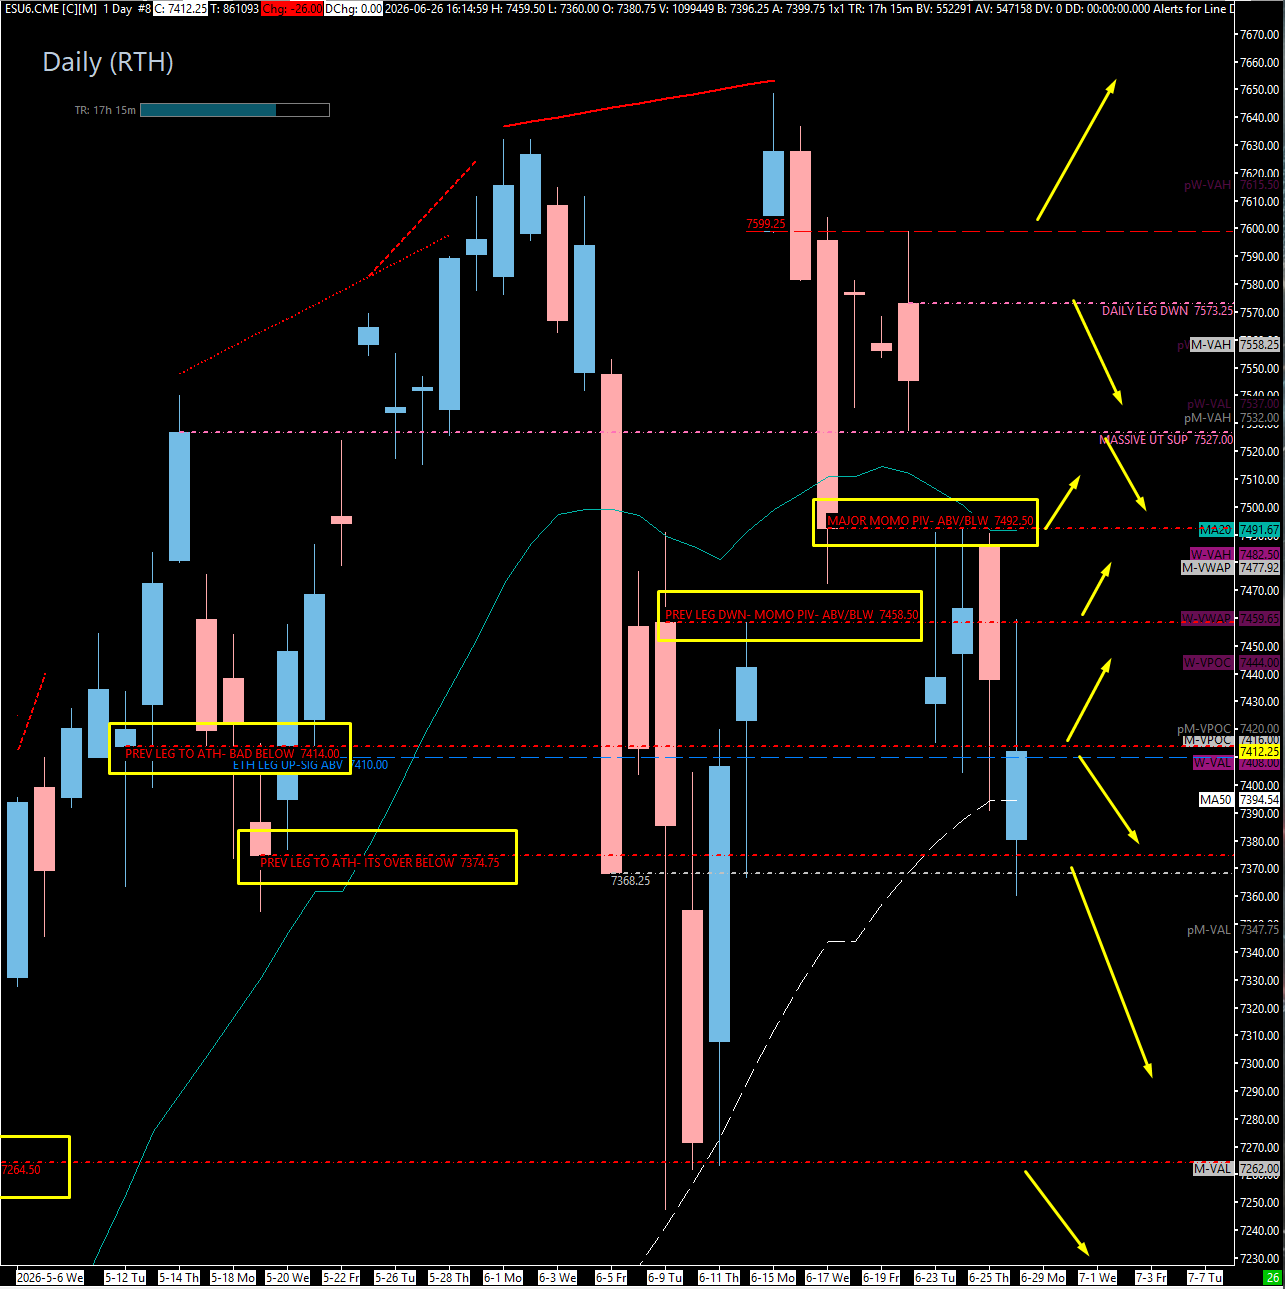
On ES, last week’s magnet down into the 7434 area and the weekly value area high played perfectly — we got sucked right in, gapped down, and have been balancing sideways ever since. We closed the week well below the June 7th weekly value area, and the longer we rotate inside this value, the higher the probability we accept value here and continue the push down. The structure is clean: we are down on the daily, four-hour, and one-hour, with only the weekly barely held on Friday — which makes me think they may even try to pop it. There is a weekly gap from 7497 to 7525 that could get cleaned up if they decide to hold the load and pop higher to smack some action before coming down. Otherwise, we rotate lower toward 7313. My higher-timeframe target is 7000 to 6800 — another 400 to 600 points lower, which lines up with the midterm seasonality I have posted about twice this year: a roughly 70% chance of an 18% pullback, with turmoil that typically starts around May or June. Do I think we get the full 18%? I do not know — I just play the chart. But if we push down into 7000-6800, we are in a prime swing-long buying area, so this is something to be excited about, not scared of.
🚨 VIX Analysis: The 18.19 Make-or-Break
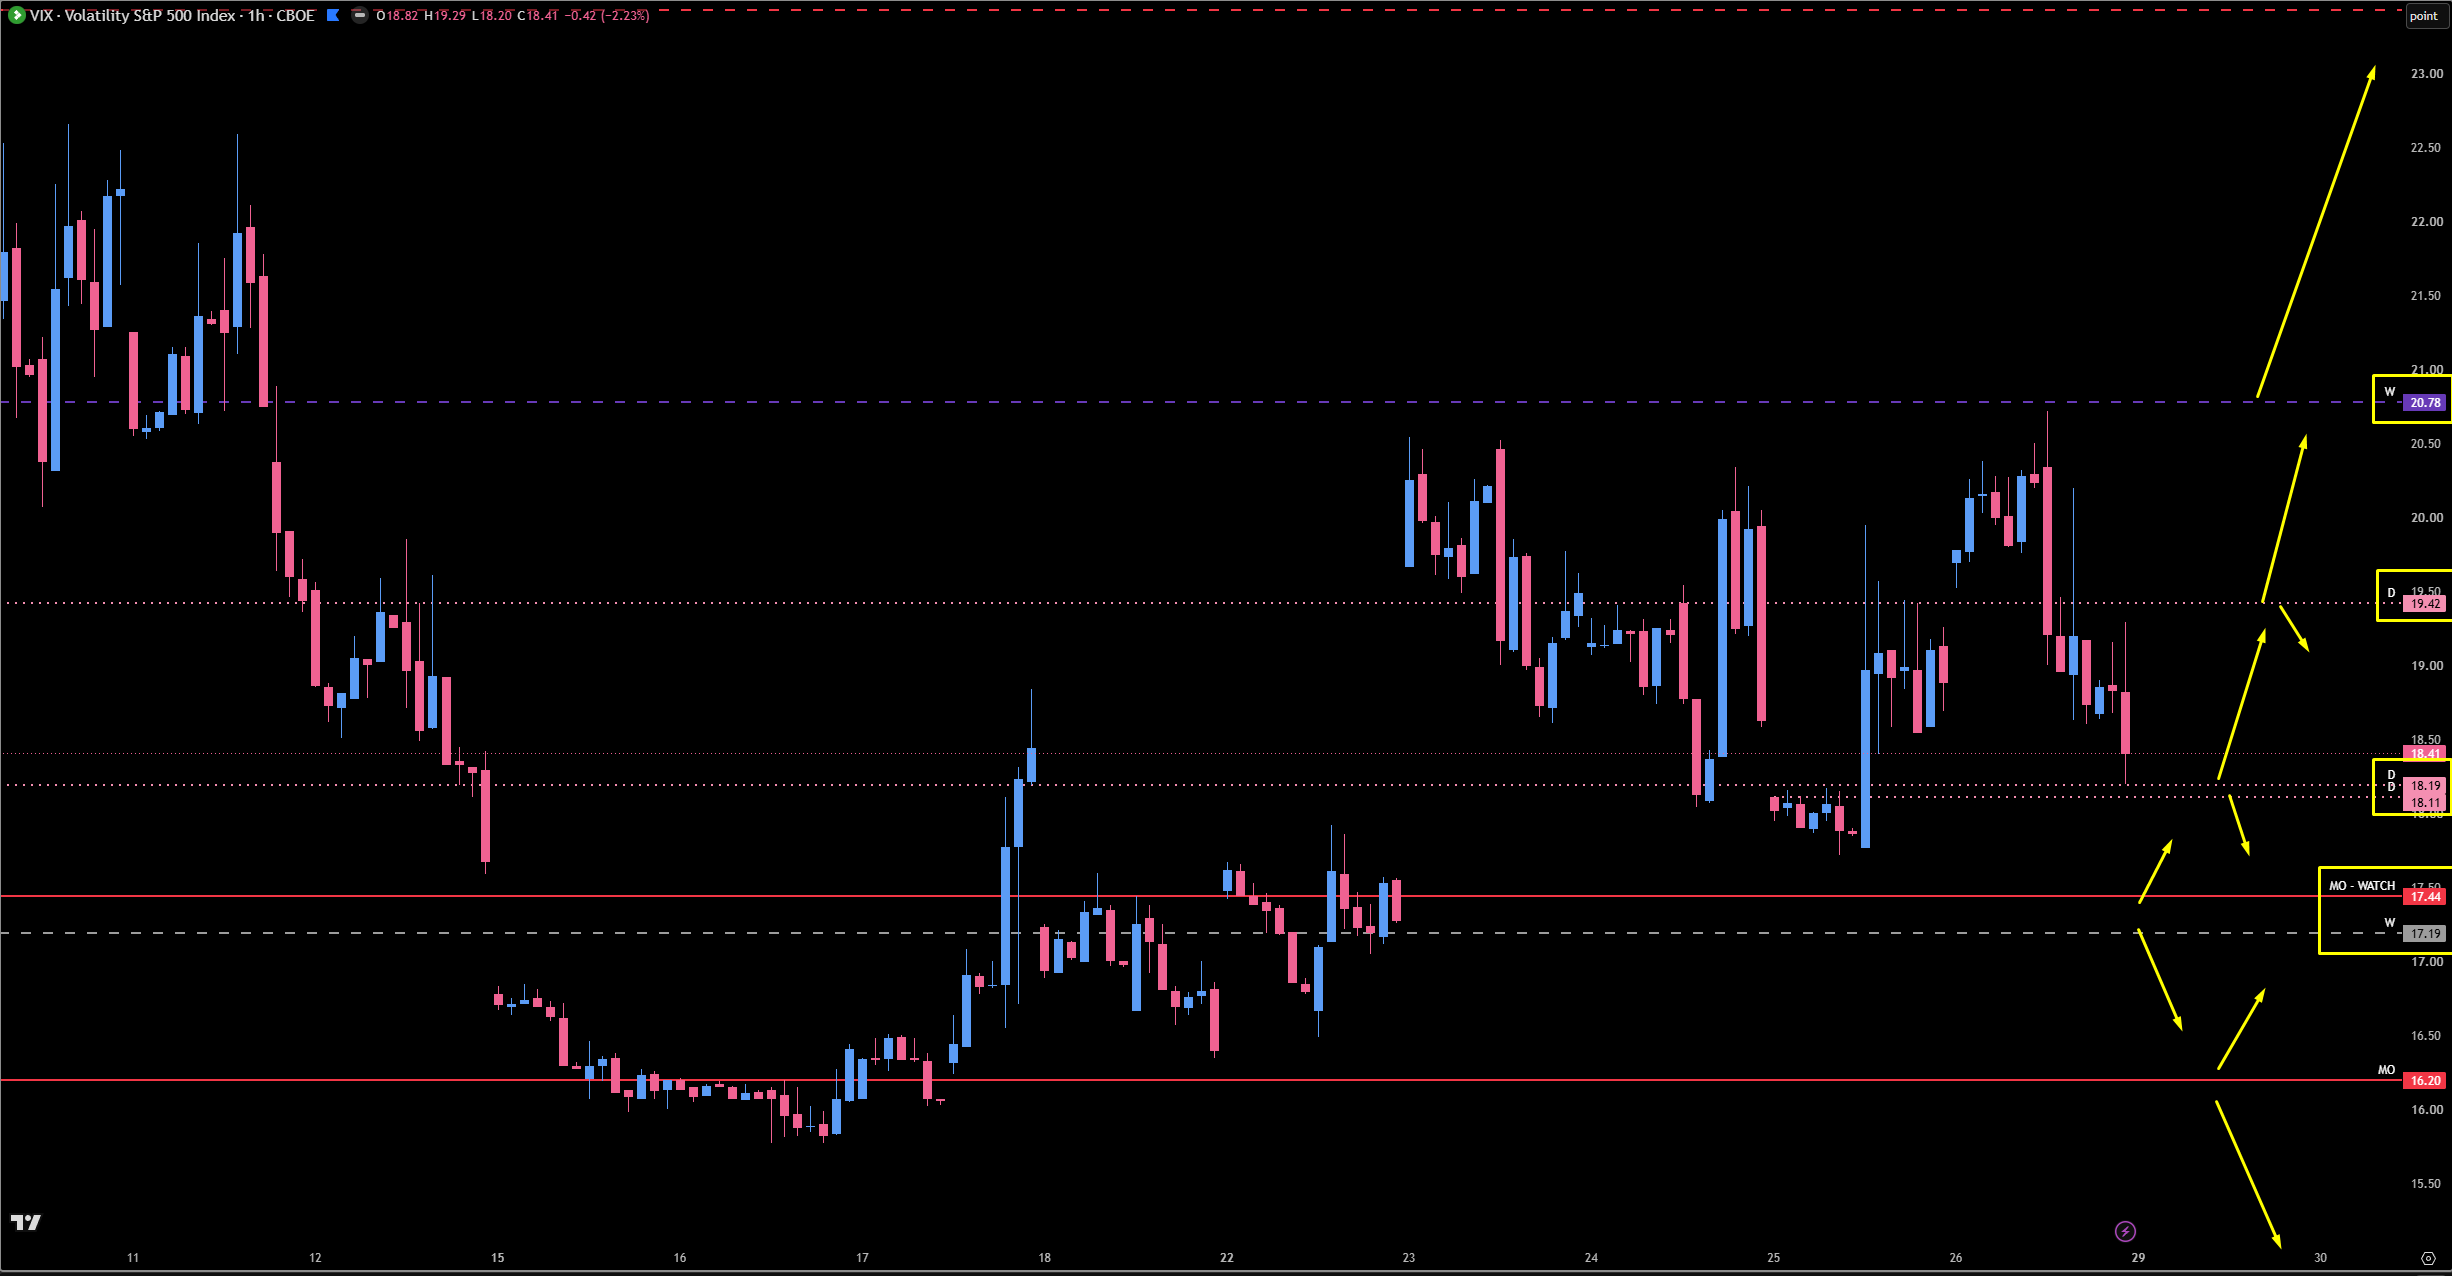
VIX is right now smacking off the 20.78 monthly we have talked about many times — almost a perfect touch on Friday before bleeding off all day. Interestingly, ES also closed down, so we did not get the usual inverse relationship, which is something to note. As VIX comes back down, it has dropped into a big, highly confluent daily area, and this is the decision point for Monday.
The Make-or-Break: 18.19 - 18.11 (Daily). This is a highly confluent area and my big make-it-or-break-it for VIX. I am actually expecting this zone to get some love. If VIX holds 18.19-18.11 and pops back up, it continues to traverse higher — taking a pit stop at 19.42 as a head bump or decision point. The one caveat: I always play the higher-timeframe rules, and we are coming off a weekly down to a daily, so technically the weekly is in control. But I like this spot.
The Pit Stop: 19.42 (Decision Time). If VIX holds the make-or-break and pops above 19.42, it starts running — and we could come all the way up into the 24.70 monthly and the 25.78 daily if they want it. That would be real pressure on the indices.
The Downside Gap: 17.44 (Monthly). If VIX bleeds underneath 18.11, this is the next major area I am watching. There is a nice little gap here that has not been filled, and it is clearly untested from the top down, so I do think it could get another reaction. Below 18.11, this is the next decision — and a softer VIX here would give the indices a little breathing room.
🎯 Detailed Actionable Trade Plan (ES Futures)
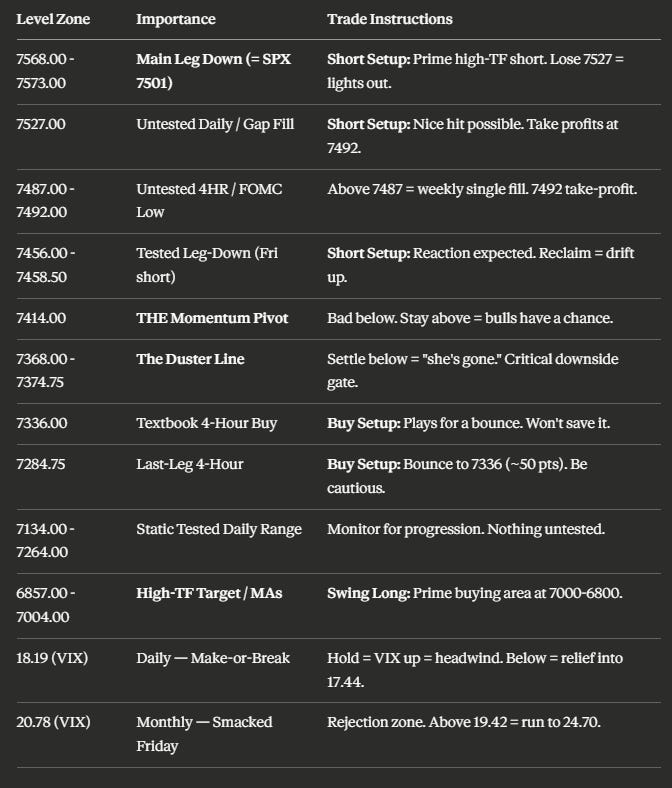
The process points down, so this week is about shorting the rallies into tested resistance and respecting the one level holding everything up: 7414. Stay above 7414 and the bulls quote-unquote “have a chance”; settle below 7374.75 and, in my words, she’s a duster. Above us, the reclaim ladder of tested dailies (7456 / 7458.50 / 7492) leads to the only untested daily up here at 7527 and ultimately the main leg down at 7573. Below, the 7336 textbook four-hour and the 7284.75 last-leg four-hour are the bounce-buy candidates before we get into the high-timeframe target zone toward 7000.
🔴 Key Resistance Zones & Setups
The Momentum Pivot: 7414.00
7414.00 (Tested Daily — Big Momentum Shift Pivot).
Context: This is the level holding the whole thing up right now. We talked last week about how they would defend 7414 with their life, and they did — we played it one, two, three times on the sweep for the long and used it as our momentum pivot from both sides. They even played it from the backside on the way down. They pushed below it in Friday’s Globex session and have been flirting with it, but were unable to close back above it Friday. This is the really important context: it says “bad below” on my chart for a reason.
Actionable Setup: Stay above 7414 and the bulls maintain a chance at a pop. A clean settle below it confirms the downside lean, and we look toward the duster line below. Use this as your primary above/below pivot for Monday.
Warning: A confirmed acceptance below 7414 opens the door toward 7374.75 — and below there, it is essentially over.
The Tested Leg-Down Cluster: 7456.00 - 7458.50
7458.50 (Tested Daily), 7456.00 (Tested Daily — Friday’s Short / High of Day).
Context: This is the leg-down zone we shorted on Friday for Free Alpha Friday — it just so happened to be the high of the day, which gave me a good laugh after the close. I was not in love with shorting 7456 because it is a tested daily, but we knew it was significant, and the trigger was clean: let it play and get back below the overnight high. If we get above 7414, this 7456-7458.50 cluster is the next tested resistance we have to deal with.
Actionable Setup: Short Setup: Expect a reaction here on any push up. These are tested, so do not expect them to hold forever — but with their importance, look for a rejection or, on a reclaim/acceptance above, a drift up to the next level. The reclaim above is what takes us higher.
The Untested 4-Hour & FOMC Low: 7487.00 - 7492.00
7492.00 (Tested Daily — FOMC Low / “The 92”), 7487.00 (Untested 4-Hour).
Context: The 7492 is the FOMC low — “the 92” — which we played on both Thursday and Tuesday, and you can see how many times they have touched it on the daily. It is tested, but hugely important. The 7487 four-hour above it is genuinely untested; a push above 7487 cleans up the big weekly single we left and sends us up to test the levels again.
Actionable Setup: This is a key take-profit zone for any shorts riding down, and a reaction zone on the way up. Above 7487, watch for the weekly single fill; 7492 is where I would take profits on shorts given how many times it has played.
The Gap-Fill Untested Daily: 7527.00
7527.00 (Untested Daily — Gap Fill).
Context: We truly have nothing left untested on the daily timeframe until we come all the way up to 7527, which fills in the weekly gap. I think this area could get a really nice hit. From here, it is roughly 30-40 points down to the 7492 FOMC low, and a push above 7527 opens the door to the main leg down above.
Actionable Setup: Short Setup / Take Profits: If we get a pop into 7527, you have to take profits down at 7492 — Lord knows how important that level is. A push above 7527 takes us up into the 7568-7573 main leg down.
Warning: Once above 7527, momentum shifts a little in the favor of the bulls — be cognizant. I will play it but take most of my profits around 7527.
The Main Leg Down: 7568.00 - 7573.00
7573.00 (Daily — Main Leg Down / = SPX 7501), 7568.00 (4-Hour — Leg-In Highs).
Context: This is the big end — the true daily leg down at 7573, the same short I showed you on SPX at 7501, with the four-hour leg-in highs at 7568 just beneath. These two levels — 7527 and 7573 — are the ones that will make all the difference, even if they do manage to pop it back up here.
Actionable Setup: Short Setup: This is the prime high-timeframe short location. If price grinds all the way up here, this is the spot to fade for the continuation of the downside move. But if they play 7573 and lose 7527 on the way back down, it is lights out — we come right down to 7492, and the 7492 will more than likely give it up.
🔵 Key Support Zones & Setups
The Duster Line: 7368.00 - 7374.75
7374.75 (The Leg to All-Time High — “She’s a Duster” Below), 7368.00 (Tested Daily).
Context: This is the line in the sand for the bulls. The 7374.75 is the leg to the all-time high, and the 7368 daily right with it has played so many times — we held it on Friday and played it for the pop-up. But once we actually settle below this level, in my words, she’s a duster — she’s gone. We have to be really careful underneath 7374; it is basically over with after that, and the chart just comes straight down.
Actionable Setup: As long as we hold 7368-7374.75, the bulls technically have a chance and we can play it for pops. A confirmed settle below flips this whole thing into the high-timeframe downside scenario toward 7000.
Warning: Below 7374, it is essentially over. This is the most important downside gate on the board — respect it.
The Textbook 4-Hour Buy: 7336.00
7336.00 (4-Hour — Textbook Setup).
Context: Directly below the duster line sits the 7336 four-hour — a textbook setup I teach in my course, and a level I have talked about for some time and like a lot. I think it plays. Do I think it saves the whole thing? Probably not — but I do think it produces a solid bounce.
Actionable Setup: Buy Setup: Look for 7336 to play for a long. Realistically it will struggle to get back above 7374 at that point, so treat it as a bounce trade with disciplined targets, not a trend reversal. We will deal with the granular execution when Monday opens.
The Last-Leg 4-Hour: 7284.75
7284.75 (4-Hour — Last Leg to All-Time Highs).
Context: This is the last and lowly four-hour down here — the last leg that took us to the all-time highs. I do think it plays, and fairly decent, but more than likely it only brings us back up to about 7336 — still roughly 50 points, so a great long. I would be very cautious trying to get any further than that, because once we are back below it, this becomes a major resistance area.
Actionable Setup: Buy Setup: Play 7284.75 for a bounce targeting 7336 (~50 points). Take profits into resistance and do not overstay — below this zone, the structure is firmly broken.
The Static Tested Daily Range & High-Timeframe Targets: 6857.00 - 7264.00
7264.00 - 7134.00 (Static Tested Daily Range), 7004.00 (Start of the Meat), 6857.00 (200-Day & 100-Day Moving Average Zone).
Context: Once we lose 7284.75, we really have nothing else holding this up, and we could come down considerably. There is a lot of static support ranging from 7264 down to 7134, but it is all tested dailies with nothing left untested — we use these to monitor for progression above and below, not as hard floors. We do not get into the meat until we hit 7004 and ultimately 6857, where the 200-day and 100-day moving averages and the bigger targeted areas live. My primary high-timeframe target is 7000 to call it 6800 — another 400 to 600 points lower.
Actionable Setup: Conditional Long (Swing): This is the prime area we were originally looking to play for a pullback before they just kept ripping higher. If we push down into 7000-6800, that is the prime swing-long buying area. Nothing to be scared of — be excited about the chance to get swing long down there. Monitor the tested dailies for progression on the way down.
📌 Cheat Sheet – Key Levels Recap
🧠 Final Thoughts
I am not a market-prediction guy, so let me be clear about what I am and am not saying. The process has us down on all timeframes, we are in a Negative Gamma regime printing 100-point ranges, and the structure points lower. I understand what the process is telling me and what the targets should be based on what is tested and untested — and right now those higher-timeframe targets sit down around 7000 to 6800, another 400 to 600 points away. That lines up with the midterm seasonality and the 70% historical probability of an 18% pullback. I do not know if we get the whole move, and I am not trading my opinion — thank God, because my bias would have had me short for months. I am just trading the chart.
The framework is simple. 7414 is the pivot holding everything up — above it the bulls have a chance, and we have a reclaim ladder of tested dailies at 7456 / 7458.50 / 7492 leading to the only untested daily at 7527 and the main leg down at 7573, which is the prime short. Below, 7374.75 is the duster line — settle beneath it and she’s gone. The bounce-buys are the 7336 textbook four-hour and the 7284.75 last-leg four-hour. And the big picture: if we push down into the 7000-6800 zone, do not be scared — be excited, because that is where we get to look for a swing long. We are up so much over the past few years that a healthy flush there is nothing to fear.
Take advantage of this Negative Gamma volatility while it lasts — these are the conditions where you beef up the account with outlier gains. The Inner Circle is absolutely on fire right now, with multiple people stacking payouts and crushing it. Stick to the process, take the good levels, and let your runners run. We have a full week to make some cake, and we are going to do it.
Until next time—trade smart, stay prepared, and together we will conquer these markets!
Ryan Bailey, VICI Trading Solutions.
📊 TradingView Indicator String
Copy and paste the levels below into your S&P Edge Levels indicator to automatically plot today’s key levels on your chart:
7573.00|D|D
7568.00|4HR|4H
7527.00|D|D
7492.00|Tested D|TD
7487.00|4HR|4H
7458.50|Tested D|TD
7456.00|Tested D|TD
7414.00|Tested D|TD
7374.75|Tested D|TD
7368.00|Tested D|TD
7336.00|4HR|4H
7284.75|4HR|4H
7264.00|Tested D|TD
7134.00|Tested D|TD

