

Welcome back, everyone. It is August 30th, and as we come into the final stretch before the Labor Day holiday, it's time to see what's on deck.
Last week, we made another new all-time high, and our plans have been ridiculously on point. Congratulations to everyone who has been following along. Now, I have some really interesting new information to share, so let's get right into it.
🧠 Current Market Context: The "Golden Cross"
Before we get into the levels, we have to talk about a monumental development for this bull cycle. On August 18th, we got a 100-day over 200-day moving average "Golden Cross." This is a huge, long-term bullish signal that has only happened 15 times in the last 45 years.
Historically, this signal has a 93% chance of leading to positive returns over the next 1-2 years, with average gains between 15% and 28%. This is just another confirmation of our long-term thesis: with unprecedented stimulus and a devaluing dollar, assets have no choice but to go up.
(TO SEE THE WHOLE POST WITH STATISTICS ON THIS TRADE SETUP CLICK HERE)
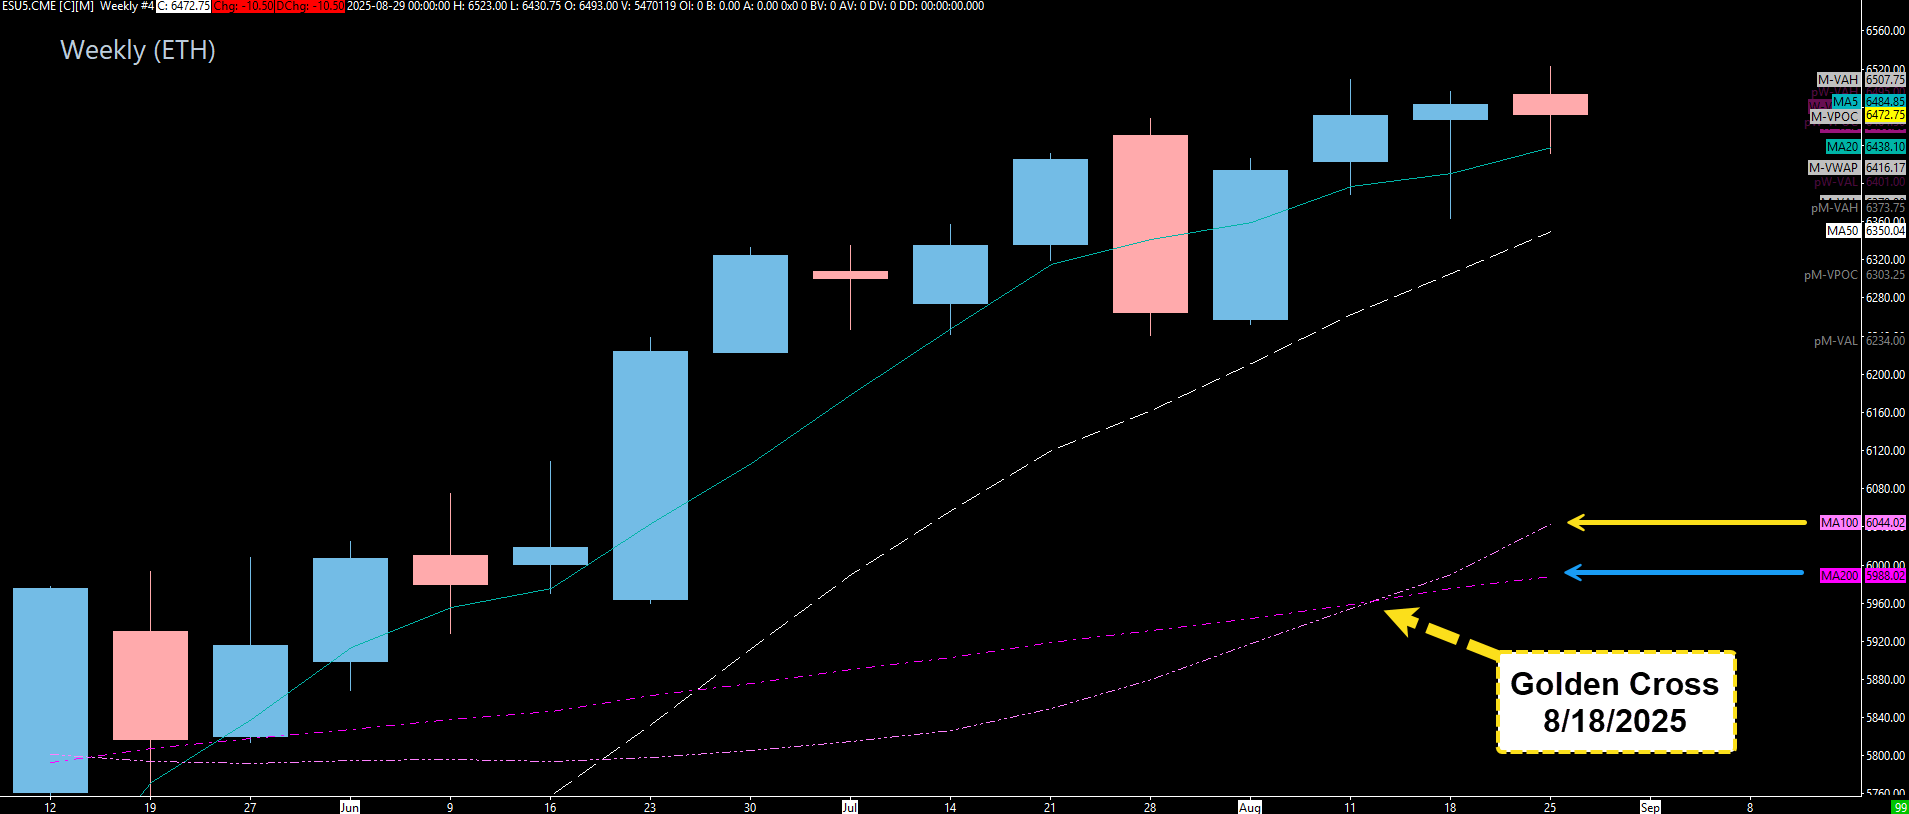
However, this is not a "buy and forget it" signal. The last time this happened in early 2016, the market pulled back 10% before starting a massive bull run. So, while the long-term picture is incredibly bullish, the short-term picture suggests a healthy pullback is possible. The weekly TPO shows some imbalance below, and with the 4-hour and 1-hour timeframes showing cracks in the rally, it wouldn't surprise me to see us come down and clean that up this week.
🚨 VIX Analysis
As you know, I'm a big proponent of watching the VIX. It is currently trading above our key weekly pivot at 14.85. This is a reason for short-term caution. While the VIX has not gained on any high timeframe, a pullback in the VIX to test 14.85 as support could lead to another pop, which would send the indices lower. This pullback in VIX would likely provide a relief rally in ES.
Key Pivot: Watch 14.85. A move back below this level would cause the ES to push up strongly.
Key Resistance: I'd like to see the VIX stay suppressed underneath the monthly at 15.65.
🎯 Detailed Actionable Trade Plan
🔴 Key Resistance Zones
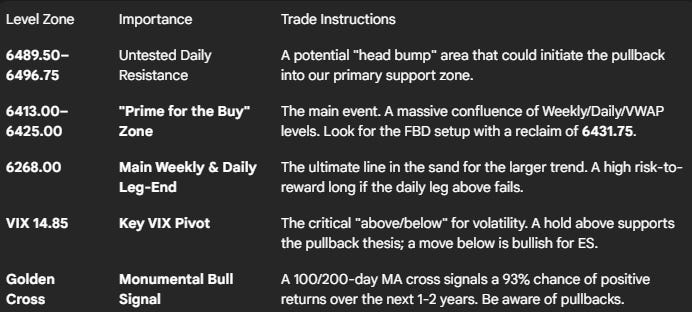
Untested Daily Zone: 6489.50 – 6496.75
We have two untested daily levels that could provide a "head bump" and a reaction that brings us down into our primary support zones. This is the first major area of resistance above us.
🔵 Key Support Zones & Setups
The Cautious Daily: 6450.75
This is a minor sub-leg, and I'm unsure if it's tested. I have this as "watch only." A move below the previous all-time high leg tip at 6446.75 would naturally bring us down into our primary area of interest.
The "Prime for the Buy" Zone: 6413.00 – 6425.00
This is the main event. This area is a prime spot to look for longs and is packed with confluence. It contains the massive weekly level at 6425.00 (which sent us down 90 points a few weeks back and is now untested as support), the fresh daily leg up at 6413.25, and the monthly VWAP at 6416.00.
Actionable Setup: This is a fantastic area for a failed breakdown trade. Look for price to test into the 6425.00 or 6413.00 area and then get acceptance back above the 6431.75 daily. This could trigger a massive squeeze all the way back to all-time highs.
Deeper Structural Pivots: 6320.00 – 6344.75
If we get a daily close below 6413.00, the structure is in trouble. The next major support pivots would be the tested but very important dailies at 6344.75 and the cluster at 6320.00-6323.00, which were the launchpads for previous all-time highs.
The Ultimate Target / Main Leg-End: 6268.00
If the 6413.00 sub-leg fails, our ultimate target would be the main daily and weekly leg-end at 6268.00. This would be a high risk-to-reward long opportunity.
Actionable Setup: If this area plays, we would want to see a reclaim of the 6300s for confirmation that the low is in and we are good to go.
🚨 Momentum Shift Levels
Primary Line in the Sand: The daily leg up at 6413.25. This is the sub-leg. A daily close below this level is the primary bearish signal and puts the market in trouble.
Key VIX Pivot: 14.85: The VIX staying above this level signals short-term caution for ES bulls and supports the pullback thesis.
📌 Cheat Sheet – Key Levels Recap
🧠 Final Thoughts
Remember, we are ultimately bullish. The long-term picture is incredibly strong, especially with the confirmation of the rare Golden Cross. FinTwit can stay bearish; we know that's where money goes to die. Our job is to trade the chart. The chart shows short-term weakness and the potential for a healthy, buyable pullback. The plan is not to short, but to patiently wait for the market to come down to our prime, high-confluence buy zone around 6413.00-6425.00 to join the larger uptrend.
Enjoy your Monday holiday, and let's get ready for a great week.
Until next time—trade smart, stay prepared, and together we will conquer these markets!
Ryan Bailey, VICI Trading Solutions.

