

First things first, because this one trips people up.
The stock market is open on Election Day.
Regular hours, 9:30 to 4:00 ET. The NYSE’s 2026 calendar shows no closure and no early close on Tuesday, Nov. 3. SIFMA doesn’t recommend a bond market close either. ES runs its normal Globex session — the usual 5:00 to 6:00 p.m. ET halt, then straight through the night while the results come in.
The confusion has a real history behind it. The NYSE closed for every Election Day through 1968, then only in presidential election years from 1972 through 1980. That old holiday is why this study starts in 1970 — the first midterm with an Election Day session to measure.
In my last midterm post, I walked through the 21-for-21 November-to-June record and what you had to sit through to collect it. That’s an investor’s stat. If you’re flat by the close every day, an eight-month window doesn’t help you at 9:30 tomorrow.
S&P 500 Midterm Returns: 21 for 21 Since 1942 — Dips Included

Midterm season brings a predictable kind of noise. The headlines get louder, the predictions get more partisan, and traders start positioning around who might take the House or the Senate — as if that outcome decides where the S&P 500 goes next.
So I pulled the four sessions that matter this week — the Monday before, Election Day, the Wednesday after and the Thursday after — for all 14 comparable midterms.
My read: the calendar has leaned bullish into the result, then gets less reliable coming out of it. Direction fades. Range grows.
The Scorecard
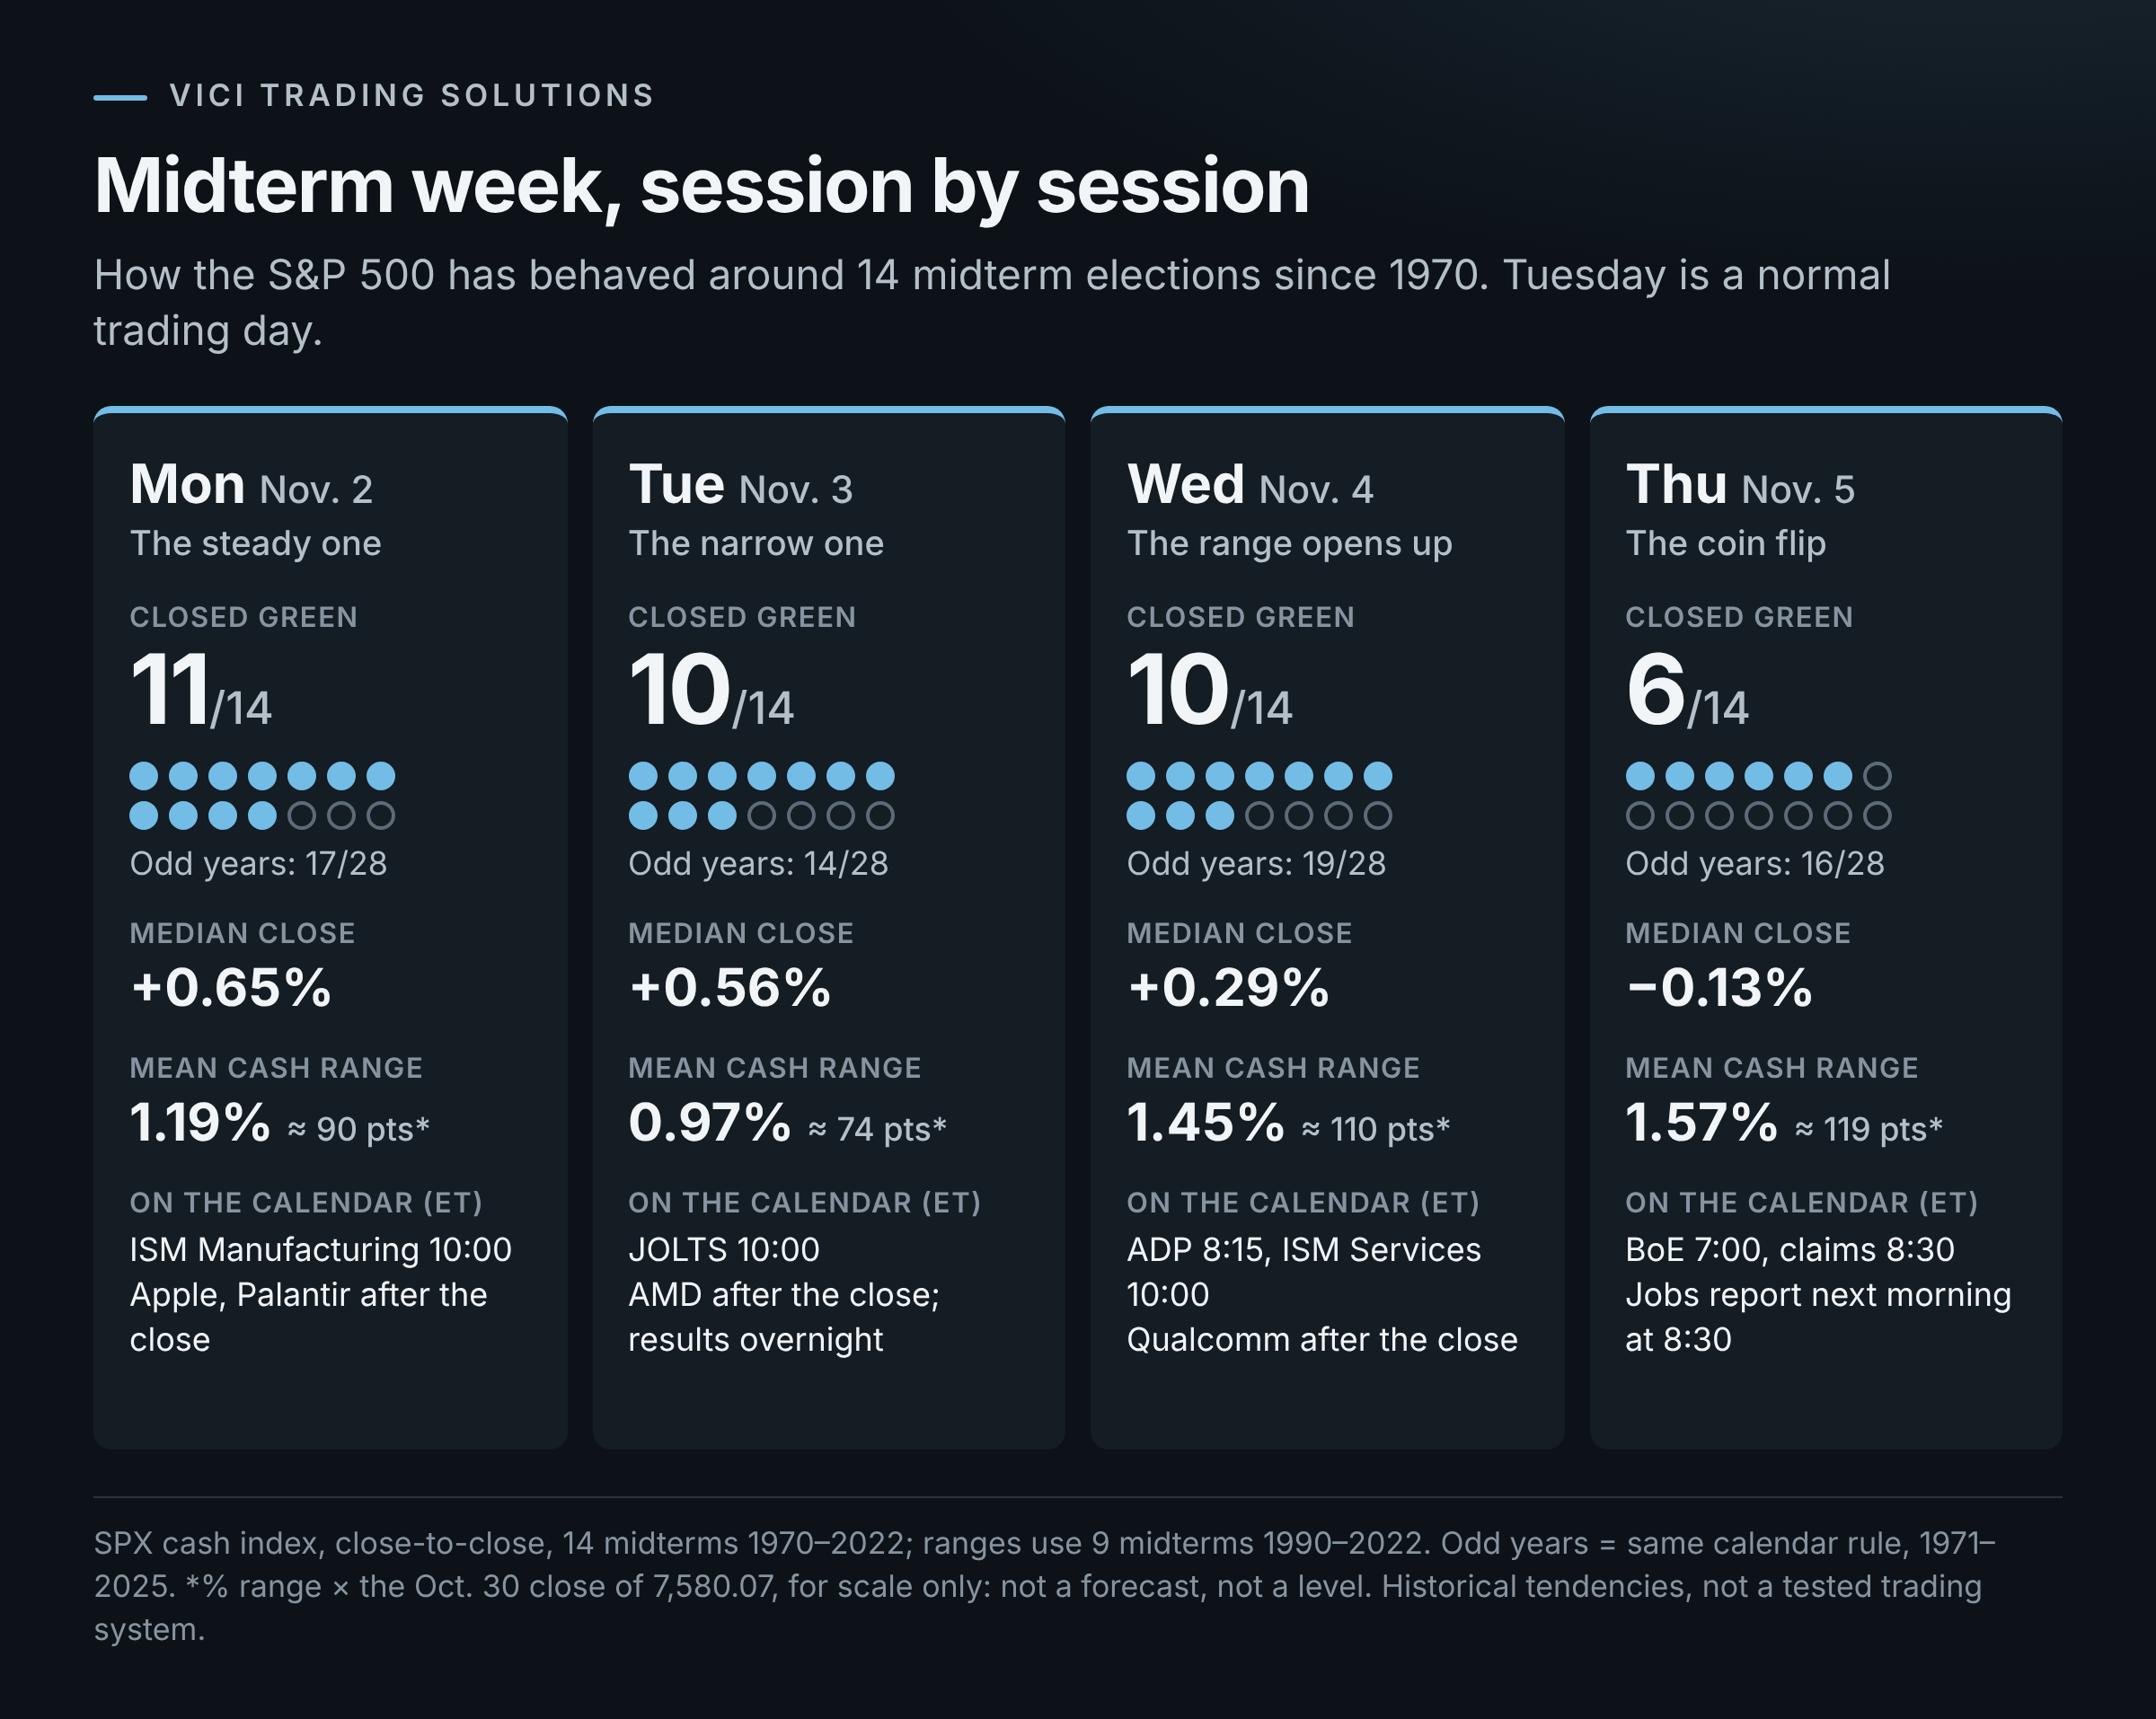
Every historical return and range in this post is the SPX cash index, not ES. Returns are close-to-close, from 1970 through 2022.

Look at Thursday. The mean says +0.41%. The median says the typical Thursday closed red. Keep that gap in your head — it comes back.
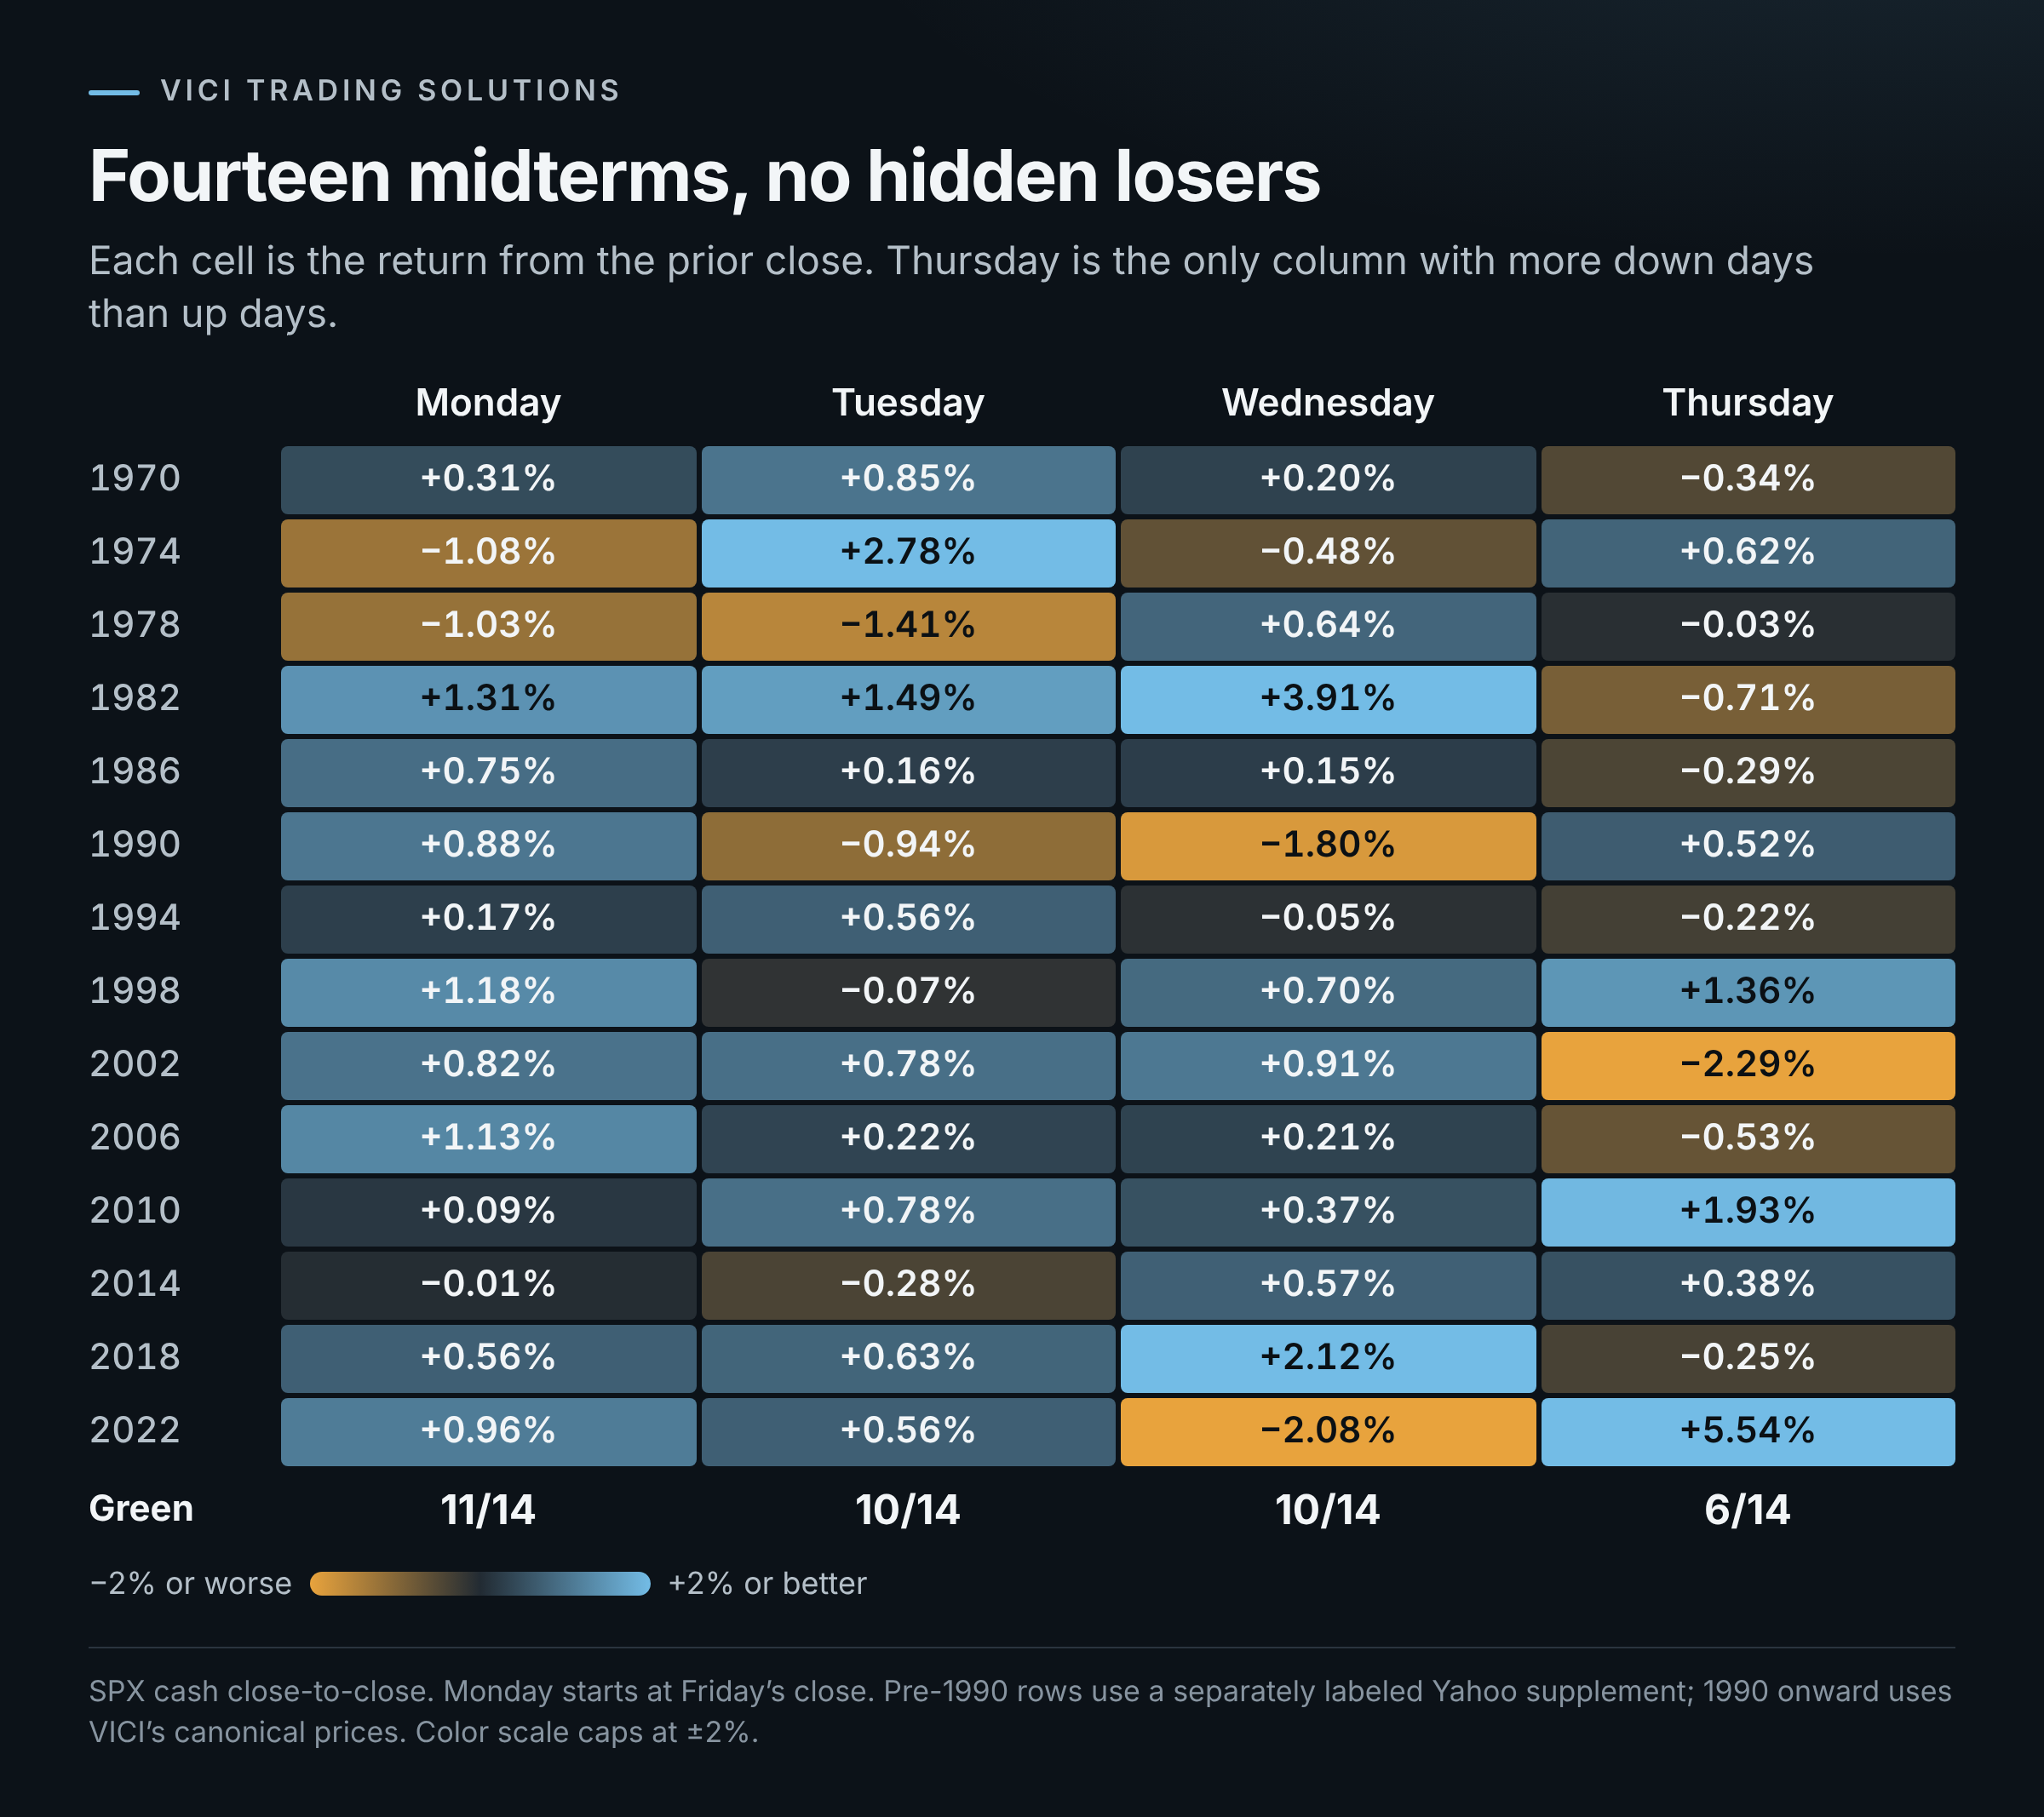
Here’s every election, so nothing is hiding behind an average.
Before You Call It an Edge
Here’s what nobody selling election-week alerts wants to say out loud: stocks go up on plenty of ordinary days too.
So we ran the same dates in 28 odd-numbered years, from 1971 through 2025, as a control.
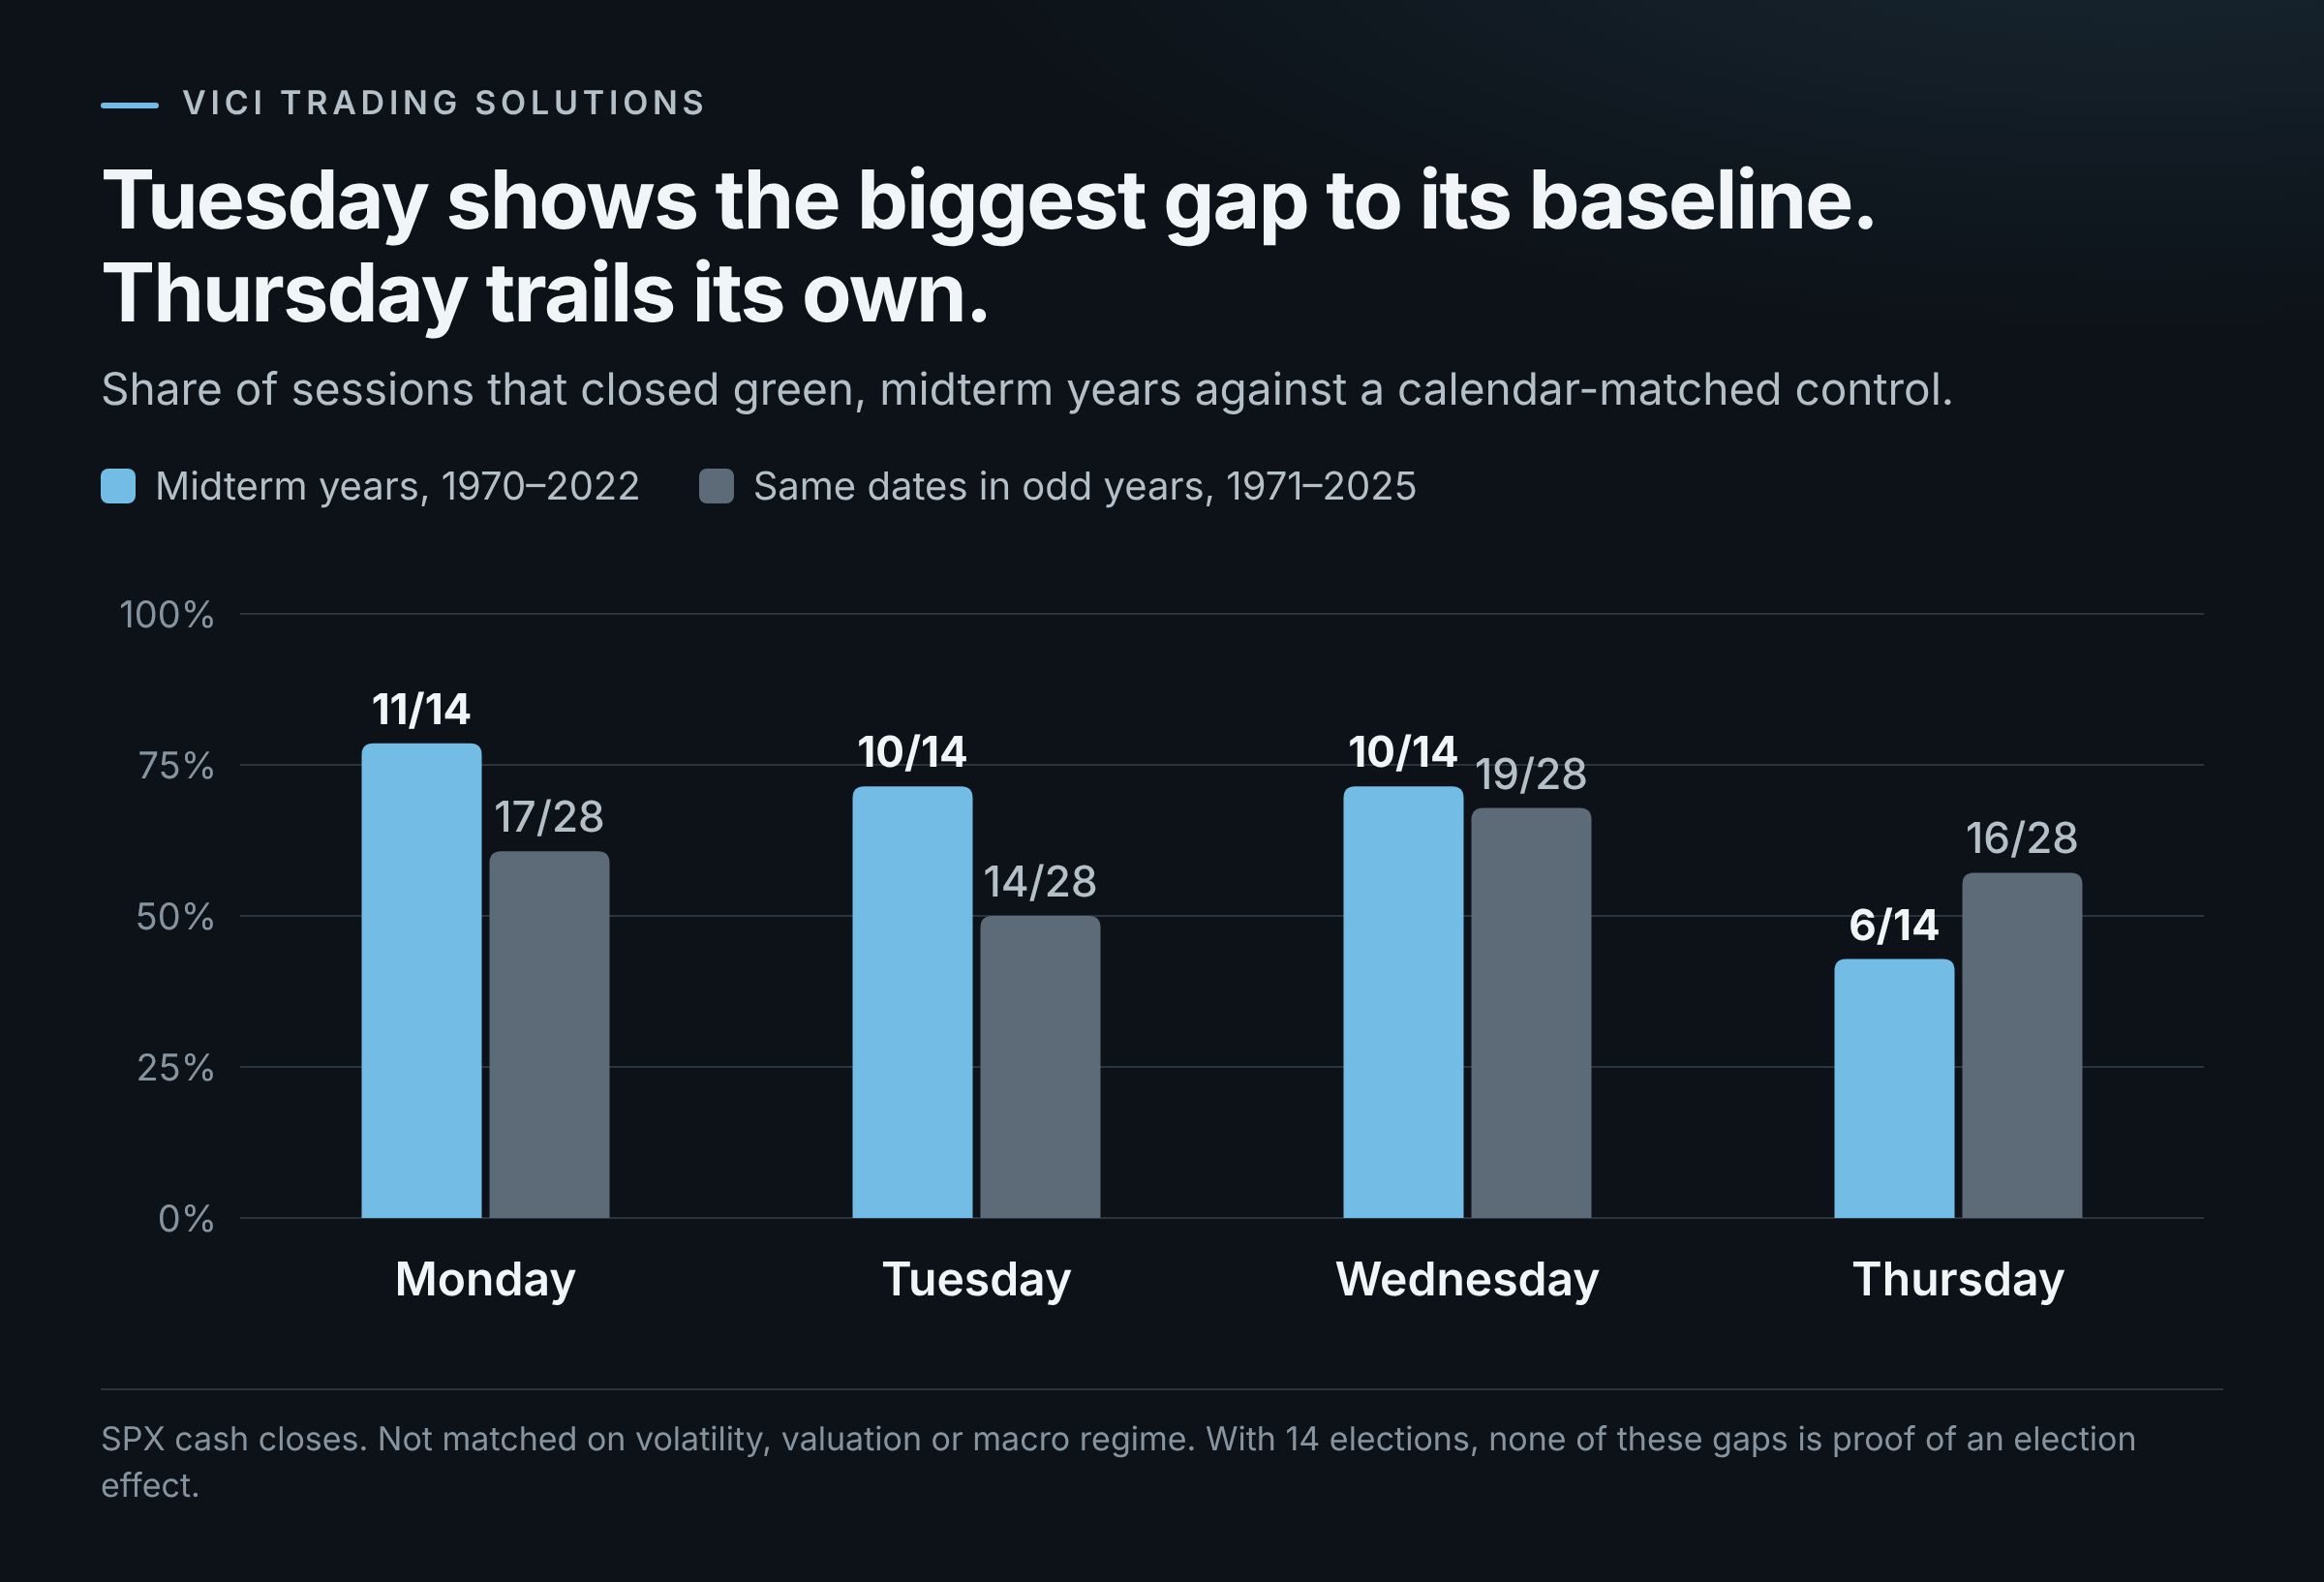
Monday is mostly just a strong November Monday. Since 1990, midterm Mondays were green 8 of 9 — but odd-year Mondays were green 14 of 18, averaging +0.41%. You can’t credit the election with that.
Tuesday shows the widest gap: 10 of 14 against a 14-of-28 coin flip.
Wednesday barely clears its baseline: 10 of 14 against 19 of 28.
Thursday trails its baseline: 6 of 14 against 16 of 28.
Then there are the outliers. Remove 1982’s +3.91% and Wednesday’s mean drops from +0.38% to +0.11%. Remove 2022’s +5.54% and Thursday’s mean drops from +0.41% to +0.01% — with a −0.22% median and just 5 of 13 green.
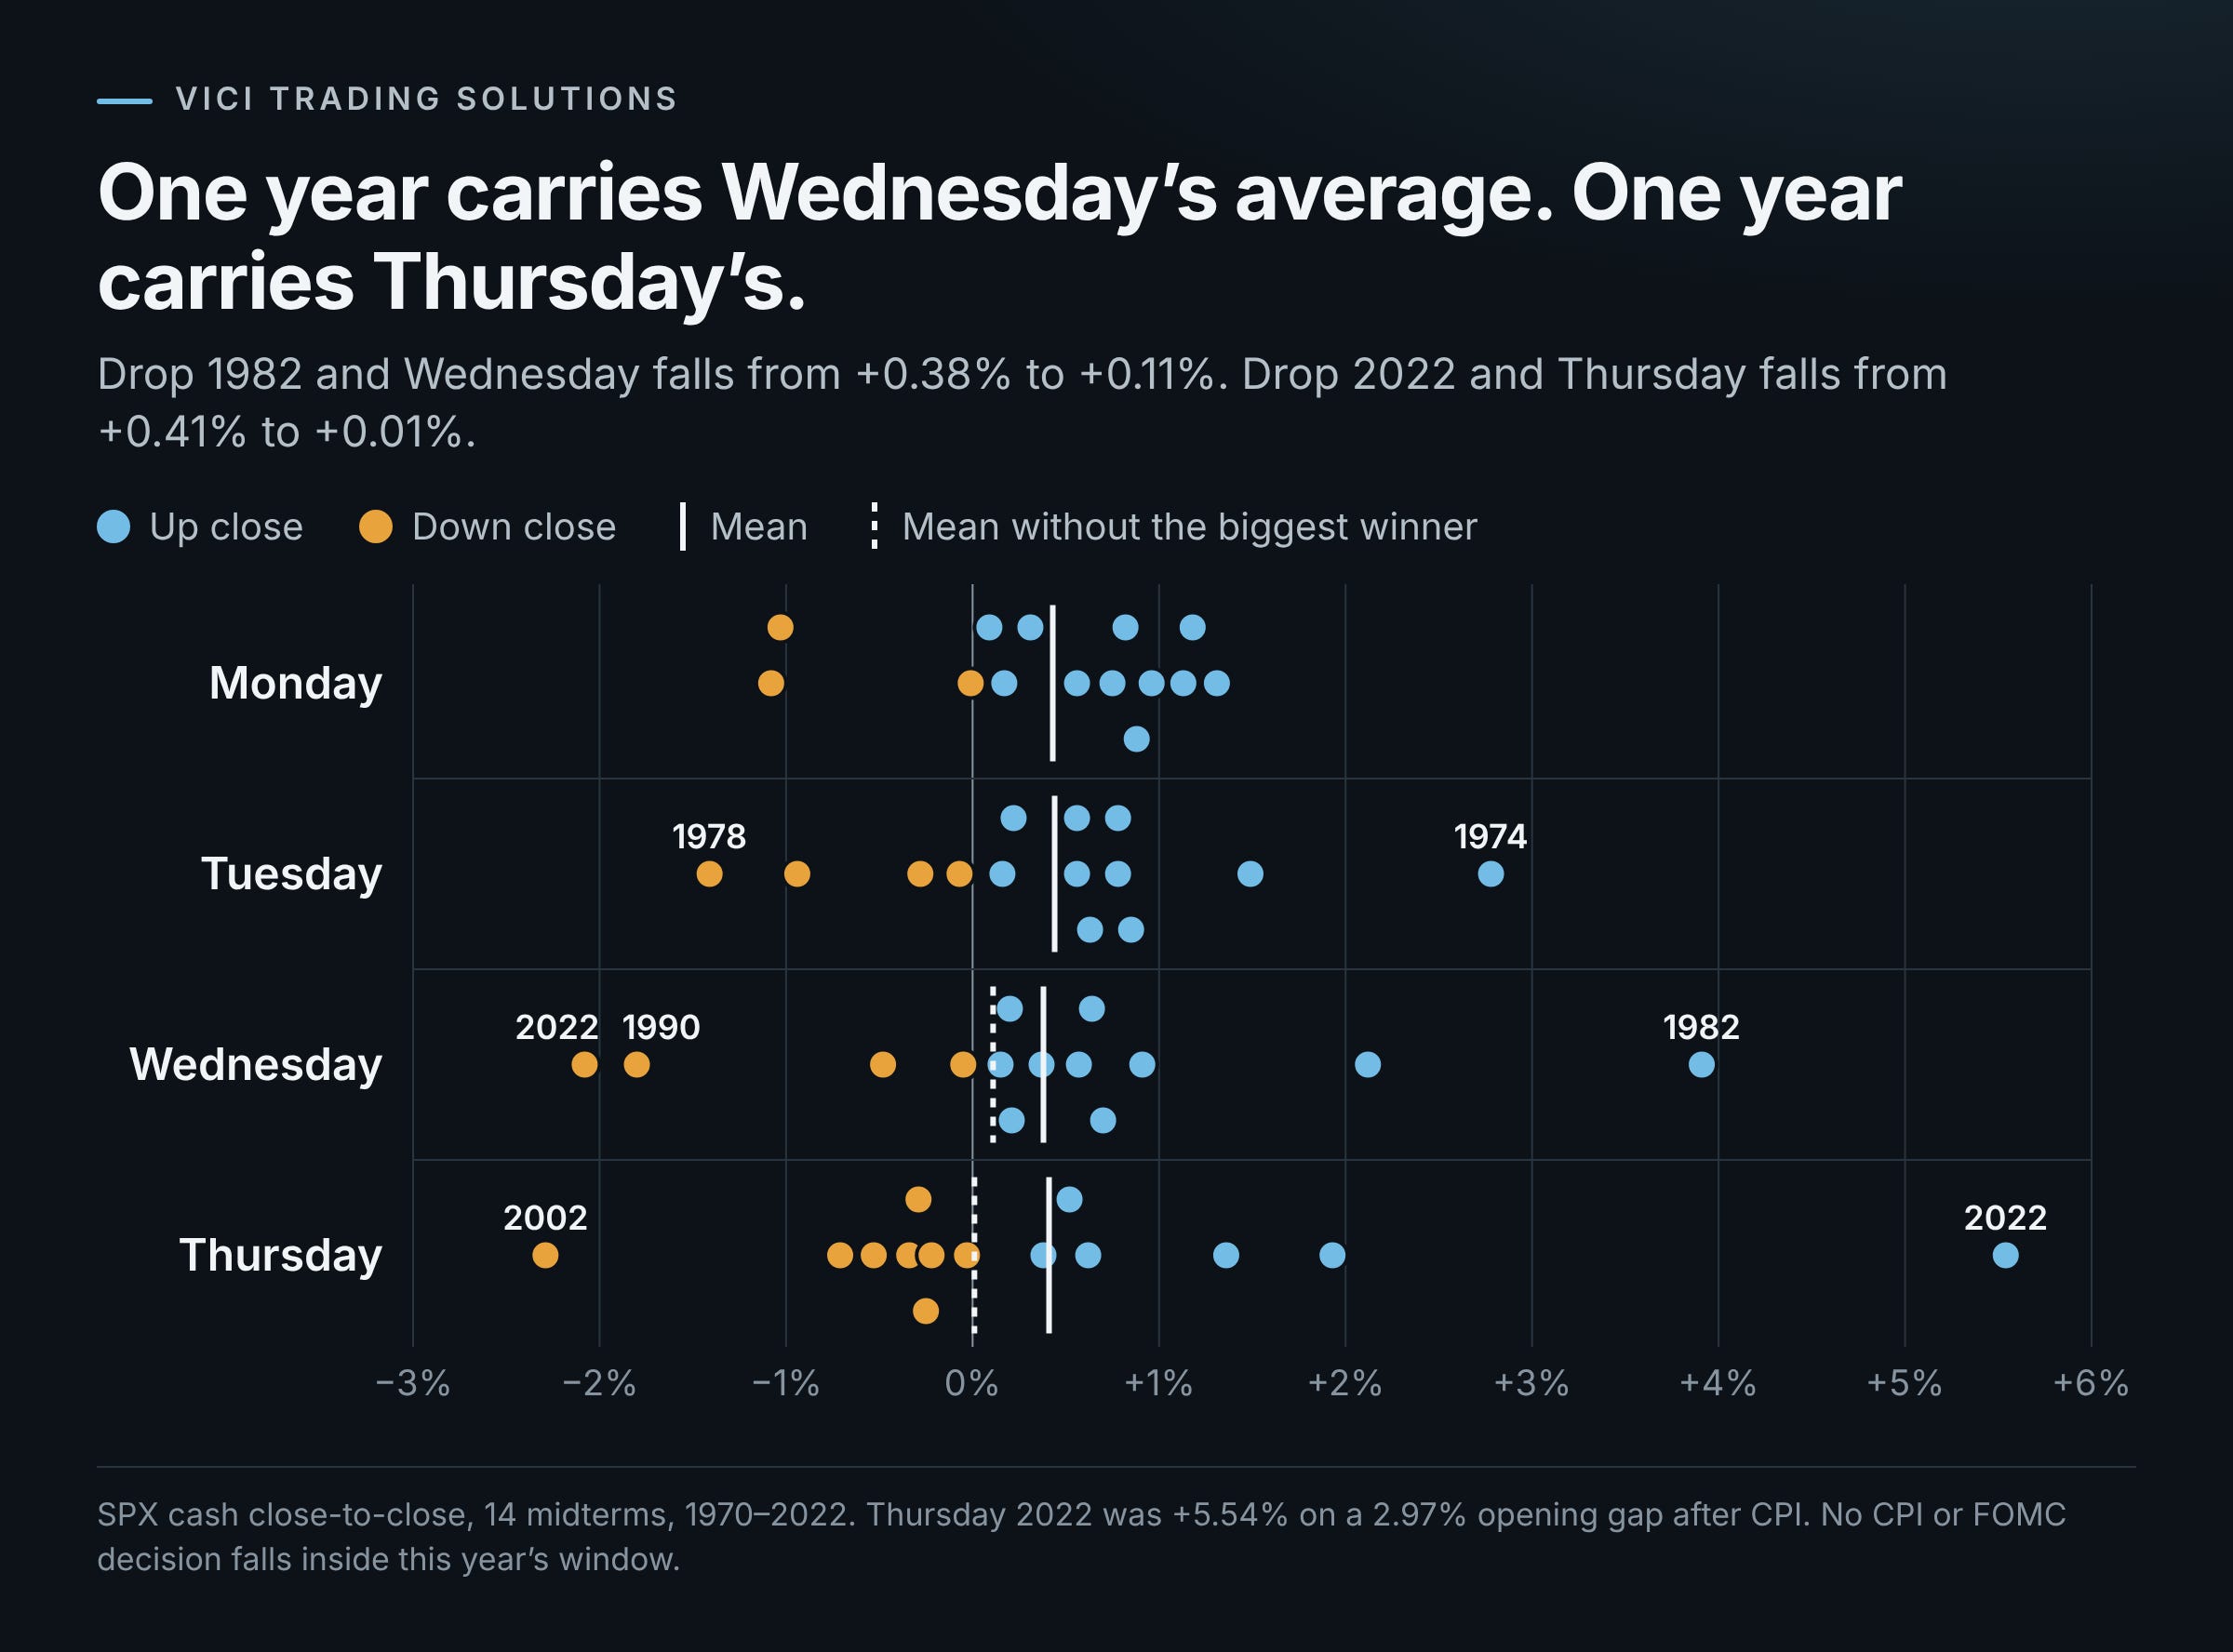
And that 2022 Thursday wasn’t an election reaction. CPI hit at 8:30 that morning and SPX opened up 2.97%. The Fed also landed inside this window in 2002, 2010 and 2018.
That matters this year. The FOMC already held at 3.75% to 4% on Oct. 28 and doesn’t meet again until December. CPI isn’t due until Nov. 10. The catalyst behind the biggest Thursday in the sample isn’t on this week’s calendar.
Where We Walk In
This isn’t a sleepy tape. SPX closed Friday at 7,580.07, down 1.82% — its worst day since June and its third straight weekly loss, 3.05% off the Oct. 6 record close. Semis lost more than 15% in October as AI spending doubts hit tech. The 10-year sits near 4.93%, and two Fed voters dissented last week in favor of a hike.
VIX closed Friday at 19.42. The math: 19.42 ÷ √252 = 1.22%, or about 93 SPX points of implied one-day move.
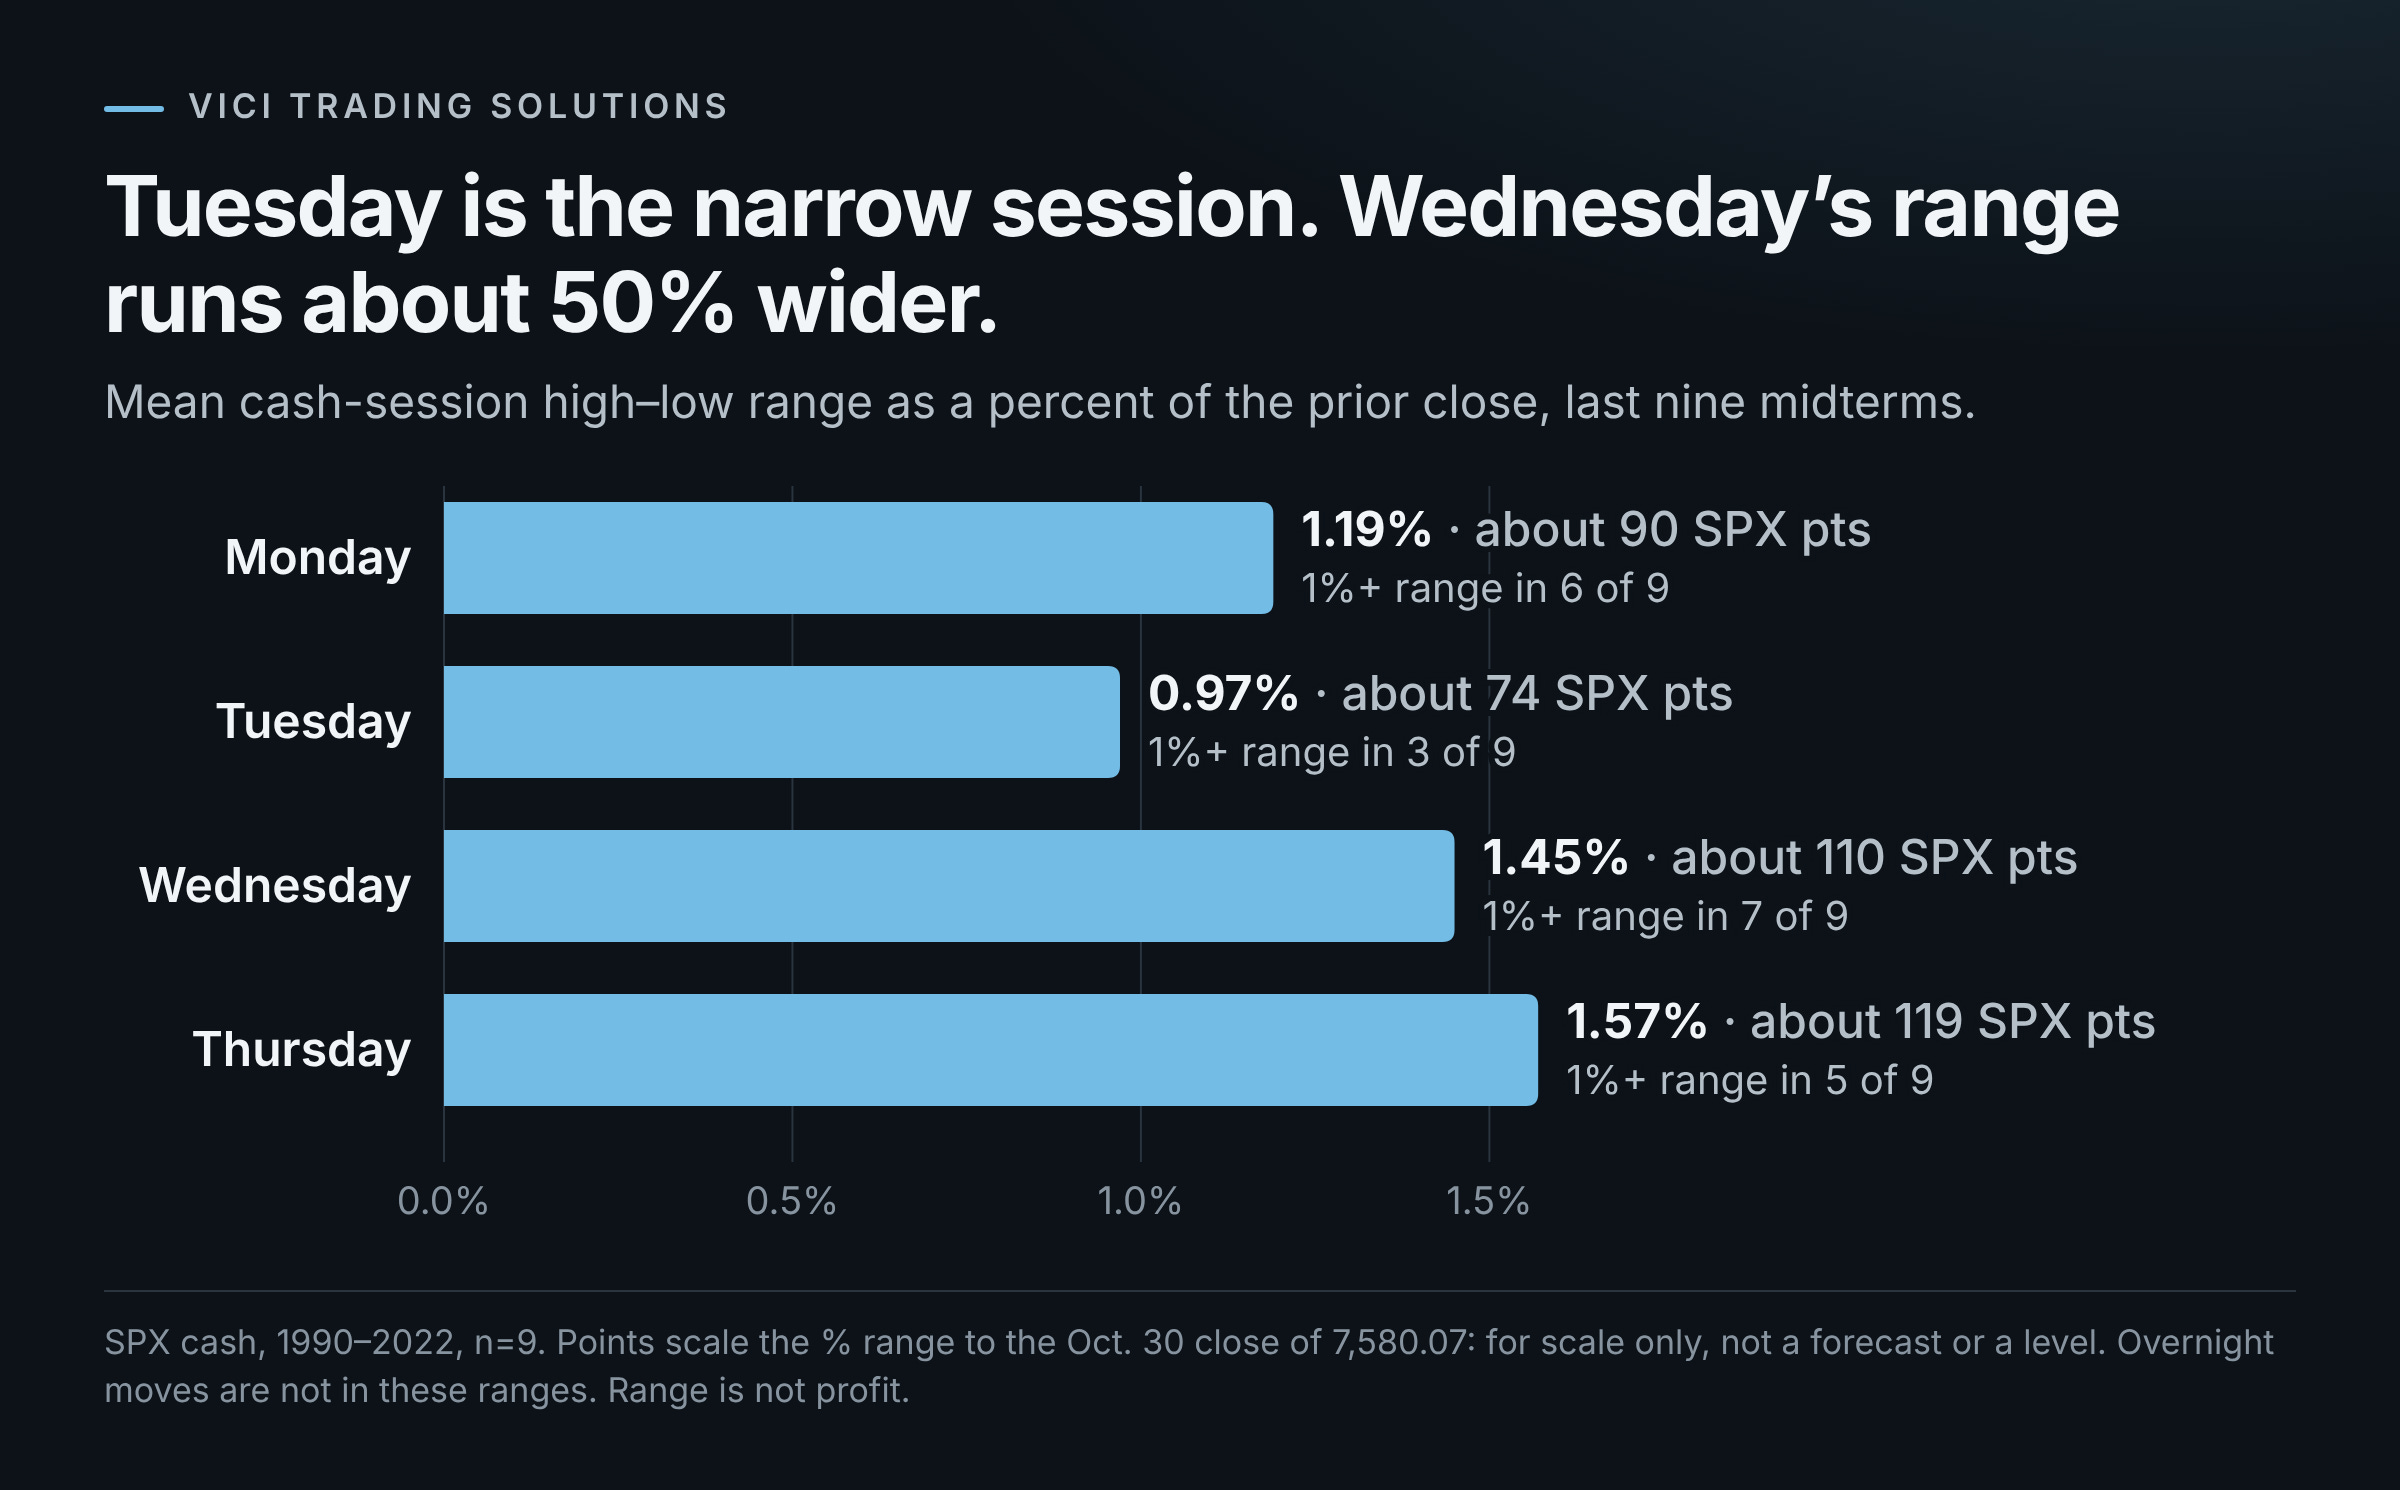
I’ll scale the historical ranges below — cash session high to low, last nine midterms — to Friday’s close so you can see them in points. Those are for scale only — they are not levels and they are not forecasts. The sample includes much quieter markets than this one, so trust the ordering across sessions more than any point count.
The Playbook, Session by Session
Monday: Already on Your Screen
The most consistent session on the board, for reasons that have little to do with the vote. Mean range 1.19%, about 90 points.
ISM Manufacturing came at 10:00. Apple and Palantir report after the close, so Tuesday’s opening print carries both.
The job: mark Monday’s high and low. That’s your first map for a Tuesday that may not want to leave it.
Tuesday: The Narrow One
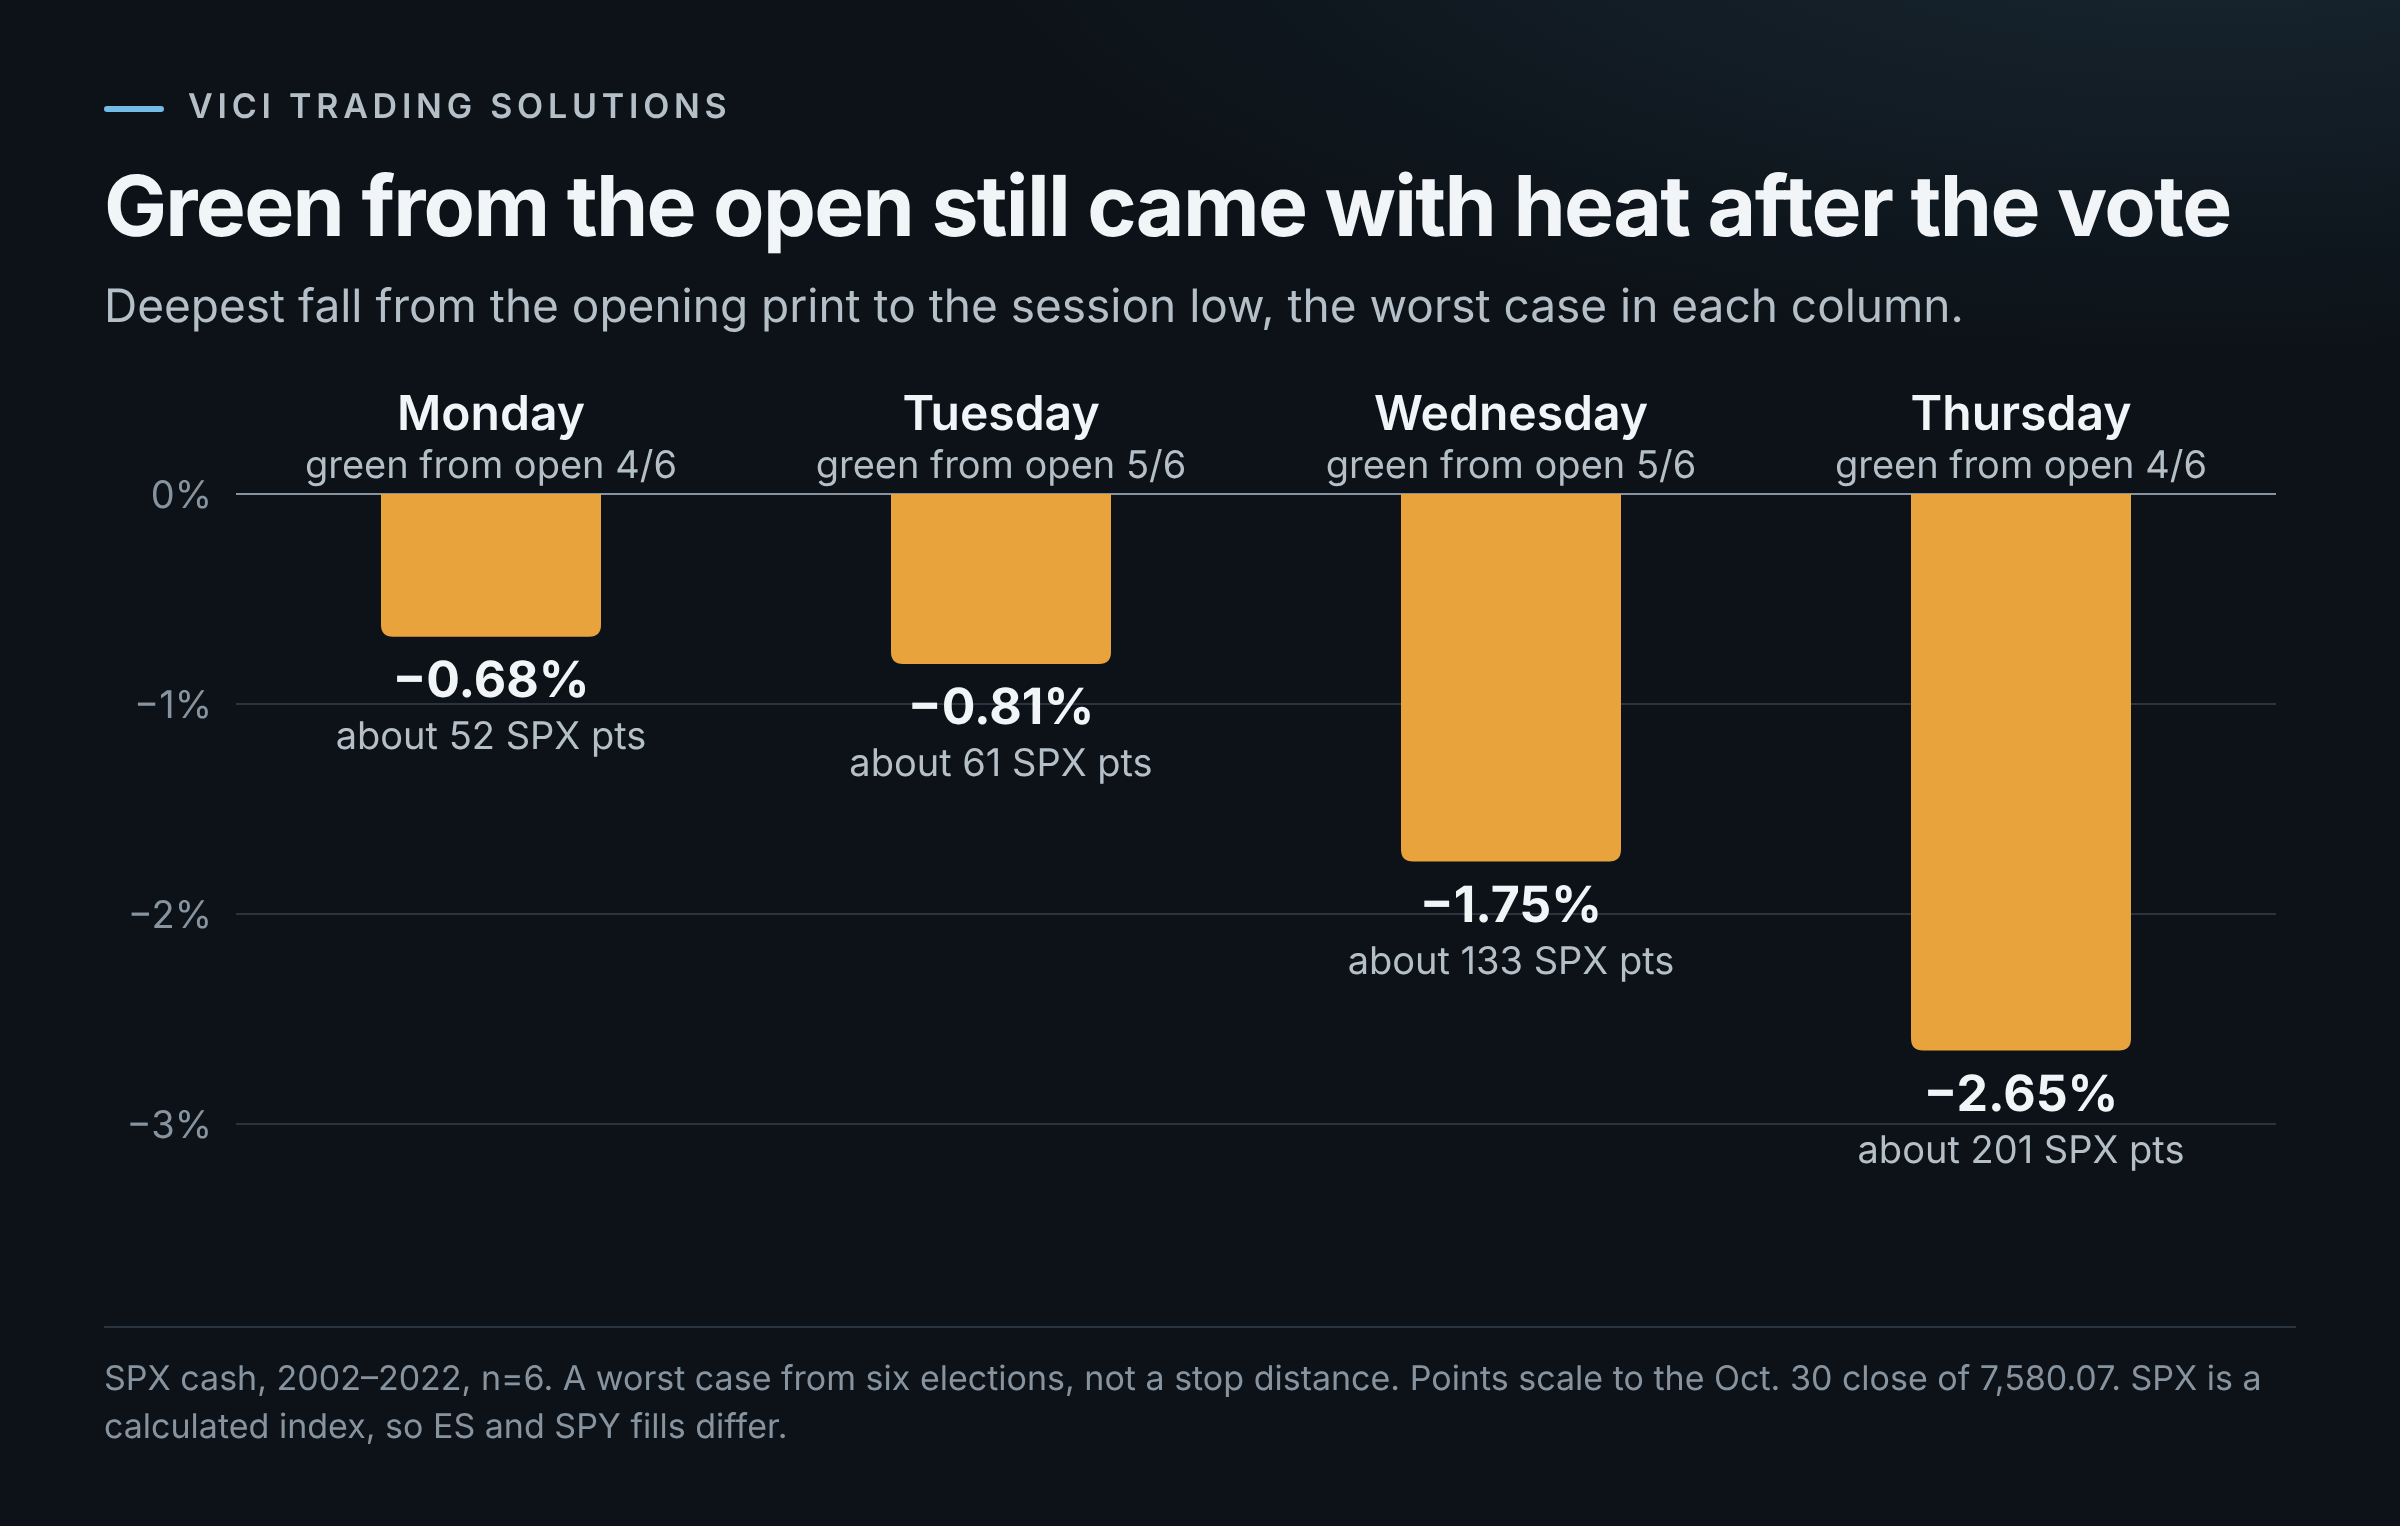
Green 10 of 14, median +0.56%. Over the last six elections with reliable opens, the cash session finished above its open 5 of 6 times, with an average gap of just +0.05%.
It’s also the narrowest session of the four: mean range 0.97%, median 0.77% — roughly 74 and 58 points. It reached a 1% range only 3 times in 9.
That makes sense. The first polls don’t close until after the cash session ends. You’re trading JOLTS at 10:00 and the Apple and Palantir reaction, not an election result.
The job: expect rotation until price proves otherwise. Take what’s there and don’t hold a good trade waiting for a 100-point day that history says usually doesn’t come. And if you’re flat at 4:00, you carry zero election risk and zero AMD risk into the night. That’s the whole advantage of being intraday — use it.
One warning. Someone on FinTwit is going to look at that narrow range and tell you to sell premium. A smaller range doesn’t establish an option-selling edge, and this study never tested one.
Wednesday: The Range Opens Up
Mean range 1.45%, median 1.49% — about 50% wider than Tuesday, roughly 110 points. It hit 1% or more in 7 of 9 elections.
Direction didn’t come with it. The mean close since 1990 is only +0.11%. The session has given us +3.91% in 1982 and +2.12% in 2018, but also −1.80% in 1990 and −2.08% in 2022. It finished green from the open 5 of 6 times — and 2022 lost 1.64% from open to close. The worst fall from the open to the low was 1.75%, about 133 points.
This year, you get the election results and AMD in the overnight, then ADP at 8:15 and ISM Services at 10:00.
The job: size for the range. If the range runs wider and your dollar risk stays the same, that means fewer contracts. Don’t trade the first headline, and don’t trade your politics. Wait for price to show you how it’s reacting at your level, then act on that.
Thursday: The Coin Flip
The widest session and the least reliable. Mean range 1.57%, about 119 points. Green just 6 of 14. The worst fall from open to low was 2.65%, about 201 points.
The +0.44% average gap looks friendly until you see that 2022’s single 2.97% gap is bigger than the entire six-election total. Since 1990, Thursday’s mean is +0.72% on 5 of 9 green — and that’s 2022 doing the heavy lifting again.
One more thing from my own count of the table, with no control group behind it, so hold it loosely: Thursday closed in the opposite direction of Wednesday in 10 of 14 elections. After a green Wednesday, Thursday was green only 3 of 10 times. The +3.91% in 1982 and the +2.12% in 2018 both got a red Thursday.
The calendar: Bank of England at 7:00, jobless claims and productivity at 8:30, and the October jobs report sitting there at 8:30 Friday morning. FactSet consensus is around 55,000 jobs, with unemployment at 4.2%.
The job: don’t carry Wednesday’s bias into Thursday’s open. Treat “post-election rally” as a question for price to answer. And respect what Friday morning can do to anything you’re still holding.
Don’t Chase the Result
This is the stat I’d put on a sticky note.
From the Friday close through the Thursday close, SPX was positive 12 of 14 times, with a +1.66% mean, a +1.02% median and a worst of −1.83%. The same dates in odd years: 17 of 28, +0.43% mean. This year, that window opened at Friday’s 7,580.07 close, so it’s already running.
Now start later. Buy Tuesday’s close — the last cash print before the polls close — and hold to Thursday: positive just 8 of 14. Wait until the result is in, buy Wednesday’s close, and all you’ve bought is Thursday’s session: 6 of 14.
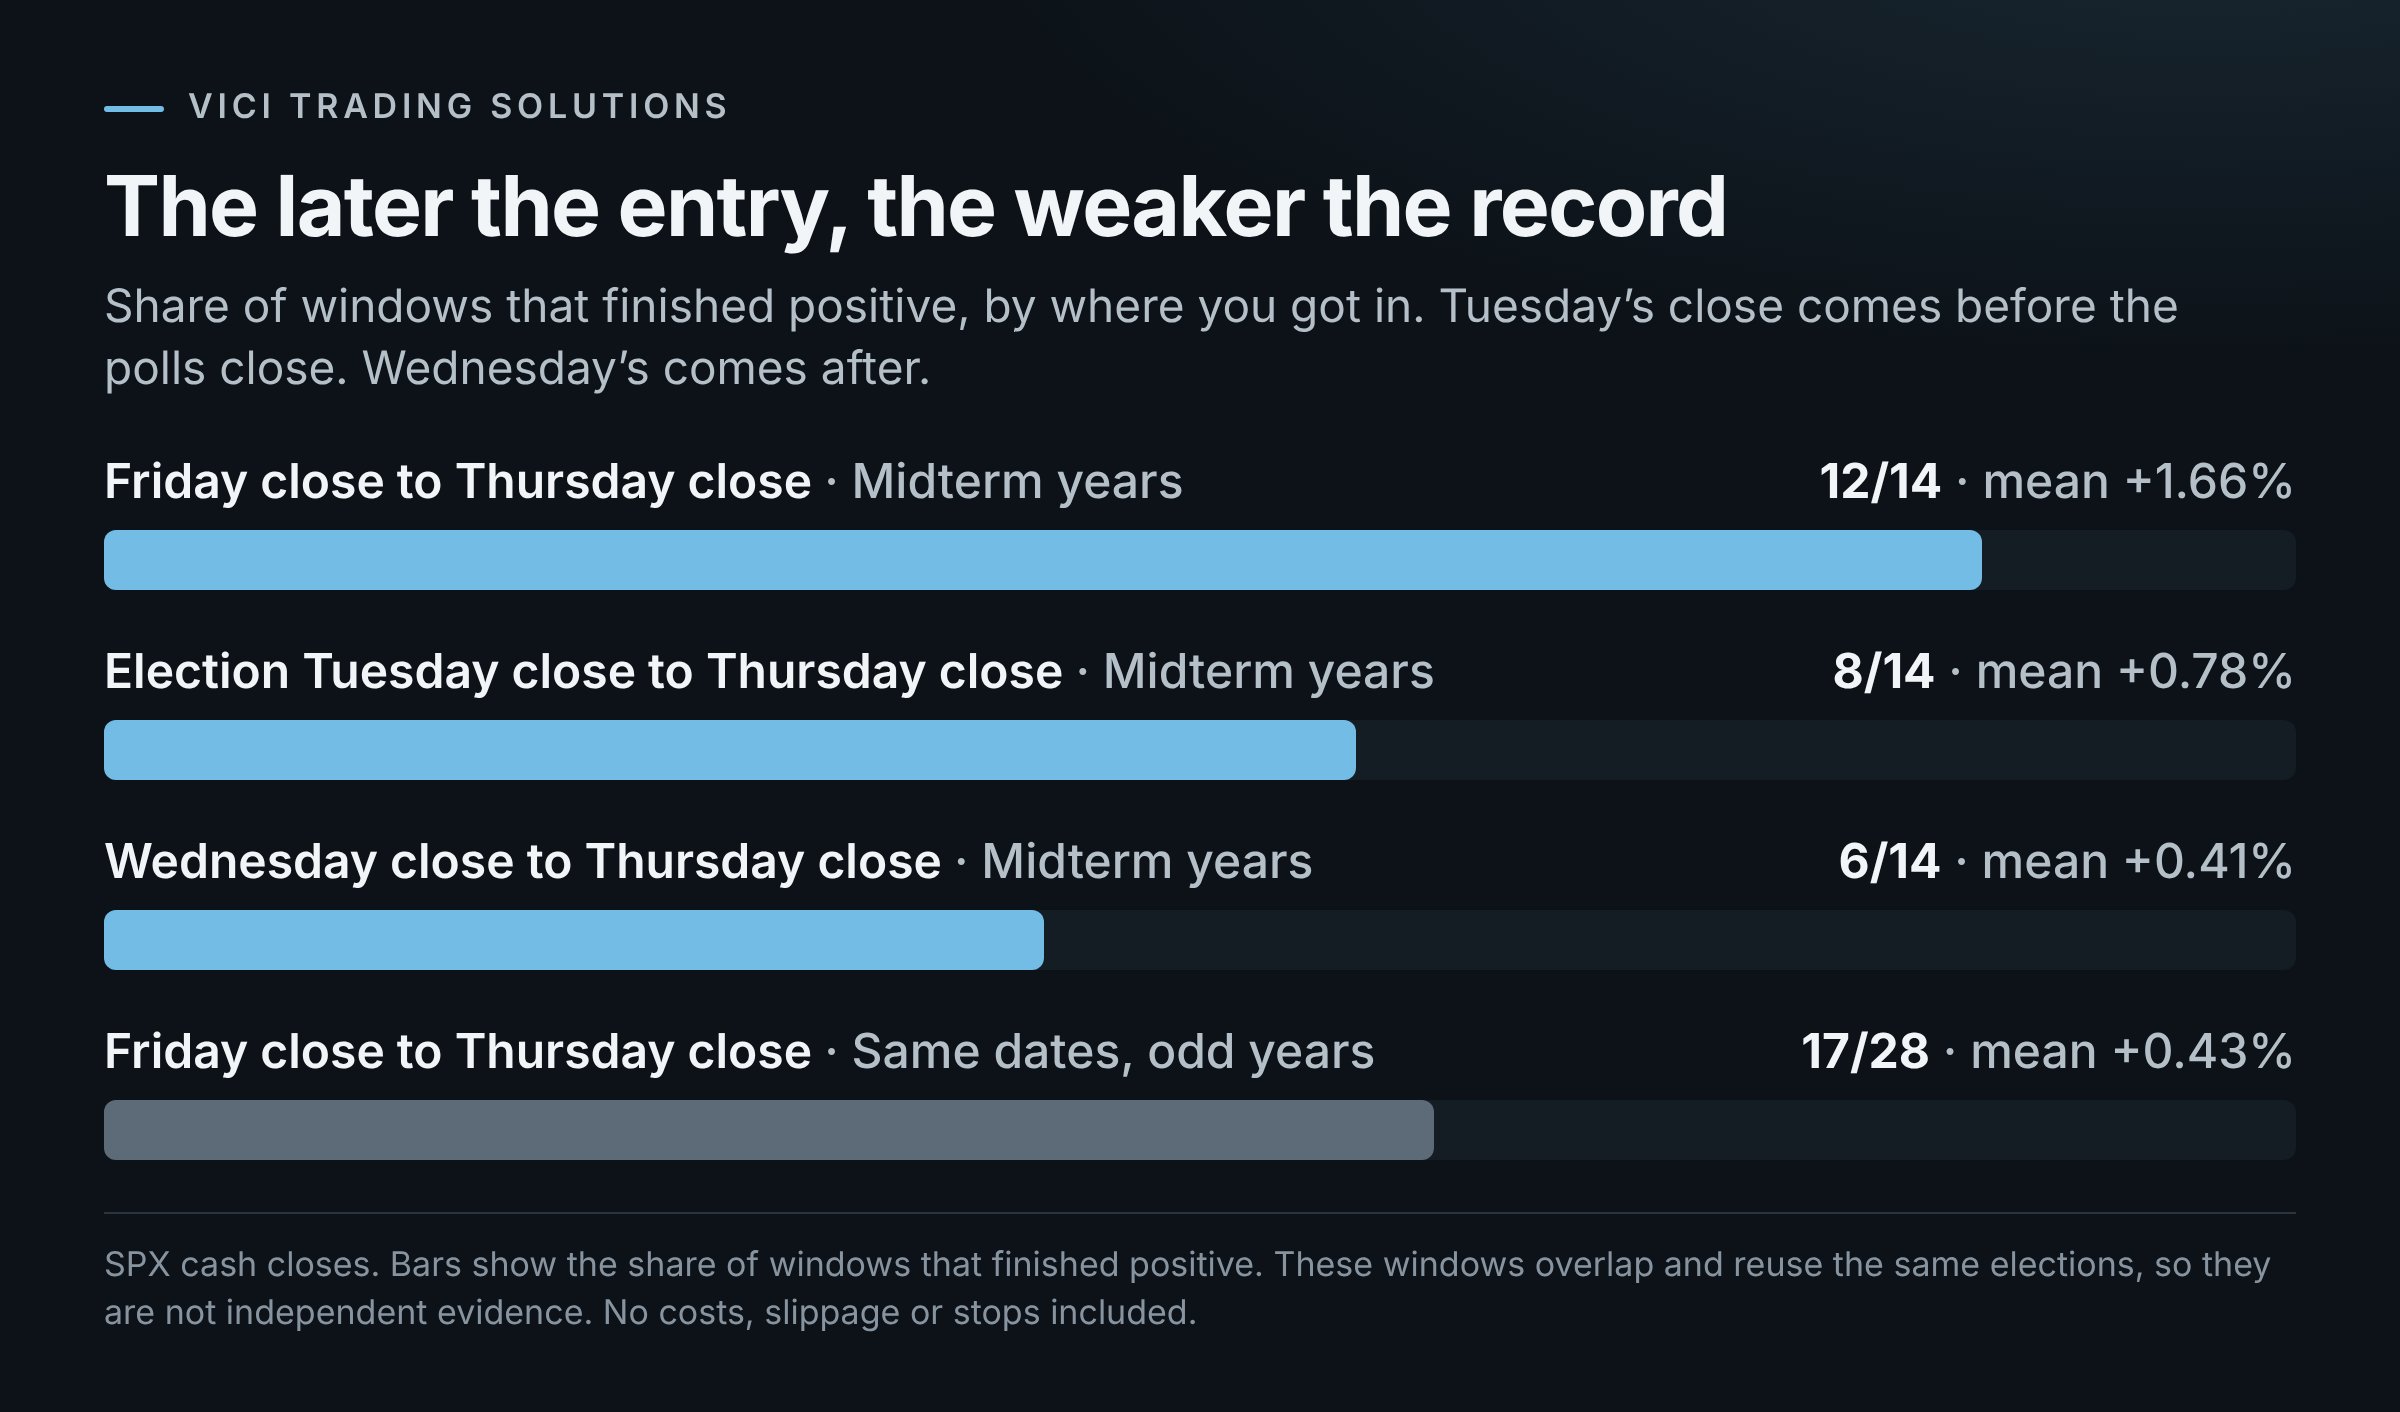
The four-session record doesn’t transfer to a late entry. The Tuesday-close window does show a +0.78% mean, but 2022 and 1982 supply about 60% of it. If you wake up Wednesday feeling like you missed something, this is the number to look at before you press a button.
The Honest Part
This is 14 elections — not 56 independent data points. Rough 95% confidence ranges on those win rates run from 52% to 92% for Monday and 45% to 88% for Tuesday and Wednesday. Bootstrapped ranges on the mean return cross zero for Tuesday, Wednesday and Thursday.
We tested a lot of cuts on a small sample, across completely different market regimes. Pre-1990 rows come from a separately labeled Yahoo supplement, while 1990 onward uses our canonical prices. The open-versus-close numbers only cover six elections, 2002 through 2022. Nothing here includes costs, slippage, stops, option premiums or position sizing. SPX is a calculated index, so your ES or SPY fills will differ, and overnight moves aren’t in those cash ranges.
There’s a real case on both sides, too. Bulls have 12 of 14 on the window and the seasonal tailwind from my last post. Bears have the semis, a 10-year near 4.93%, and a Fed with two votes to hike.
Use this as a calendar prior for what to expect and how much range to plan for. It is not an entry signal.
Where This Stops and the Plan Starts
History gives you the shape of the week. It can’t tell you where to lean on Wednesday morning after election results, AMD and ADP all hit before the 10:00 print.
That’s the part you can’t get from a study. If you’re trading this week, you need the levels and the scenarios in front of you before the open, and that’s what S&P Edge is built for — the daily trade plan, our full indicator suite, the live trading room and the Discord. This is the week to be inside it: CLICK HERE FOR THE S&P EDGE
And if you’re more of a macro person who wants the big picture without an intraday plan, at the very least get the SPX Morning Brief. It’s free, so there’s no reason to walk into this week blind: CLICK HERE FOR THE FREE SPX MORNING BRIEF
Investors can afford to be patient through a November like this one. Day traders need a plan by 9:30.
Direction fades. Range grows. Size for the range and let price do the deciding.
🎙️ S&P Edge Post Market Breakdown streams at 5pm EST Mon–Thu on X, YouTube, and Substack. CLICK HERE FOR THE SOCIAL LINKS
Until next time—trade smart, stay prepared, and together we will conquer these markets!
Ryan Bailey, VICI Trading Solutions.