

Good Afternoon Team,
I have something super exciting to share with you today.
This is an exclusive release for paid Substack subscribers. You guys support this work, and I want to make sure you are reaping the rewards.
I have been working diligently to solve a problem that many of you face. We talk about the “80% Rule” constantly in the post-market breakdowns and the chat room. It is one of the most powerful setups in our arsenal.
The problem? Most of you are on TradingView, and you don’t have access to the complex Time Price Opportunity (TPO) or Market Profile charts required to spot it.
The solution? I built a custom indicator that runs the TPO logic in the background and puts the trade right on your chart.
What is the “80% Edge Rule”?
For those who need a refresher, the logic is simple but powerful:
If the market opens outside the previous day’s Value Area...
And then accepts back inside for two or more periods (30-minute blocks)...
There is an 80% statistical probability that price will rotate all the way to the opposite side of the Value Area (e.g., from Value Area High down to Value Area Low).
Introducing: The EDGE 80% Rule Indicator
I have coded this logic directly into a TradingView script. You no longer need expensive software or messy charts to see this trade develop.
Here is what this tool does for you:
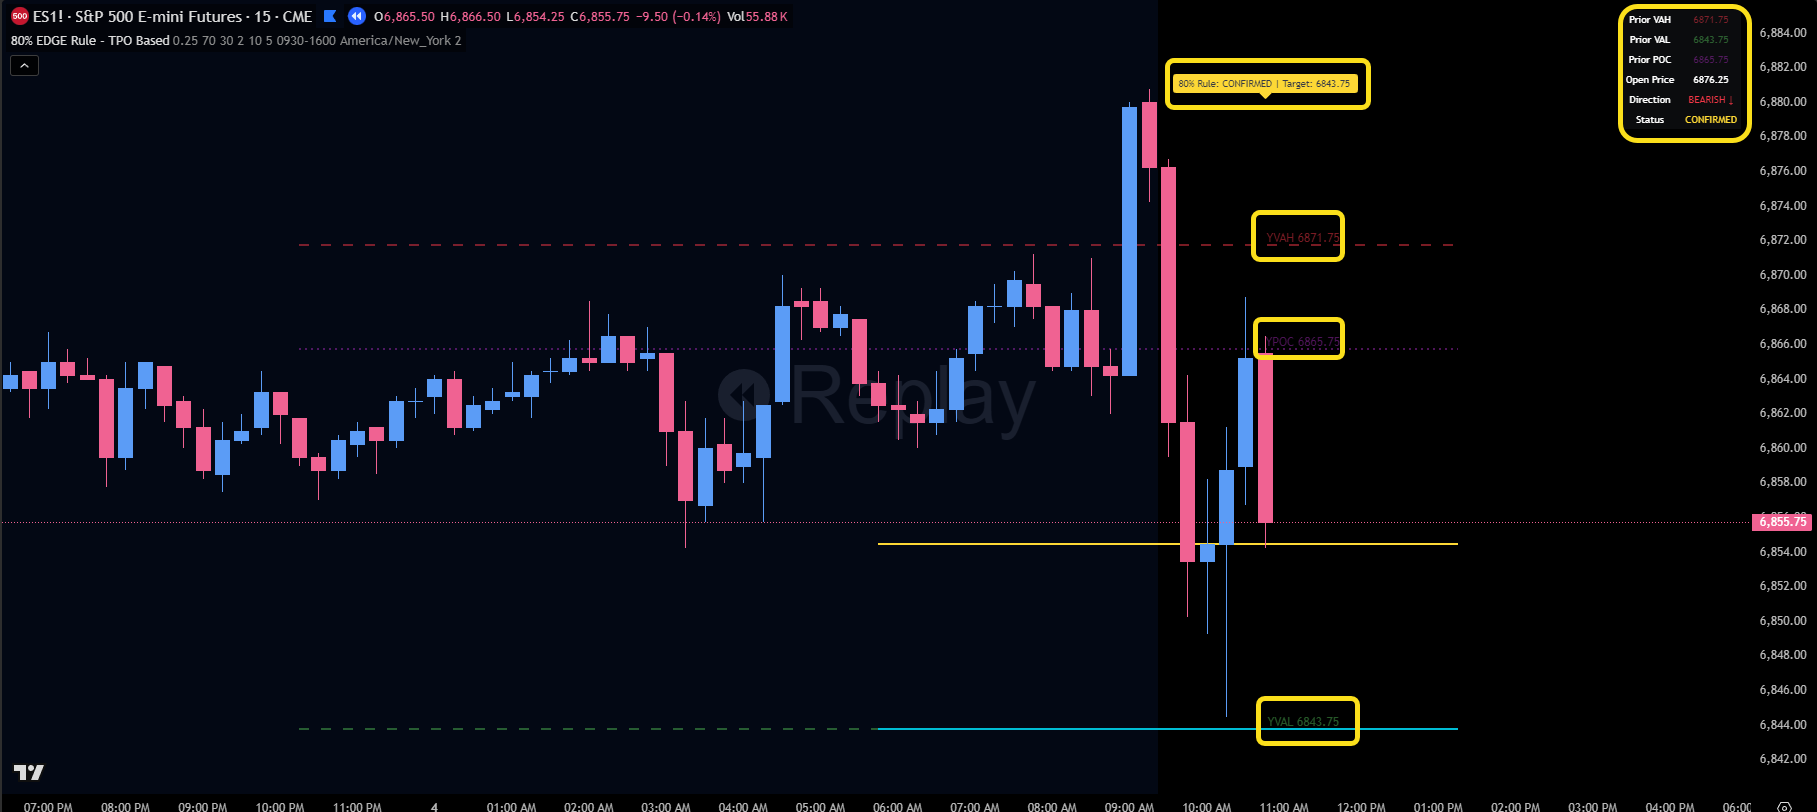
Automated Alerts: It continuously scans the market. When the conditions are met (Open Outside + 2 Periods Inside), it alerts you that the trade is CONFIRMED and gives you the specific target.
Live Dashboard: A clean panel on your chart shows you the current status (Searching, Confirmed, Target Hit) and the direction (Bullish/Bearish).
Hidden TPO Engine: TradingView doesn’t natively let scripts access TPO data like this. I built a TPO engine that runs in the background to calculate these levels precisely without cluttering your screen.
The “Day Trader’s Paradise” Feature
Even if the 80% Rule trade never triggers, this indicator is still invaluable.
Why? Because it automatically plots the Previous Day’s Value Area High (VAH), Value Area Low (VAL), and Point of Control (POC) on your chart every single day.
These are critical institutional levels that I rely on daily for confluence. Previously, you had to mark these by hand or guess. Now, your TradingView charts can look exactly like my professional Sierra Chart setup.
How to Get Access (Paid Subscribers Only)
This tool is a gift for being part of the S&P Edge Publication. To get it enabled on your account, follow these simple steps:
Watch the video above to understand exactly how to read the signals and dashboard.
Send me a DM directly through Substack (reply to this post or click my profile).
Include your TradingView Username in the message.
I will get you authorized immediately so you can add this to your arsenal.
Thank you for your support. Let’s put this weapon to work and keep conquering these markets.
Cheers,
Ryan Bailey
Vici Trading Solutions

