

Let me get one thing out of the way before we start.
I am not calling a top. I have been constructive on this market all year, and I still am. The index just logged its 27th record close of 2026 and it is up better than 13% on the year, and I have no interest in standing in front of that.
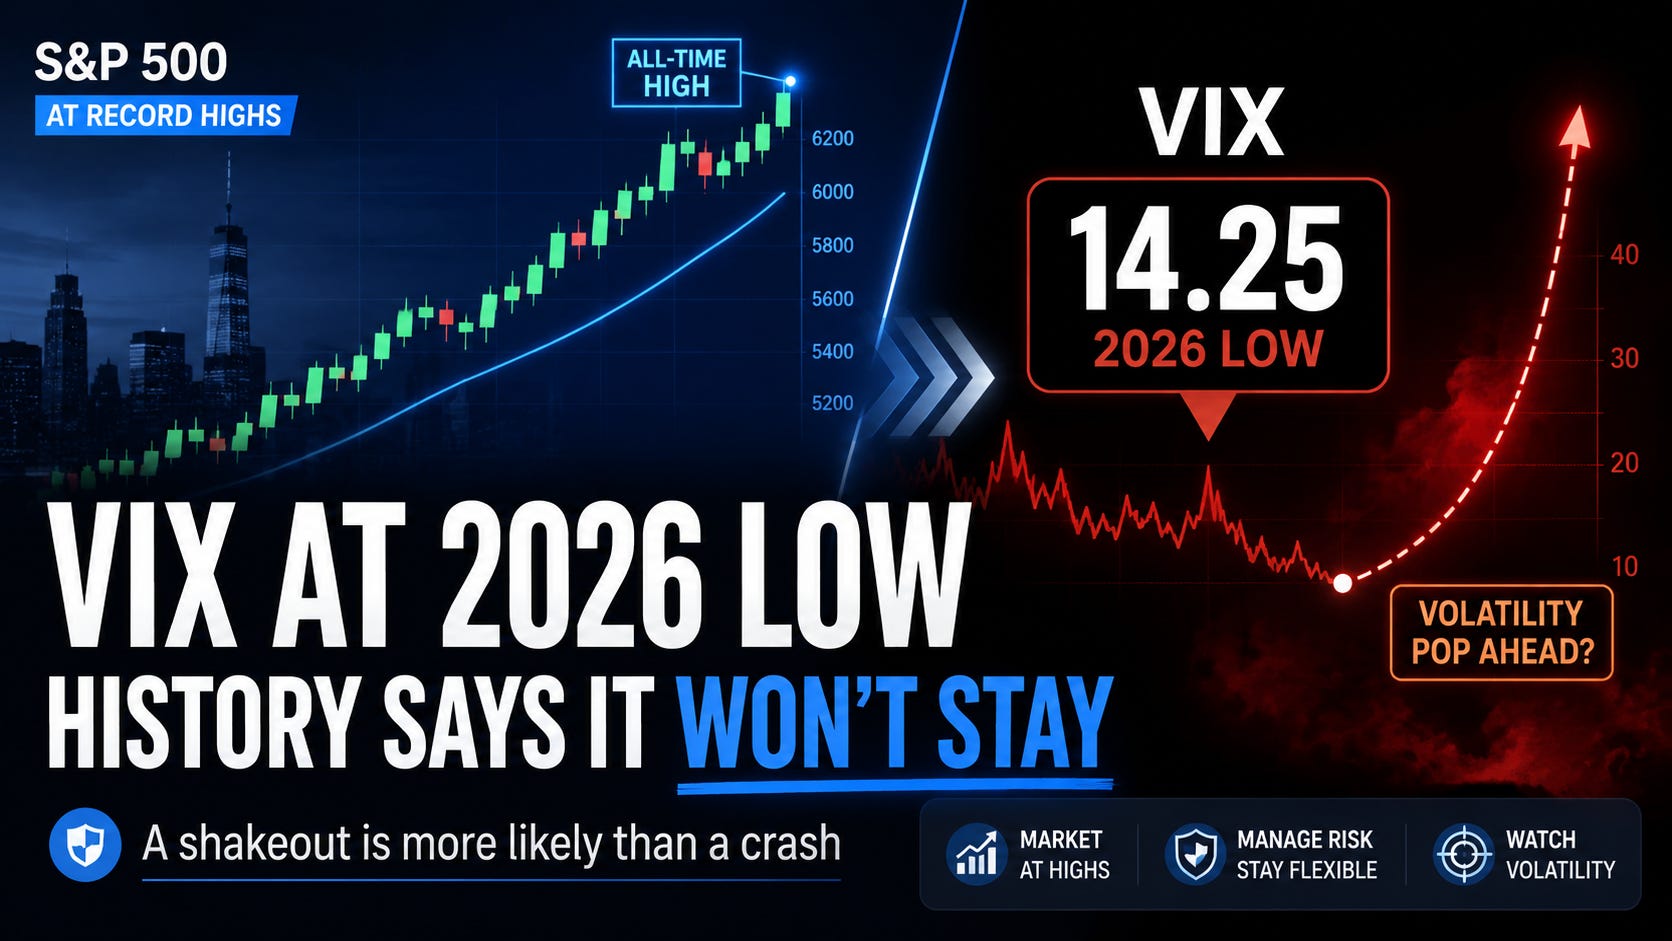
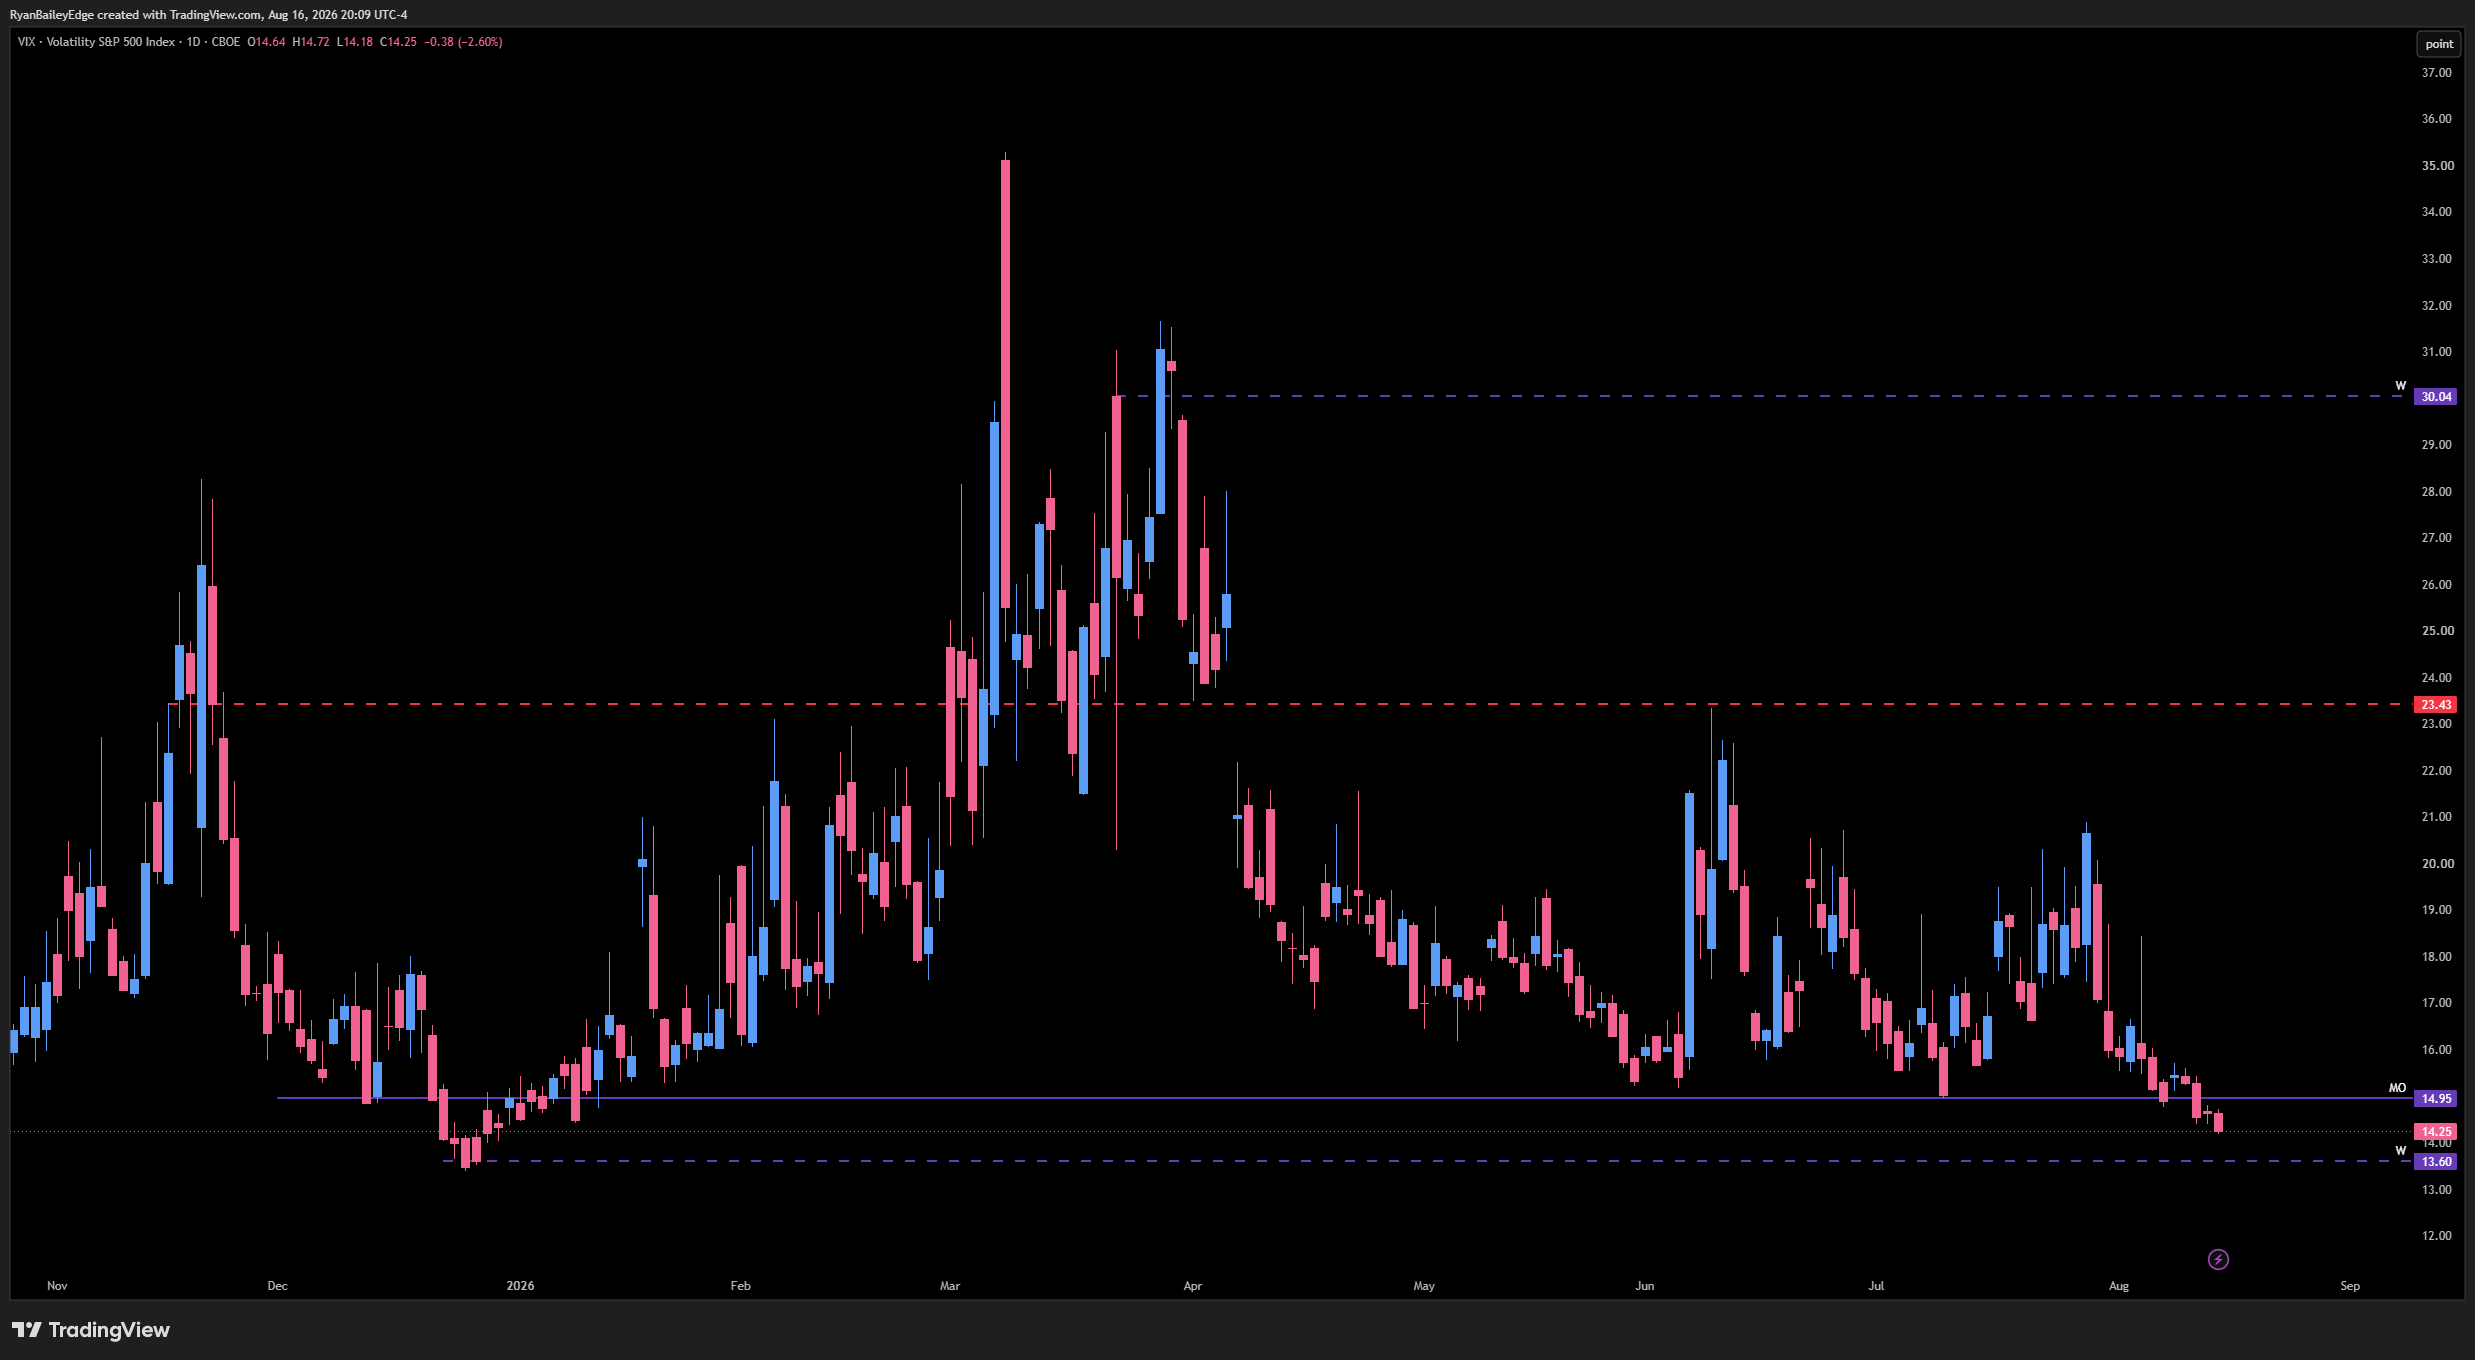
The VIX closed Friday at 14.25 — its lowest close of the entire year. I have spent two weeks telling anyone who will listen to stay sharp up here, and I keep getting the same question back: why?
So I pulled the data. Every VIX close since the index was created in
1990, every S&P 500 session over the same window, and the exact question I have been getting asked.
When the VIX gets down into the 12-to-15 zone while the market is sitting on its highs, the volatility pop becomes meaningfully more likely than usual — and the equity damage becomes meaningfully less likely than usual.
Both halves of that sentence are true at the same time. Most people only ever say the first half. That is what turns a useful observation into a permabear talking point, and I am not interested in doing that to you.
Here is the whole thing.
Start With the Part That Argues Against Me
If I lead with the scary numbers and bury the rest, I am selling you something. So let’s do it backwards.
A record high paired with a low VIX has historically been one of the better environments to be long. StoneX ran this in early August: filtering for the first instance in at least four weeks, there have been only forty occasions since 1990 where the S&P set a record high with the VIX below 15. Near-term returns came in slightly below other periods, longer-term returns came in better, and average drawdowns were lower across every horizon they studied.
Not one of those forty saw a 10% closing drawdown over the following thirteen weeks. Roughly 14% of ordinary periods do.
I ran my own version on looser parameters and got a slightly less clean result — my screen catches February 2020 and theirs doesn’t — but it lands in the same place: about 8% odds of a 10% drawdown inside thirteen weeks, against a baseline near 14%.
Different filters, same conclusion. This combination has historically looked like a stable bull regime, not the calm before the storm.
That is the honest starting point. Now let’s talk about what actually happens in the meantime.
What the Zone Actually Produces
Since 1990 the VIX has closed between 12.00 and 14.99 on 2,160 sessions — about 23% of all trading days. It is not rare. It is roughly one day in four.
Here is what followed those closes:
Window Odds of a 20%+ VIX pop Median peak VIX move Next 5 sessions 11.8% +5.2% Next 10 sessions 24.8% +10.2% Next 20 sessions 43.5% +17.1%
Read the right column first, because that is the honest base case. The typical outcome from a low VIX print is not a detonation. It is a drift of five to seventeen percent higher over the following month. From 14.25, a median twenty-session outcome puts you somewhere near 16.70.
That is a nothing move. That is Tuesday.
But look at the left column. Better than four in ten of these sessions saw the VIX close at least 20% higher within a month. And when that 20% move happened, the median time to get there was nine sessions.
Nine sessions. Not nine months.
How Long It Sits Down Here
This is the question I get most, and the answer surprises people.
Since 1990 there have been 215 distinct stretches where the VIX closed below 15. The median stretch lasted three sessions. A third of them lasted exactly one day.
Three days. That is the middle of the distribution. The VIX visits this zone, tags it, and leaves.
But the distribution has a long right tail, and the tail is where the stories come from:
Stretch Length Dec 1994 – Oct 1995 205 sessions Aug 2006 – Feb 2007 136 sessions Nov 2005 – May 2006 135 sessions Aug 2017 – Feb 2018 115 sessions Nov 2004 – Apr 2005 112 sessions
Eight separate stretches ran past a hundred sessions. So when someone tells you the VIX can’t stay down here — they are wrong, and history has the receipts. It can grind at these levels for the better part of a year.
The thing worth understanding is which kind of low you are looking at. A three-day tag after a violent stretch is a different animal than month eleven of a suppression regime. They carry different risks and they end differently. We’ll come back to that.
The Asymmetry Nobody Says Out Loud
Now the conditional test. Index within 1% of its all-time closing high, VIX between 12.00 and 14.99. That combination has occurred on 891 sessions since 1990 — a little under 10% of all history.
Here is the ten-session forward picture, next to a baseline of every other trading day:
Next 10 sessions This setup Every other day VIX pops 20%+ 31.2% 22.3% S&P closes down 1%+ 44.1% 51.6% S&P closes down 2%+ 22.4% 33.1%
Sit with that, because it is the most useful thing in this entire piece.
The volatility pop gets about 40% more likely. The equity damage gets less likely — noticeably less. On a random day the market is more likely to hand you a 2% drawdown than it is in this specific setup.
That is not a contradiction. That is the mechanism.
This is precisely why the knee-jerk gets bought. A headline lands, a data print surprises. The VIX rips 20 or 30%. The index gives back a percent or two. Then it gets absorbed — because the tape underneath is healthy, positioning is not stretched to the downside, and there are real buyers waiting on weakness.
I have watched this movie for two decades. The pop is loud. The damage is quiet. People remember the pop and build a bear thesis out of it.
The correct read is not “a crash is coming.” It is “a shakeout is more likely than usual, and it will probably be a gift.”
The Signal That Actually Fired
Everything above treats all sub-15 prints the same. They are not the same, and this is where the data gets sharp.
I isolated a narrower condition: the first VIX close below 15 after at least sixty consecutive sessions entirely above it. The first touch. Volatility coming down to this zone after a real absence, not sitting in it.
That has happened fourteen times since 1990. Thirteen have complete forward data.
Next 20 sessions First touch Baseline VIX pops 20%+ 61.5% 38.3% Median peak VIX move +24.6% +14.6% S&P closes down 2%+ 38.5% 44.2%
Small sample, and I will say that plainly — thirteen instances is thirteen instances. So I tested every reasonable definition of “absence,” from twenty sessions out to ninety. The 20%-pop probability ran between 52% and 80% at every threshold. The median peak move ran +22% to +28% at every threshold.
And notice the bottom row held its shape. Even here, the equity damage stays at or below baseline while the volatility number runs far above it. Same story, just louder.
The two most recent first touches both happened with the index at a record high:
Date VIX Peak VIX move Worst S&P close July 25, 2025 14.93 +36.5% −2.36% Dec 11, 2025 14.85 +18.7% −2.60%
Both bought back. Both a gift to anyone with cash and a plan.
The current first touch fired on August 7, 2026, with the VIX at 14.90. We are six sessions into it.
Third time in thirteen months.
Where This Goes Wrong
I promised you the outliers, and the outliers are the reason I keep saying don’t get complacent instead of don’t worry about it.
February 2020. My screen fires on February 12th — VIX at 13.74, index at a record high. The market topped seven sessions later. By the end of that month the VIX had closed at 40.11. That is a 192% move from the setup print, and the S&P gave up better than 12% in ten sessions.
Twelve sessions from “nothing to see here” to the fastest bear market in history.
February 2018. The VIX ran 115 straight sessions below 15 through the back half of 2017, a stretch that averaged 10.64. The run ended February 1st at 13.47. Four sessions later it closed at 37.32 — a 115.6% single-day move — and the S&P dropped 4.1% on the day, roughly 10% peak to trough across the episode.
The detail almost nobody mentions: the market warned twice first. The VIX popped 24.9% on January 29th, then 28.5% on February 2nd, before the real event. Two warning shots inside five sessions.
One I am deliberately leaving out. You will see the August 2024 yen-carry unwind cited constantly as a low-VIX blowup. It wasn’t. The VIX closed at 16.36 the session before that move started. It was never in this zone. It is a great volatility story and it is not evidence for this thesis, and I would rather tell you that than pad the argument.
The tails are real. They are also tails. Thirteen weeks out, this setup produces fewer 10% drawdowns than a random day does.
Why This One Has a Tell
The single most interesting thing on my screen right now is not the VIX. It is the shape of the curve behind it.
Friday’s closes: the nine-day VIX at 10.61. The thirty-day VIX at 14.25. The three-month VIX at 18.46.
The three-month is sitting 29.5% above spot. That ratio — thirty-day against three-month — is in the 1.4th percentile of every session since 2009. The curve has been this steep or steeper on roughly one and a half percent of days in seventeen years.
Do the arithmetic on what that means. A 20% pop from 14.25 lands at 17.10. A 30% pop lands at 18.53.
A 30% VIX pop puts you almost exactly where the three-month curve already is.
The options market is not saying nothing will happen. It is saying nothing will happen this week. Those are entirely different statements, and the gap between them is one of the widest I have seen.
One more piece. VVIX — the volatility of volatility, essentially what people are paying for VIX upside — closed at 87.48. On days the VIX has historically closed in this 12-to-15 zone, VVIX has averaged 85.1.
We are above that. Somebody is already paying up for protection.
That is the opposite of what a complacency trap looks like. In 2017, VVIX collapsed because nobody wanted the hedge. Right now the hedge is bid.
And Why It Is Not 2017
I keep seeing the 2017 comparison and it does not hold. Look at the two side by side.
2017 2026 YTD Average VIX 11.09 18.78 Sessions below 15 97.2% 5.0% Sessions below 12 82.9% 0.0% Highest close 16.04 31.05
Ninety-seven percent of 2017 sat below 15. Five percent of 2026 has. This year the VIX printed 31.05 in March, and it is currently down about 45% from its ninety-session high — a collapse that took eighty-seven sessions.
There is no year-long short-volatility build-up to unwind here, because there has been no year-long calm. This is a fast crush after a violent stretch, not a seasoned suppression.
That cuts both ways. It means the 2018-style product-unwind risk is much lower than the comparison implies. It also means this low is young, untested, and sitting directly in front of the most crowded calendar of the quarter.
The Mechanism Underneath
A quick word on why this happens, because the pattern is only useful if you understand the plumbing.
When implied volatility compresses, dealers end up positioned in a way that stops dampening moves and starts amplifying them. Long gamma means selling rallies and buying dips, which smooths the tape. Flip it, and hedging runs with the move instead of against it — selling into weakness. Layer on the modern structure: Cboe reported that same-day expiry contracts made up 59% of total S&P 500 options volume in 2025. That is a lot of very high-gamma paper concentrating hedging flow into short windows.
Then there is the cushion. The variance risk premium — the gap between what the VIX prices and what the market actually delivers — is thinnest exactly here. When the VIX has closed between 12 and 15, that cushion has averaged about 2.9 points. Above 30 it averages roughly 6.
Selling volatility down here pays the least it ever pays, at the moment the position has the most room to move against you. And cheap protection means very little protection outstanding, because nobody feels the need to own it.
None of that predicts a crash. All of it explains why the moves that do happen from these levels tend to be sharp rather than gradual.

What I Am Actually Doing About It
Nothing dramatic. That is rather the point.
I am not short. I am not hedged to the teeth. I am not telling you to sell anything, and if you take this piece as a top call you have read it backwards.
What I am doing is refusing to get lazy. Sizing gets deliberate. Stops get honored rather than negotiated. I am not adding leverage into a tape pricing sub-1% daily moves ten days ahead of the densest catalyst window of the quarter — Fed minutes Wednesday, Nvidia after the close on the 26th, and Kevin Warsh’s first Jackson Hole keynote as Chair thirty-six hours later on the 28th. Then a September Fed meeting still close to a coin flip.
Spot volatility is priced for a quiet week. The curve is priced for that week to end.
Here is the part I want to land hardest, because it is where I actually live: a pullback here would be a good thing. A 20 or 30% VIX pop that shakes the index down a percent or two is not a threat to this bull market. It is maintenance. It flushes weak hands, resets positioning, and brings in buyers who have been staring at record highs wondering how they missed it.
I want that. The data says it is more likely than usual right now — and the same data says it is very unlikely to become something worse.
That is not a bearish message. That is a bull asking you to keep your hands on the wheel.
The VIX down here is not a sell signal. It is a pay attention signal, and the difference between those two is most of what separates traders who survive from traders who have great stories.
Stay sharp. The pop is coming, it will probably be loud, and it will probably be a buy.
Until next time—trade smart, stay prepared, and together we will conquer these markets!
Ryan Bailey, VICI Trading Solutions.