
The Silent Alarm: Why a $12 VIX Should Terrify You
We’re sitting at all-time highs with the cheapest disaster insurance in years. History says that’s not a green light—it’s a flashing red warning.

The S&P 500 is trading above 6,950.
New all-time highs. The headlines are triumphant. The bulls are vindicated. And the VIX Wall Street’s so-called “fear gauge” is sitting in the $13 handle, rapidly approaching $12.
On the surface, this looks like the healthiest market imaginable. Strong economy. Low volatility. Stocks going up.
But I want to show you something that should give you pause. Because beneath this calm surface, there’s a coiled spring of risk that most investors don’t see and the last time we ignored these signals, it cost people a lot of money.
This isn’t fear-mongering. It’s math. And the math is screaming.
What a $12 VIX Actually Means
Let’s strip away the colloquial “fear gauge” label and understand what a VIX at 12-13 actually tells us about market expectations.
The VIX isn’t a sentiment survey. It’s a mathematical derivation of the implied volatility of S&P 500 options with roughly 30 days to expiration. When the VIX trades at 12, the options market is pricing in an annualized movement of 12% for the index.
To translate that into daily expectations, we divide by the square root of trading days:
Expected Daily Move = 12 ÷ √252 ≈ 0.75%
At a VIX of 12, the market is pricing in daily moves of approximately three-quarters of one percent. That’s it. The options market the people who actually have money on the line is telling you that they see negligible probability of a significant drawdown in the immediate future.
Here’s why that should concern you: implied volatility is the cost of insurance. When the VIX is this low, it means disaster insurance (puts) is historically cheap because demand has evaporated. Everyone is comfortable. Everyone is unhedged. Everyone is leaning the same direction.
And that’s precisely when markets become fragile.
The Complacency Regime: Where We Are Right Now
I’ve analyzed VIX data going back to 2006 and categorized market regimes based on how risk is priced. Here’s what the data shows:
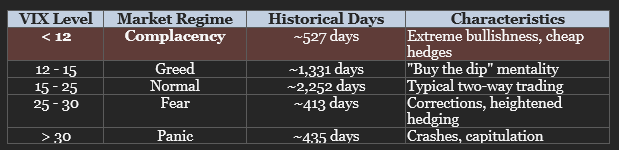
Look at those numbers. Trading in the Complacency zone (VIX < 12) is the exception, not the norm. It represents a state where the market has largely abandoned hedging. While this regime is often associated with the late stages of a bull market, it’s fraught with hidden danger.
When VIX is between 12-15 (the “Greed” zone), participants are optimistic but maintain some caution. As the index slips below 13 and approaches 12, that caution evaporates completely. This creates a fragile market structure where a small exogenous shock can trigger a cascade of selling because almost nobody holds adequate downside protection.

The Asymmetric Trap
Here’s the critical insight that most investors miss: the risk/reward of a sub-13 VIX is wildly asymmetric—and not in your favor if you’re long and unhedged.
Think of volatility like a rubber band. Unlike stock prices (which theoretically have infinite upside and limited downside to zero), volatility cannot go to zero and rarely stays at historical highs. It oscillates around a long-term mean of approximately 19.5.
When VIX is compressed near 12-13, consider the math:
The Floor: The VIX has a “soft floor” around 9.0. It has never traded significantly below this level because there’s baseline structural demand for hedging from regulated entities like insurance companies and pension funds. From 12, maximum downside is roughly 3 points.
The Ceiling: The VIX has a theoretically unlimited ceiling. It hit 82.69 in March 2020. It reached an intraday high of 89.53 in October 2008. It spiked above 60 just this past April.
So from a VIX of 12:
• Downside for calm: ~3 points (move to 9)
• Upside for chaos: 20, 40, or 60+ points
This is why veteran traders say “when the VIX is low, look out below.” It’s not superstition…. it’s the mechanics of mean reversion creating a deeply unfavorable risk profile for the unhedged.
History Doesn’t Repeat, But It Rhymes Loudly
Let me walk you through three historical periods that should inform how we think about today’s market.
Case Study #1: The Volmageddon Precursor (2017-2018)
This is the most pertinent parallel to our current environment.
The Setup: Throughout 2017, the VIX averaged 11.10 one of the lowest annual averages on record. The S&P 500 went over 400 consecutive trading days without a 5% correction, the longest such streak in 50 years. The market became conditioned to believe volatility was a relic of the past.
The Psychology: “Short volatility” strategies became a crowded trade. Selling VIX futures or buying inverse-VIX ETFs like XIV was seen as “free money.” Leverage built up in the shadows.
The Unwind: On February 5, 2018 ”Volmageddon” this complacency shattered. A confluence of minor inflation fears and technical positioning caused the VIX to spike from ~17 to over 37 in a single session. A 100%+ increase in implied volatility. The inverse-volatility products were wiped out. The S&P 500 corrected 10% in days.
The Lesson: The lower the VIX goes, the more leverage builds in the system. When the trend turns, it doesn’t do so gradually…it explodes.
Case Study #2: The Pre-Financial Crisis Calm (2006-2007)
Before the Global Financial Crisis, the VIX spent considerable time in the 10-12 range during late 2006 and early 2007. This period of low volatility masked deteriorating fundamentals in U.S. housing and mortgage-backed securities.
While equity markets ground to new highs, credit spreads began to widen, a divergence worth noting. The complacency of 2007 served as the fuel for the panic of 2008. The VIX didn’t just normalize to 20; it trended to 30 and eventually hit 80.
Case Study #3: “Liberation Day” (April 2025)
This one is fresh. It happened this year. And the fact that we’ve already forgotten it is itself a warning sign.
The Pre-Crash Environment: In early 2025, the VIX was trading comfortably in the 14-22 range. The narrative was “Goldilocks” economics—growth without inflation, deregulation on the horizon, AI optimism everywhere.
The Catalyst: On April 2nd, “Liberation Day,” sweeping tariffs were announced—10% universal, up to 50% for specific countries.
The Market Reaction:
• The S&P 500 fell roughly 18% over the subsequent 35 days
• 12% of that drop occurred in just four trading sessions
• The VIX skyrocketed from under 17 to above 60 in just eight trading sessions
This underscores the “gap risk” inherent in modern markets: volatility doesn’t drift higher. It gaps higher. There’s no gradual escalation that gives you time to react. One day you’re looking at VIX 17, eight days later it’s VIX 60.
The tariffs were paused on April 9th, leading to a V-shaped recovery. By December, the market had forgotten the lesson entirely, pushing VIX back to 12-13.
Here’s a summary of major VIX spikes from low levels:
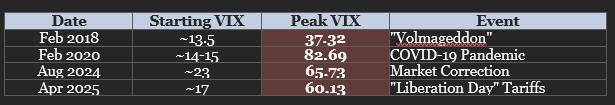
Notice a pattern? Every single one of these events started from a place of relative calm. Not one of them gave advance warning through a gradually rising VIX.
Why the VIX Might Be “Broken”
Here’s where it gets really interesting—and concerning. The current VIX level of 13 may not accurately reflect the true latent risk in the market. Since 2022, structural changes in how participants trade volatility have fundamentally altered the VIX’s behavior.
The 0DTE Phenomenon
Zero-days-to-expiration options—contracts that expire the same day they’re traded—have exploded in popularity. By mid-2024, 0DTE options accounted for over 50% of daily S&P 500 options volume.
Here’s the problem: The VIX is calculated using SPX options with 23 to 37 days to expiration. It’s specifically designed to measure 30-day expected volatility.
As institutional hedging demand has shifted from 1-month puts (which boost the VIX) to 0DTE puts (which don’t), the demand for 30-day options used in the VIX calculation has decreased. Lower demand means lower premiums, which mathematically produces a lower VIX reading.
The hedging is still happening—it’s just happening in a timeframe the VIX doesn’t capture. This creates “volatility laundering” where risk is compressed into intraday timeframes, leaving the 30-day VIX artificially sedated.
The Dispersion Trade
Another massive structural force suppressing implied volatility is the “Dispersion Trade.” Here’s how it works:
Hedge funds sell volatility on the index (short SPX options) while buying volatility on individual constituents (long options on Apple, NVIDIA, Microsoft, etc.).
The Mechanic: Index volatility is a function of two variables—the volatility of individual stocks AND the correlation between them. If stocks move independently (Energy up, Tech down), the index moves very little even if individual names are volatile.
The dispersion trade profits when the index remains calm while individual stocks show variance. This creates massive supply of index volatility, keeping VIX crushed. As long as stock correlations remain low, the VIX can stay at 12-13 despite significant single-stock risk.
The Danger: In a market panic, correlations spike to 1.0—everything goes down together. When this happens, the dispersion trade blows up, forcing funds to buy back their short index volatility positions. This “short covering” can cause the VIX to spike violently, far beyond what fundamental news would justify.
The Mechanics of a Crash: Why Low VIX Makes Markets Dangerous
Why does a VIX of 12-13 make the market more dangerous rather than safer? The answer lies in options Greeks—the risk parameters dealers use to hedge their books.
The Short Gamma Problem
When dealers are “short gamma,” they must sell the underlying index as it falls and buy it as it rises to remain hedged.
If the S&P drops 1%, dealers short gamma must sell more S&P futures to hedge their changing delta. This selling creates further downward pressure, which forces more selling. This feedback loop is what turns a 1% dip into a 3-4% rout in a single day.
A VIX of 12 indicates the market is not pricing in this feedback loop. But the positioning that would create it is still there.
The Vanna Trap
Vanna measures how an option’s delta changes when volatility changes. Here’s the mechanism:
• Market drops
• VIX spikes (volatility rises)
• Rising volatility changes Vanna, forcing dealers to sell stocks
• Selling causes market to drop further
• Repeat
This “Vanna-Vol” loop is a primary driver of modern flash crashes. In a sub-13 VIX regime, the Vanna exposure is masked. But a spike from 12 to 20 represents a ~66% increase in volatility, triggering aggressive Vanna-based selling flows.
What to Watch: Second-Order Warning Signals
Since the headline VIX may be structurally suppressed, we need to look at “second-order” indicators to gauge true risk.
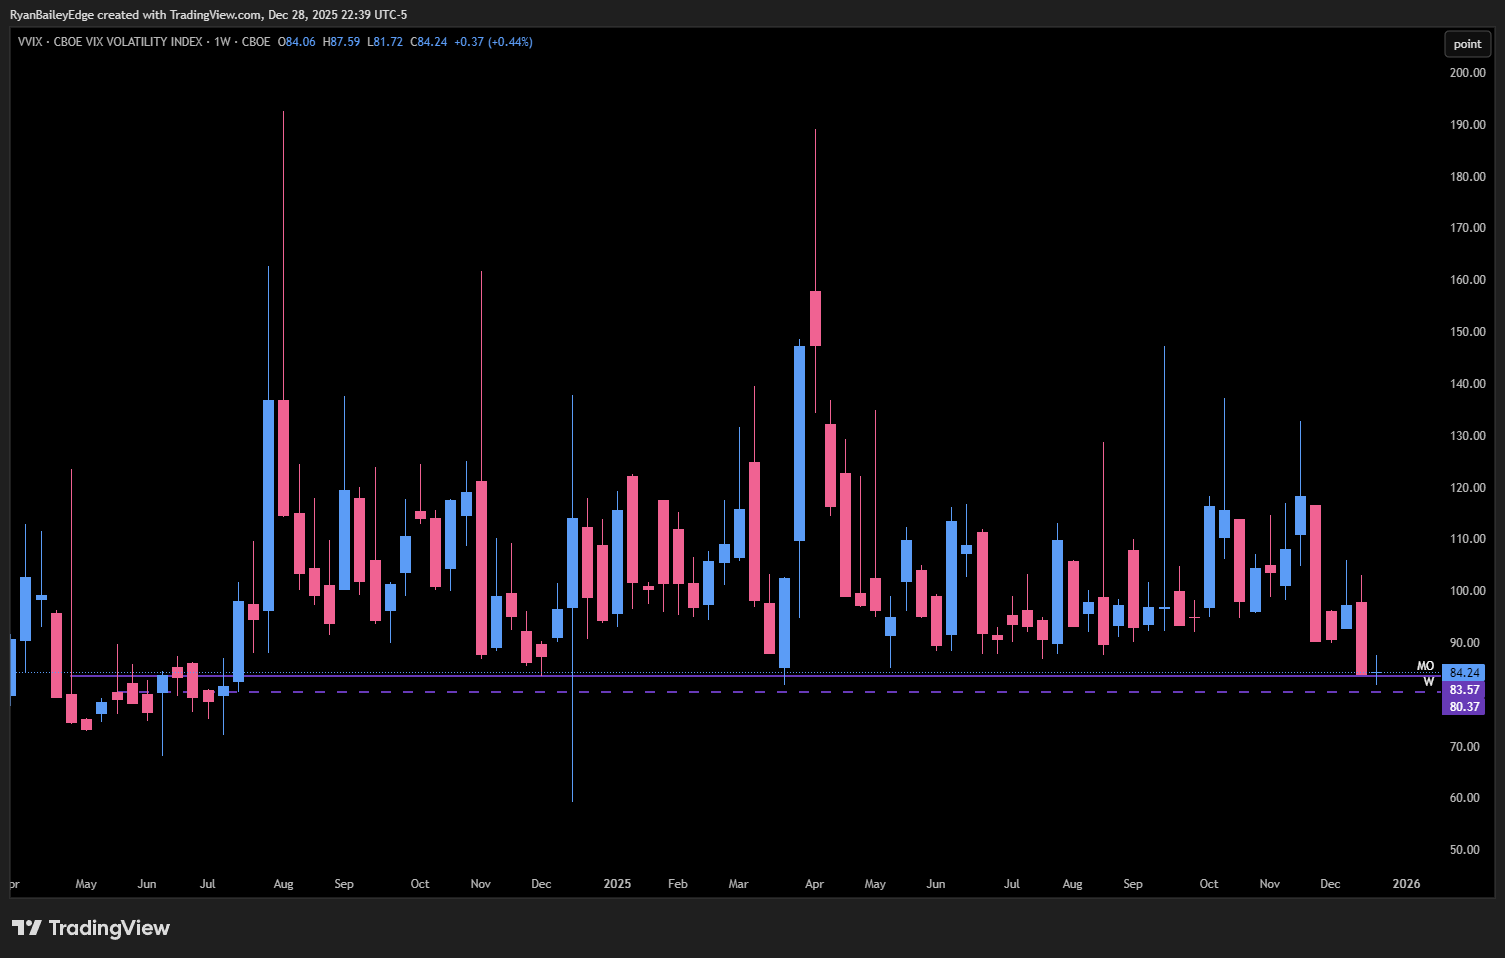
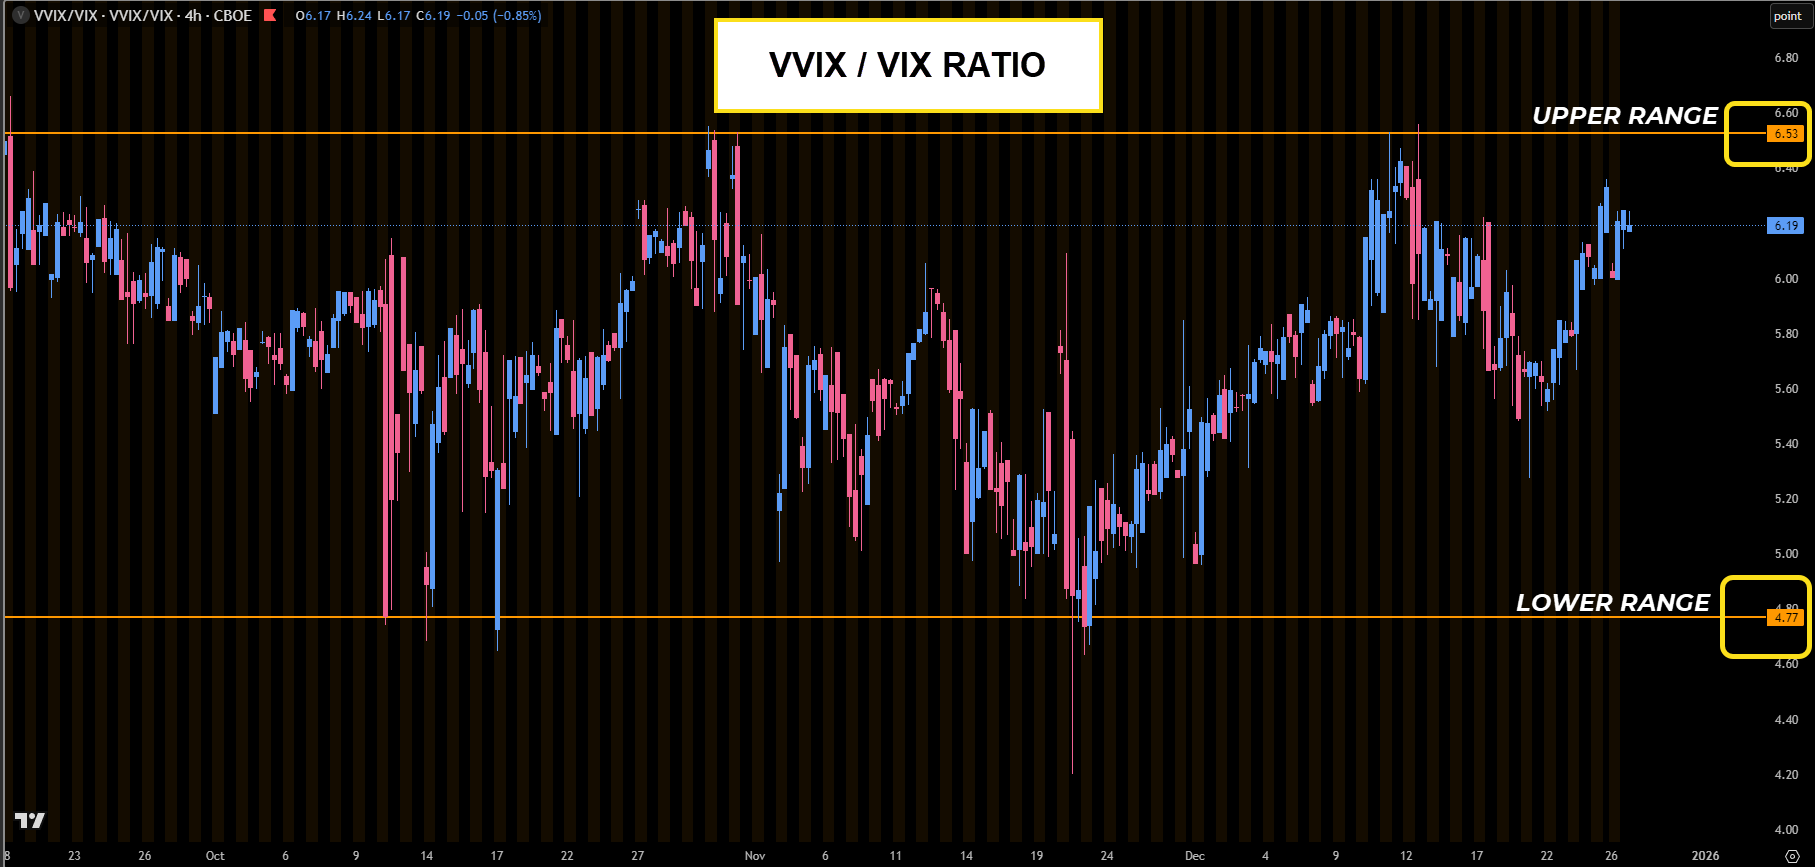
The VVIX Divergence
The VVIX measures expected volatility of the VIX itself—essentially “insurance on the insurance.”
The Warning Signal: When SPX is rising (or flat), VIX is falling (complacency), but VVIX is rising—smart money is quietly buying VIX calls. They’re betting the calm won’t last.
If VVIX rises above 150 while VIX is below 15, it’s a high-probability signal of an imminent VIX spike. This divergence preceded both the COVID crash and 2018’s Volmageddon.
The VIX Futures Term Structure
Normally, VIX futures are priced higher than spot VIX (contango). A steep contango encourages selling volatility to capture roll yield, reinforcing low volatility.
Watch for flattening. If the spread between spot VIX and 3-month VIX narrows without a market drop, forward-looking fear is building beneath the surface.
Skew
Skew measures the relative price of out-of-the-money puts versus calls. High skew in a low VIX environment is bearish—it shows institutional investors are terrified of tail risk even if they don’t expect daily volatility. They’re buying crash protection quietly while the headline VIX stays asleep.
The Bottom Line
As we close out 2025 with the S&P above 6,900 and VIX in the $13 handle approaching $12, we are not looking at a healthy, risk-free market. We’re looking at structural complacency and volatility suppression.
The VIX is being artificially depressed by:
• 0DTE options shifting volume away from VIX calculation
• Dispersion trading creating massive supply of short index volatility
• Yield-seeking ETFs systematically selling calls
But these mechanisms don’t remove risk—they transform it. They convert “normal” volatility (daily 1% moves) into “tail” volatility (rare but catastrophic 10% moves). The market has become a binary system: incredibly calm (VIX 12) or incredibly chaotic (VIX 60).
Key Takeaways
1. Complacency is a signal. A VIX below 13 is a loud message that insurance is cheap and risk is mispriced.
2. The reversion is violent. Volatility doesn’t drift higher from 12—it explodes. The transition from the 12 handle to the 20 handle often happens in 1-3 trading days.
3. Hedging is prudent. In this regime, the asymmetric payout of owning long volatility (VIX calls or SPX puts) is mathematically favorable. Cost of carry is low; potential payoff in a Liberation Day-style event is exponential.
4. Watch the signals. Monitor VVIX and VIX term structure. If VVIX starts rising while VIX remains dead, the coil is about to snap.
The current VIX level shouldn’t be viewed as a green light for unbridled bullishness. It should be viewed as a flashing red light on the dashboard of market structure—a warning that the potential energy for a downside correction is reaching critical mass.
The market can stay irrational longer than you can stay solvent. VIX can grind lower before it spikes. But the setup we’re in right now is one that has preceded every major volatility event of the past decade.
Insurance is cheap. The asymmetry is in your favor if you buy protection.
The question isn’t whether volatility will return. It’s whether you’ll be positioned for it when it does.
Until next time—trade smart, stay prepared, and together we will conquer these markets!
Ryan Bailey
Vici Trading Solutions