
The S&P Just Did Something It’s Only Done 4 Times Since WWII
A 16%+ two-month rip — only 4 precedents since WWII. Three were recoveries. One was 1987. The difference matters.

The headlines are triumphant. Records every session, the ninth straight weekly gain, AI everything, and a tape that refuses to give anyone a pullback to buy. The bulls are vindicated, and frankly, they’ve earned it.
And buried under all that confetti is one chart Deutsche Bank put out this week that almost nobody is pairing with the celebration. Not because it’s bearish. Because it’s rare.
An S&P move this fast has only happened four other times since World War II. Three of those times, it was the best thing that could possibly have happened. One of them was the spring before Black Monday.
The speed isn’t the warning. The context is. A rally this violent is almost always a recovery signal — and the single time it wasn’t, there was no recession to recover from. That’s the entire post in one sentence. Let me show you why it’s true, and why the honest answer here is “watch the levels,” not “sell the news.”
What Deutsche Bank Actually Found
Here’s the deal. The S&P is up more than 16% over April and May. According to Deutsche Bank Research — this is Jim Reid and Henry Allen’s work, not a FinTwit screenshot — a two-month surge of that magnitude has happened only four other times since WWII.
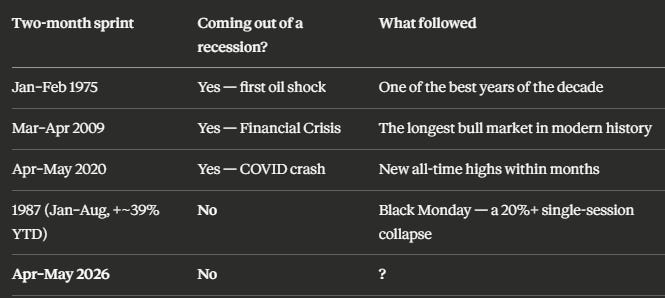
Three of those four were the same animal: a vertical snap-back off a major shock.
January–February 1975 — the bounce out of the first oil-shock bear market.
March–April 2009 — the launch point of the post–Financial Crisis recovery.
April–May 2020 — the COVID V, off the March lows.
In all three, the market was emerging from a recession. The economy had been crushed, valuations had been gutted, and when the fog lifted, capital sprinted back in all at once. That sprint is what a 16% two-month gain looks like. It’s not a top signal — it’s a regime change being priced in real time.
The fourth instance is the one that doesn’t fit. As Allen put it, the speed of this rally is bucking every recent precedent for an economy that isn’t emerging from recession. The last time the S&P ran like this without a recession to climb out of was the few months before the 1987 crash.
Read that table the way it deserves to be read. Four precedents, three of them outright bullish. If you stopped here, the base rate says “rapid rallies tend to keep going.” The folks at the Motley Fool ran the parallel number — nine-week win streaks like this one have averaged roughly a 10% gain over the following year. The momentum crowd isn’t wrong.
But notice what actually separates the one bad outcome from the three good ones. It isn’t the speed. The speed was identical. It’s whether there was a shock being cleared — cheap valuations, forced sellers capitulating, a wall of sidelined cash with somewhere to go. In 1975, 2009, and 2020, there was. In 1987, there wasn’t. And in 2026, there isn’t either.
That’s the cohort we’re sitting in. Not “we’re about to crash.” Just — for the first time in a while — an uncomfortable one.
The 1987 Backdrop, Honestly
Let me be fair to both sides of this, because lazy analogies are how people lose money.
The 1987 setup did rhyme with today in ways worth respecting. By late August of that year, the S&P was up around 39% year-to-date — a melt-up, not a recovery. The Fed had been hiking rates into it. And there were loud, contemporary fears about the trade deficit and the budget deficit that, at the time, looked enormous. A market priced for perfection, a tightening central bank, and a fiscal picture people didn’t trust. If that backdrop doesn’t make you raise an eyebrow in 2026, you’re not paying attention.
Here’s the other side, and it’s the part the doom-posters skip. The thing that turned 1987’s stretched market into a one-day collapse was a specific, mechanical accelerant: portfolio insurance — automated selling programs that dumped futures as the market fell, which forced more selling, which triggered more programs. A feedback loop with no circuit breakers, because circuit breakers didn’t exist yet. They do now.
We don’t run portfolio insurance anymore. What we do run is a tape increasingly dominated by its own reflexive flows — zero-day options, volatility-targeting funds, and trend-following systematics that all lean the same direction at the same time. So the specific 1987 trigger isn’t loaded. But the broader idea — that modern market structure can turn an ordinary down-day into an air pocket — absolutely still applies.
Net it out: the backdrop echoes, the trigger mechanism has changed. That’s neither a green light nor a fire alarm. It’s a reason to know your levels cold.
What’s Actually Carrying This Tape
The second thing the 1987 analogy gets you thinking about is who is doing the lifting — and this is where 2026 has its own fingerprint.
The index is up roughly 11% on the year. Information technology — the largest sector — is up more than 27%. That gap tells you the rally is narrow. A handful of AI and semiconductor names are doing the heavy lifting while a lot of the market is treading water. Bespoke flagged it plainly this week: breadth has been narrow. “Breadth” just means how many stocks are actually participating — and right now, fewer than the record highs would suggest.
Narrow leadership is a fragility condition. When a few mega-caps are holding up the whole tape, any crack in those names gets amplified across the index. You got a live preview of that this week when Alphabet posted its largest one-day market-cap loss ever on a stock-sale plan. Concentration cuts both ways — it’s been the engine on the way up, and it’s the exposed flank if sentiment turns.
And here’s the honest counterweight: narrow breadth is a condition, not a timing signal. Leadership has been concentrated for a long stretch, and it can stay that way for a long stretch more. Plenty of traders have gone broke shorting a narrow market that simply kept getting narrower. It tells you the rally is more brittle than it looks. It does not tell you when.

So What Do You Actually Do With This
Nothing about this is a sell signal. Let me be clear about that, because the entire reason this data is worth writing up is that it’s interesting, not because it’s scary.
You have a statistical curiosity built on a sample size of four. You have three bullish outcomes and one famous bad one. You have a backdrop that rhymes with 1987 in the macro and differs from it in the mechanics. Anyone who turns that into “the crash is coming” is selling fear, and we don’t do that here.
What you do instead is what you should always do: stop trading the narrative and start trading the levels.
The lines that matter are the ones in front of you, not the one from 38 years ago. One note before the map: every number that follows is SPX cash-index, not ES futures — if you’re trading the contract, shift for the basis (the spread between cash and the front-month future). The index is pinned at the highs, so the map runs in two directions — one trigger up, a ladder down. To the upside, 7520 is the first critical daily level beneath the all-time high that’s still untested; the rally needs to play through it and hold to keep the progression higher, and 7583 is the support propping up the current structure right under the ATH. Lose those and the first real question gets asked at 7412 — the next major untested daily support, the one that has to hold while everything above it already has been tested. Slip under it and the air gets thin fast toward 7200. And the level that actually matters for this whole thesis is 6939 — a heavy support shelf off the weekly timeframe. That’s the one that, if it breaks, stops being a pullback and starts being the regime change. Hold it, and “rare” stays nothing more than rare. Lose it, and the market is telling you which of the four it picked.
This is exactly the kind of regime the daily trade plans and the live room are built for — defined levels, defined invalidation, and a process that doesn’t care what year it rhymes with. When the tape is this stretched and this narrow, having your levels mapped before the open is the difference between reacting and guessing.
I’ve stood on a trading floor through more than one rally that felt invincible. The ones that ended badly never rang a bell on the way out — they just quietly stopped going up, and the people who’d confused momentum for safety were the last to notice. That’s not a prediction. It’s a posture.
Rare isn’t the same as doomed. Invincible isn’t the same as safe. Watch your levels, respect the data without bowing to it, and let the market tell you which of the four it wants to be.
Until next time—trade smart, stay prepared, and together we will conquer these markets!
Ryan Bailey, VICI Trading Solutions.