The S&P 500 Golden Cross: A 93% Win-Rate Signal That No One Is Talking About
A deep dive into the 100/200 DMA 'Golden Cross' that just occurred on the S&P 500, and what its remarkable historical track record could mean for the market over the next two years.
In a market that often feels driven by daily headlines and short-term noise, it’s rare for a truly significant, long-term technical signal to emerge. But this 2 week ago, one did.
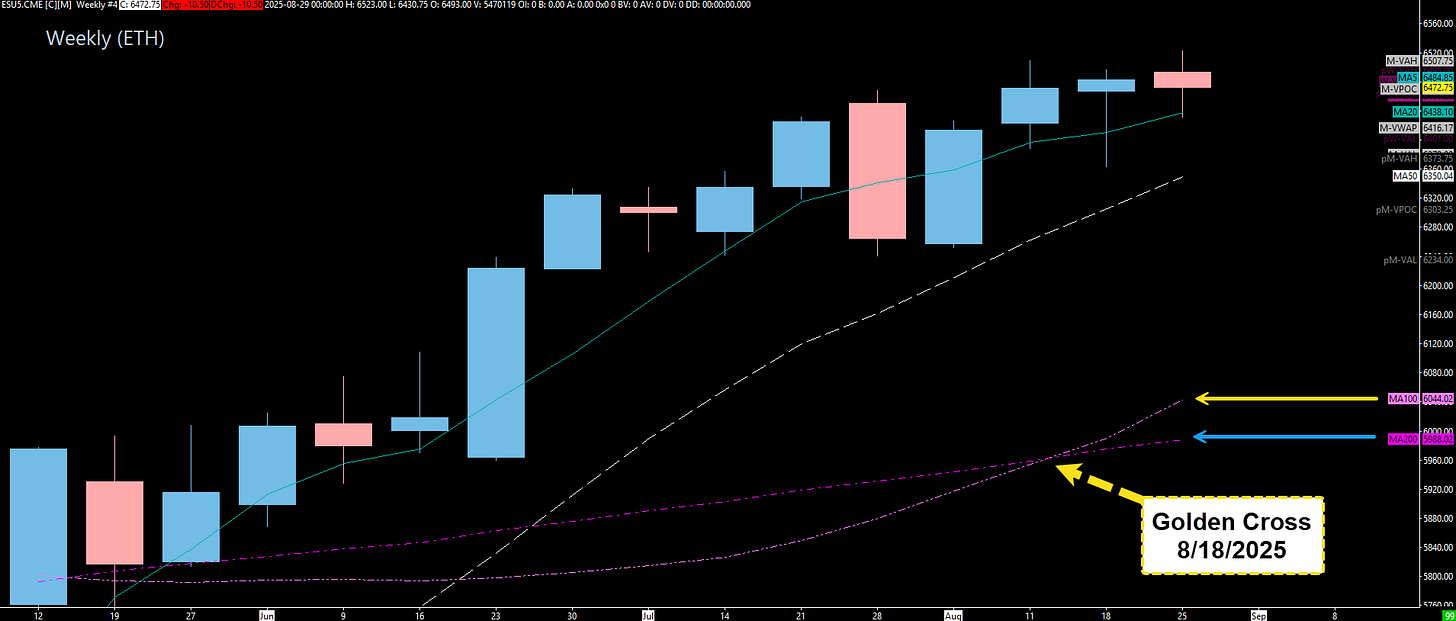
Beneath the surface of the day-to-day chop, a major event just took place on the S&P 500 charts: the 100-day moving average crossed above the 200-day moving average.
This isn’t just another minor indicator. This is a slow-moving, powerful signal with a historical track record that is frankly stunning. For traders and investors looking for a map of the longer-term trend, this is a moment to pay very close attention.
What Just Happened? The 'Tanker Ship' Signal
Many traders are familiar with the "Golden Cross," which typically refers to the 50-day moving average (DMA) crossing above the 200 DMA. The 100/200 DMA crossover is its bigger, more deliberate cousin.
50/200 DMA Cross: This is like a speedboat changing direction. It’s faster, more frequent, and captures shorter-term shifts in market momentum.
100/200 DMA Cross: This is like a massive tanker ship changing direction. The turn is much slower and takes far more time and energy. But once it has turned, it signifies a more significant, durable, and committed change in the long-term trend.
Because it’s slower, the 100/200 DMA cross is less prone to the "whipsaws" and false signals that can plague shorter-term indicators. When this signal triggers, history tells us to listen.
The Historical Data: What Happens Next?
This signal is rare, having occurred only about 15 times on the S&P 500 since 1980. But when it does, the historical performance that follows is overwhelmingly bullish.
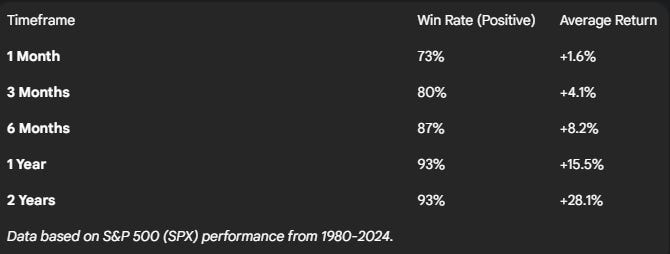
The table below breaks down the average performance of the S&P 500 after the 100-day moving average crosses above the 200-day.
The key takeaways from these statistics are impossible to ignore:
A Remarkably High Probability of Success: The chance of the market being higher a year after this signal is 93%. In the world of trading, where we deal in probabilities, a 9-in-10 historical success rate for a directional move is an incredibly powerful edge.
Consistent, Building Momentum: This isn't just a short-term pop. The positive returns and high win rates build consistently over the following one to two years, indicating the start of a durable, long-term uptrend.
A Professional's Perspective: Important Caveats
As compelling as this data is, it's crucial to apply the right context. This is not a "blindly buy and forget" signal.
Confirmation, Not Prediction: This signal does not predict a market bottom. It confirms that a bottom is likely already in the past and that a new, sustainable uptrend has begun. It's a trend-following indicator, not a crystal ball.
Drawdowns Are Still Possible: A Golden Cross is not a shield against short-term volatility. Even within the powerful uptrends that followed this signal, market corrections occurred. After the cross in late 2015, for example, the market experienced a sharp 10% pullback in early 2016 before resuming its massive bull run. Risk management remains paramount.
In conclusion, the market has just given us a historically reliable, data-backed signal that the long-term trend has shifted in favor of the bulls. While we must always trade the price action in front of us, this "tanker turn" provides a powerful statistical tailwind that could define the market's direction for the next one to two years.
Until next time—trade smart, stay prepared, and together we will conquer these markets!
Ryan Bailey,
VICI Trading Solutions


