
The Difference Between “Feeling” and “Knowing”
Why I just recoded my entire trading setup to focus on one thing: Probability.


Hello Team,
We had a strategy meeting recently where I had a bit of a “lightbulb moment” that I want to share with you.
We spend so much time in this industry talking about “conviction.” We talk about having a “gut feel” for the market. But if we are being brutally honest with ourselves, trading is not a game of certainty. It is a job based entirely on probabilities.
We don’t know what is going to happen next. We never do.
All we know is that if we have a setup with a >50% win rate and a 2:1 risk-to-reward ratio, the math will eventually pay us.
But here is the problem: Most retail traders (and I’ve been guilty of this too) are guessing at those probabilities. We think a setup looks good. We feel like the market is overextended.
That stops today.
I have spent the last few weeks integrating a platform called Edgeful into my daily workflow, and it has fundamentally changed how I approach the screen. I’ve gone so far as to build custom indicators to pipe this data directly into my charts because I realized that trading without it is like driving with a blindfold on.
Here is why this $50 tool is beating platforms that cost $1,000 a month.
The “Institutional” Gap
For years, there has been a massive wall between retail traders and institutions.
Retail Traders draw trendlines and guess.
Institutions (Goldman, Hedge Funds) have quant teams running millions of data points to tell them: “When X happens, Y happens 82% of the time.”
They aren’t guessing. They are executing a statistical edge.
Edgeful bridges that gap. It takes years of historical data—every tick, every session, every setup—and gives you the raw probabilities in real-time. It tells you exactly what the “House Odds” are for the trade you are about to take.
And the crazy part? It costs about as much as a round of commissions.
Real-World Proof: The “Monster” Trade
I don’t care about features; I care about P&L. So let me walk you through two specific trades from this week where this data was the difference between a small scalp and a massive runner.
Trade #1: The 20-Point “Certainty” Short
Today I was looking for a short setup underneath the 6957 level in S&P Futures (ES). Normally, I’d be watching price action, sweating the pullback, wondering if I’m right.
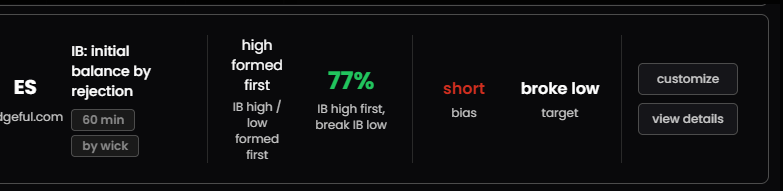
But I had the Edgeful dashboard open, and it gave me a specific stat for the Initial Balance (IB) strategy:
The Stat: Because the Initial Balance High formed first, there was a 77% historical probability that the Initial Balance Low would break.
I wasn’t hoping the low would break. I knew that historically, it breaks 77% of the time. That conviction allowed me to hold that short for a 20-point score.
Trade #2: The 30-Point “Monster”
This is the one that really matters. How many times have you entered a trade, seen 10 points of profit, and panicked out because you didn’t want to lose it?
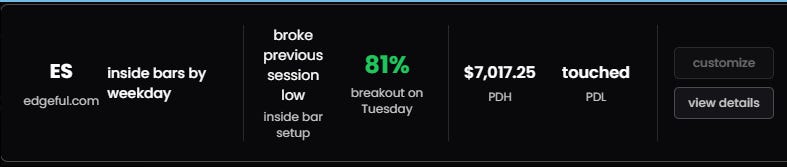
We opened inside the previous day’s range. The Edgeful dashboard flagged an “Inside Bar” stat:
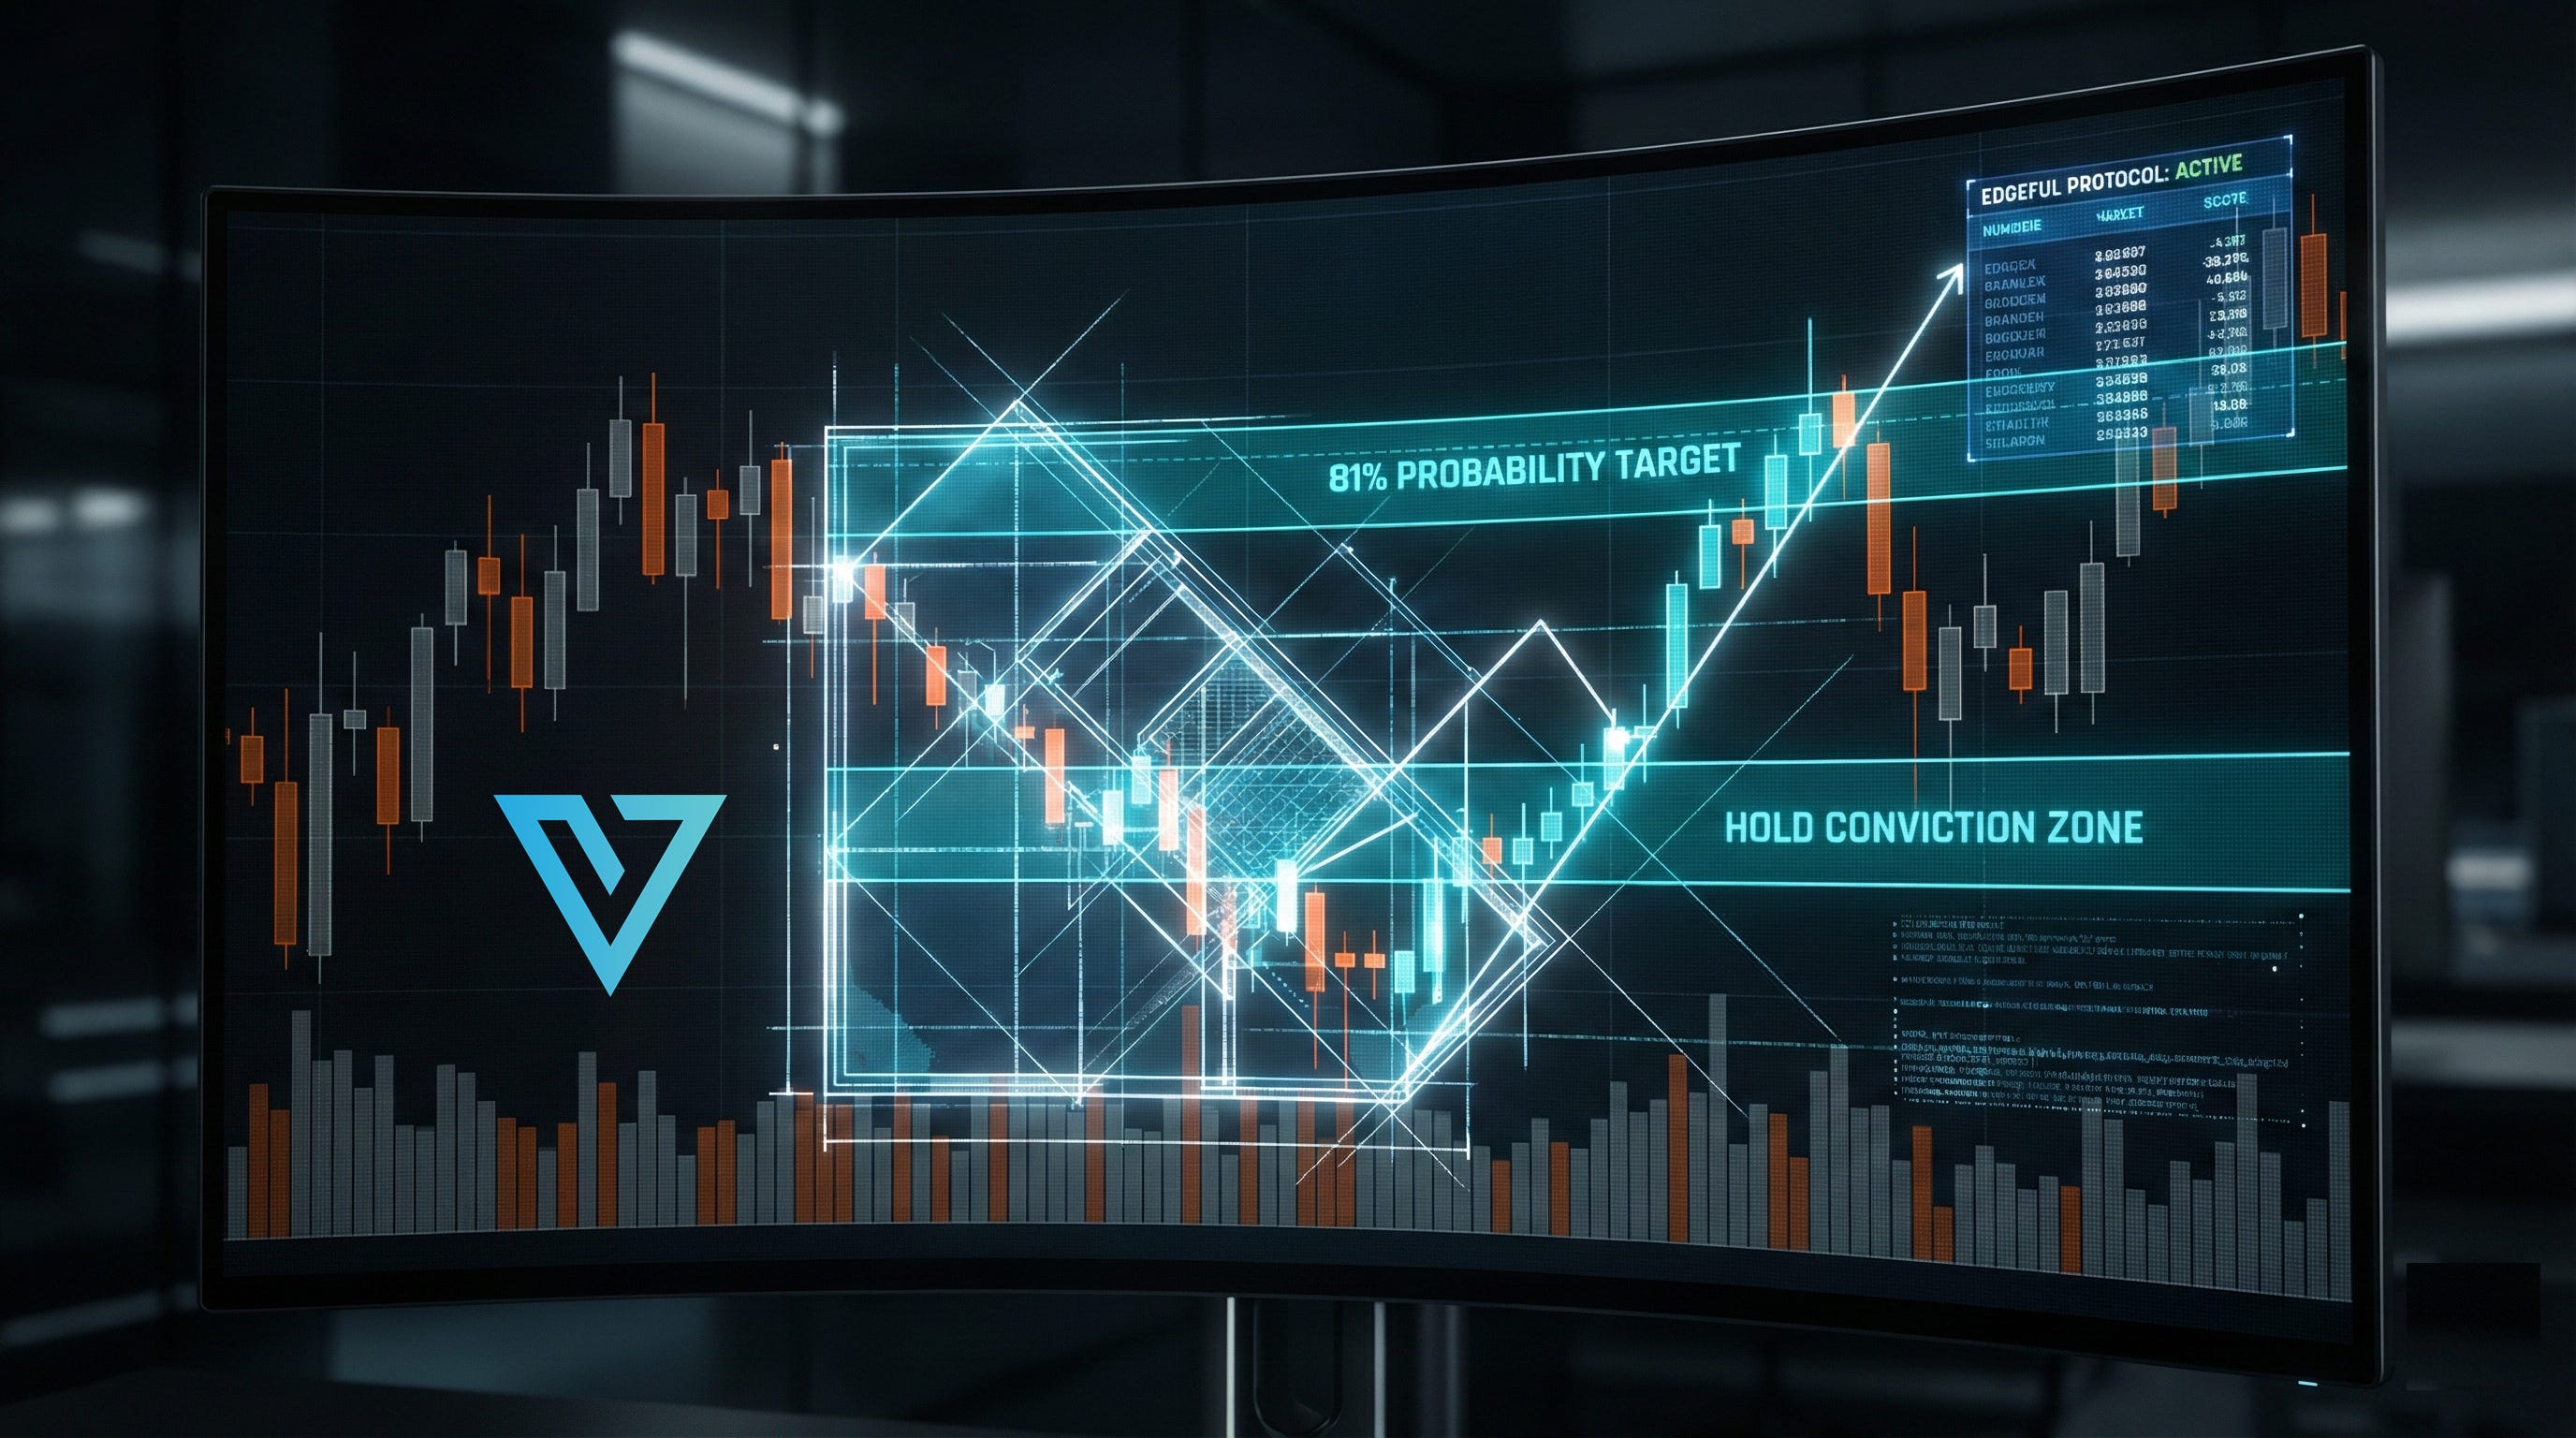
The Stat: When we open inside the previous day’s range (on this specific day of the week), there is an 81% chance we break the low.
This is the game-changer.
Normally, I might have pieced out of this trade early to lock in a “safe” win. But when I’m staring at a dashboard telling me there is an 81% probability of the low breaking, I’m not selling.
I held. The low broke. And that trade turned into a 30-point monster win.
The data forced me to be a better trader. It forced me to let the winner run.
Integration: Making It Essential
I believe in this so much that I’m not just looking at their website anymore. I have actually built custom indicators to load Edgeful data directly onto my trading screens.
Edgeful has a full suite of indicators on Trading view but I trade on Sierra Charts, so I built my own indicators have this data visualized on screen because it has become an indispensable part of my decision-making process.
When you can see the probability of a setup printed right on your chart, hesitation disappears.
The Verdict
This is institutional-grade stuff. There is no other way to say it.
If you are serious about this profession, you need to stop guessing. You need to stop trading off “vibes” and start trading off math.
If you want to know if a gap is likely to fill: Edgeful tells you (e.g., 63% fill rate).
If you want to know if the high or low will break: Edgeful tells you (e.g., 76% IB break rate).
It gives you the permission to be aggressive when the odds are in your favor, and the discipline to stay out when they aren’t.
This is a MUST have for members of the VICI community.
You don’t have to take my word for it. Go look at the stats for your favorite ticker. See if the “Initial Balance” stats would have saved you from a bad trade this week.
👇 Sign up for Edgeful Today 👇
>> CLICK HERE To get Edgeful <<
Want to see the deep dive?
I recorded a full video breakdown of how I use this platform. You can watch it here:
Let’s stop hoping and start knowing.
Ryan Bailey
VICI Trading Solutions
Why this video is relevant: This video from the Edgeful team provides a detailed breakdown of the Initial Balance strategy mentioned in the post, explaining the specific “retracement” and “breakout” statistics that Ryan used for his 20-point win.