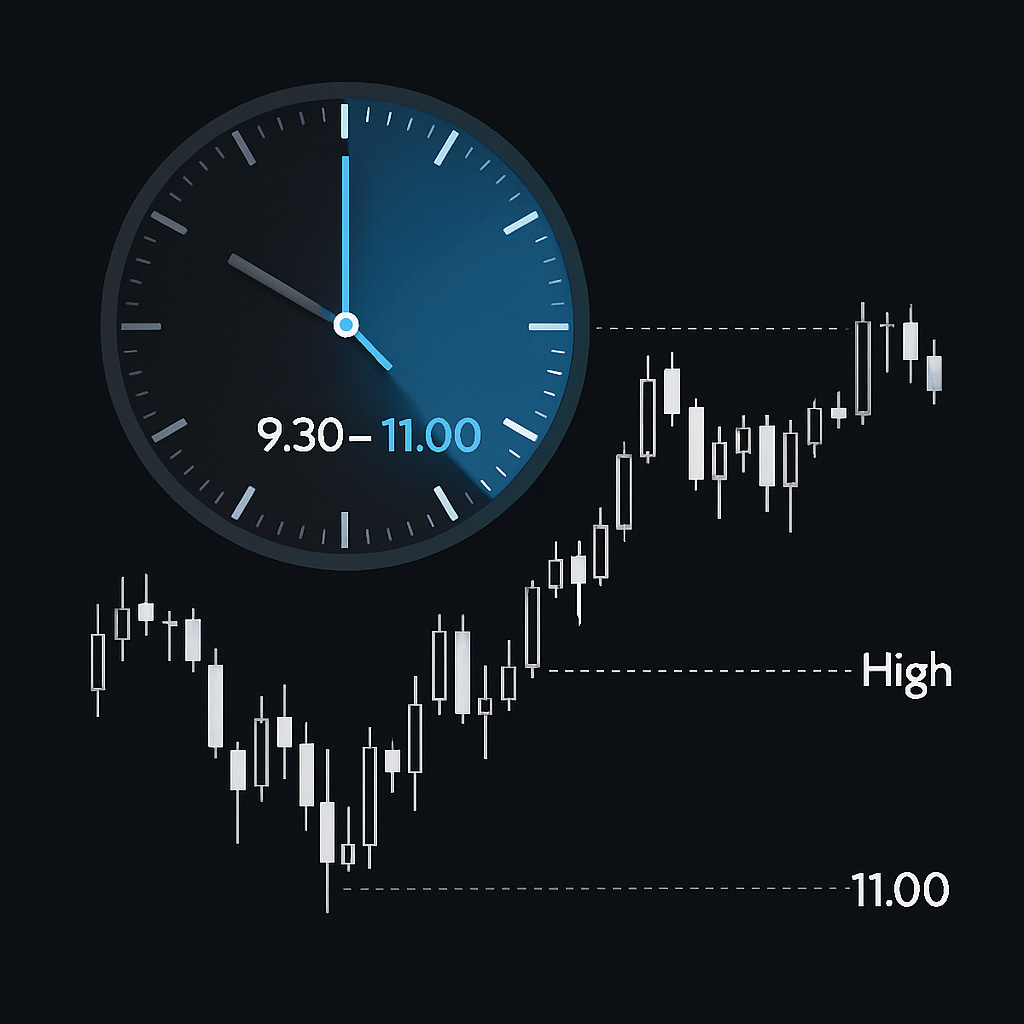
The Clock is Your Compass: Why the Day's High or Low is Often Set by 11 AM
A data-driven look at why the first 90 minutes of the S&P 500 session are so critical, and how I use this statistical edge to frame my intraday trading.
One of the biggest challenges traders face is context. After the chaotic open, the market can often feel directionless, leading to over-trading, chasing failed breakouts, or getting chopped up in the midday range.
But what if you had a data-backed framework to guide you? What if you understood the market's internal clock and knew that, more often than not, the most important work of the day is done before most people have finished their second cup of coffee?
This isn't a theory; it's a statistical reality that I use every single day to inform my trading decisions.
The 90-Minute Edge
Comprehensive studies and our own analysis of historical ES futures data reveal a powerful market tendency: on a stunning 75% of trading days, the high or the low for the entire S&P 500 cash session is established within the first 90 minutes of trading (by 11:00 AM ET).
Let that sink in. On 3 out of every 4 days, the absolute top or bottom for the session is in place by mid-morning.
This is not a crystal ball. It is a statistical probability. As traders, our entire business is built on finding and exploiting these kinds of high-probability patterns. This single piece of data can provide the context needed to navigate the rest of the trading day with far more clarity and confidence.
Why Does This Happen? The Logic of the Trading Day
This pattern isn't random; it's a direct reflection of how institutional capital and information flow through the market on a daily basis.
The Institutional Open: The first 60-90 minutes of the cash session is when large institutions execute their plans. This "opening drive" is characterized by high volume and significant price discovery, as major players position themselves for the day. This initial burst of activity is powerful enough to establish the session's extremes.
The News Cycle: The majority of market-moving economic data (CPI, Jobs Reports, PMIs, etc.) is released either pre-market or by 10:00 AM ET. The market’s most violent and decisive reaction to the day’s primary catalyst almost always occurs within this morning window.
The Midday Lull: After the opening fireworks, volume and participation tend to drop off significantly as the European session closes. This often leads to a lower-volatility, range-bound environment where the boundaries set in the morning are respected.
How I Turn This Statistic into Actionable Structure
Information is useless without application. Here is how I use this data to frame my day with clarity.
After 11:00 AM ET, the high and low established in that first 90-minute period become my most important reference points. It’s the 90-minute high and low—supported by the hard market structure from my own process—that I use as the primary map for the rest of the session.
It Serves as an Anti-Chasing Filter: This is the most crucial benefit. If ES rallies toward the morning's high in the afternoon on mediocre volume, this statistic provides the discipline not to chase a potential breakout. I know the odds are high that the move will fail. This alone saves me from countless low-probability trades.
It Builds Confidence in Fading the Extremes: Knowing that the high or low is likely already in gives me more confidence to look for signs of reversal at the edges of this initial 90-minute range. Instead of fearing a breakout, I can proactively look for absorption and signs of exhaustion to position for a mean-reversion trade back into the day's range.
It Helps Define My Boundaries: On a typical, non-trending day, the 90-minute high becomes my key resistance and the 90-minute low becomes my key support. This simplifies my view of the market and allows me to focus on executing at well-defined levels, rather than getting lost in the midday noise.
The primary exception, of course, is a Trend Day. On the 25% of days where the market is strongly directional, it will continue setting new highs or lows into the close. A key part of a trader's job is recognizing the signs of a true trend day. But on every other day, the 90-minute clock is an invaluable compass.
By understanding this rhythm, you can frame your day with a statistical tailwind, avoid common traps, and operate with the clarity of a seasoned professional.
Until next time—trade smart, stay prepared, and together we will conquer these markets!
Ryan Bailey,
VICI Trading Solutions


