
The 83% Signal: What the First 5 Days Predict for the S&P 500.
The "First Five Days" indicator just flashed a major buy signal for 2026. Here is the data, the edge, and why I’m listening to the math over the noise.

Hello everyone and Happy Monday.
They say nobody has a crystal ball in trading. But for the last 74 years, the First Five Days of January have been the next best thing.
While everyone else is obsessing over the latest Fed whisper, the “Greenland” headlines, or the daily volatility, a massive statistical signal just quietly triggered under the radar—and history says it predicts a double-digit green year.
We talk a lot about “Edge” here. This is one of the biggest statistical edges on the calendar.
Let’s dive into the data.
The “First Five Days” Indicator
This isn’t just an old trader’s tale; it comes straight from the Stock Trader’s Almanac.
The logic is simple but powerful: January is the “risk reset.” How institutions position themselves in the very first week of the year reveals their hand for the next 12 months. If they are buying aggressively out of the gate, it signals confidence in growth, valuations, and the macro picture.
Basically, if the big money is putting risk on in the first week, they are likely to keep it on.
The Historical Edge (The Receipts)
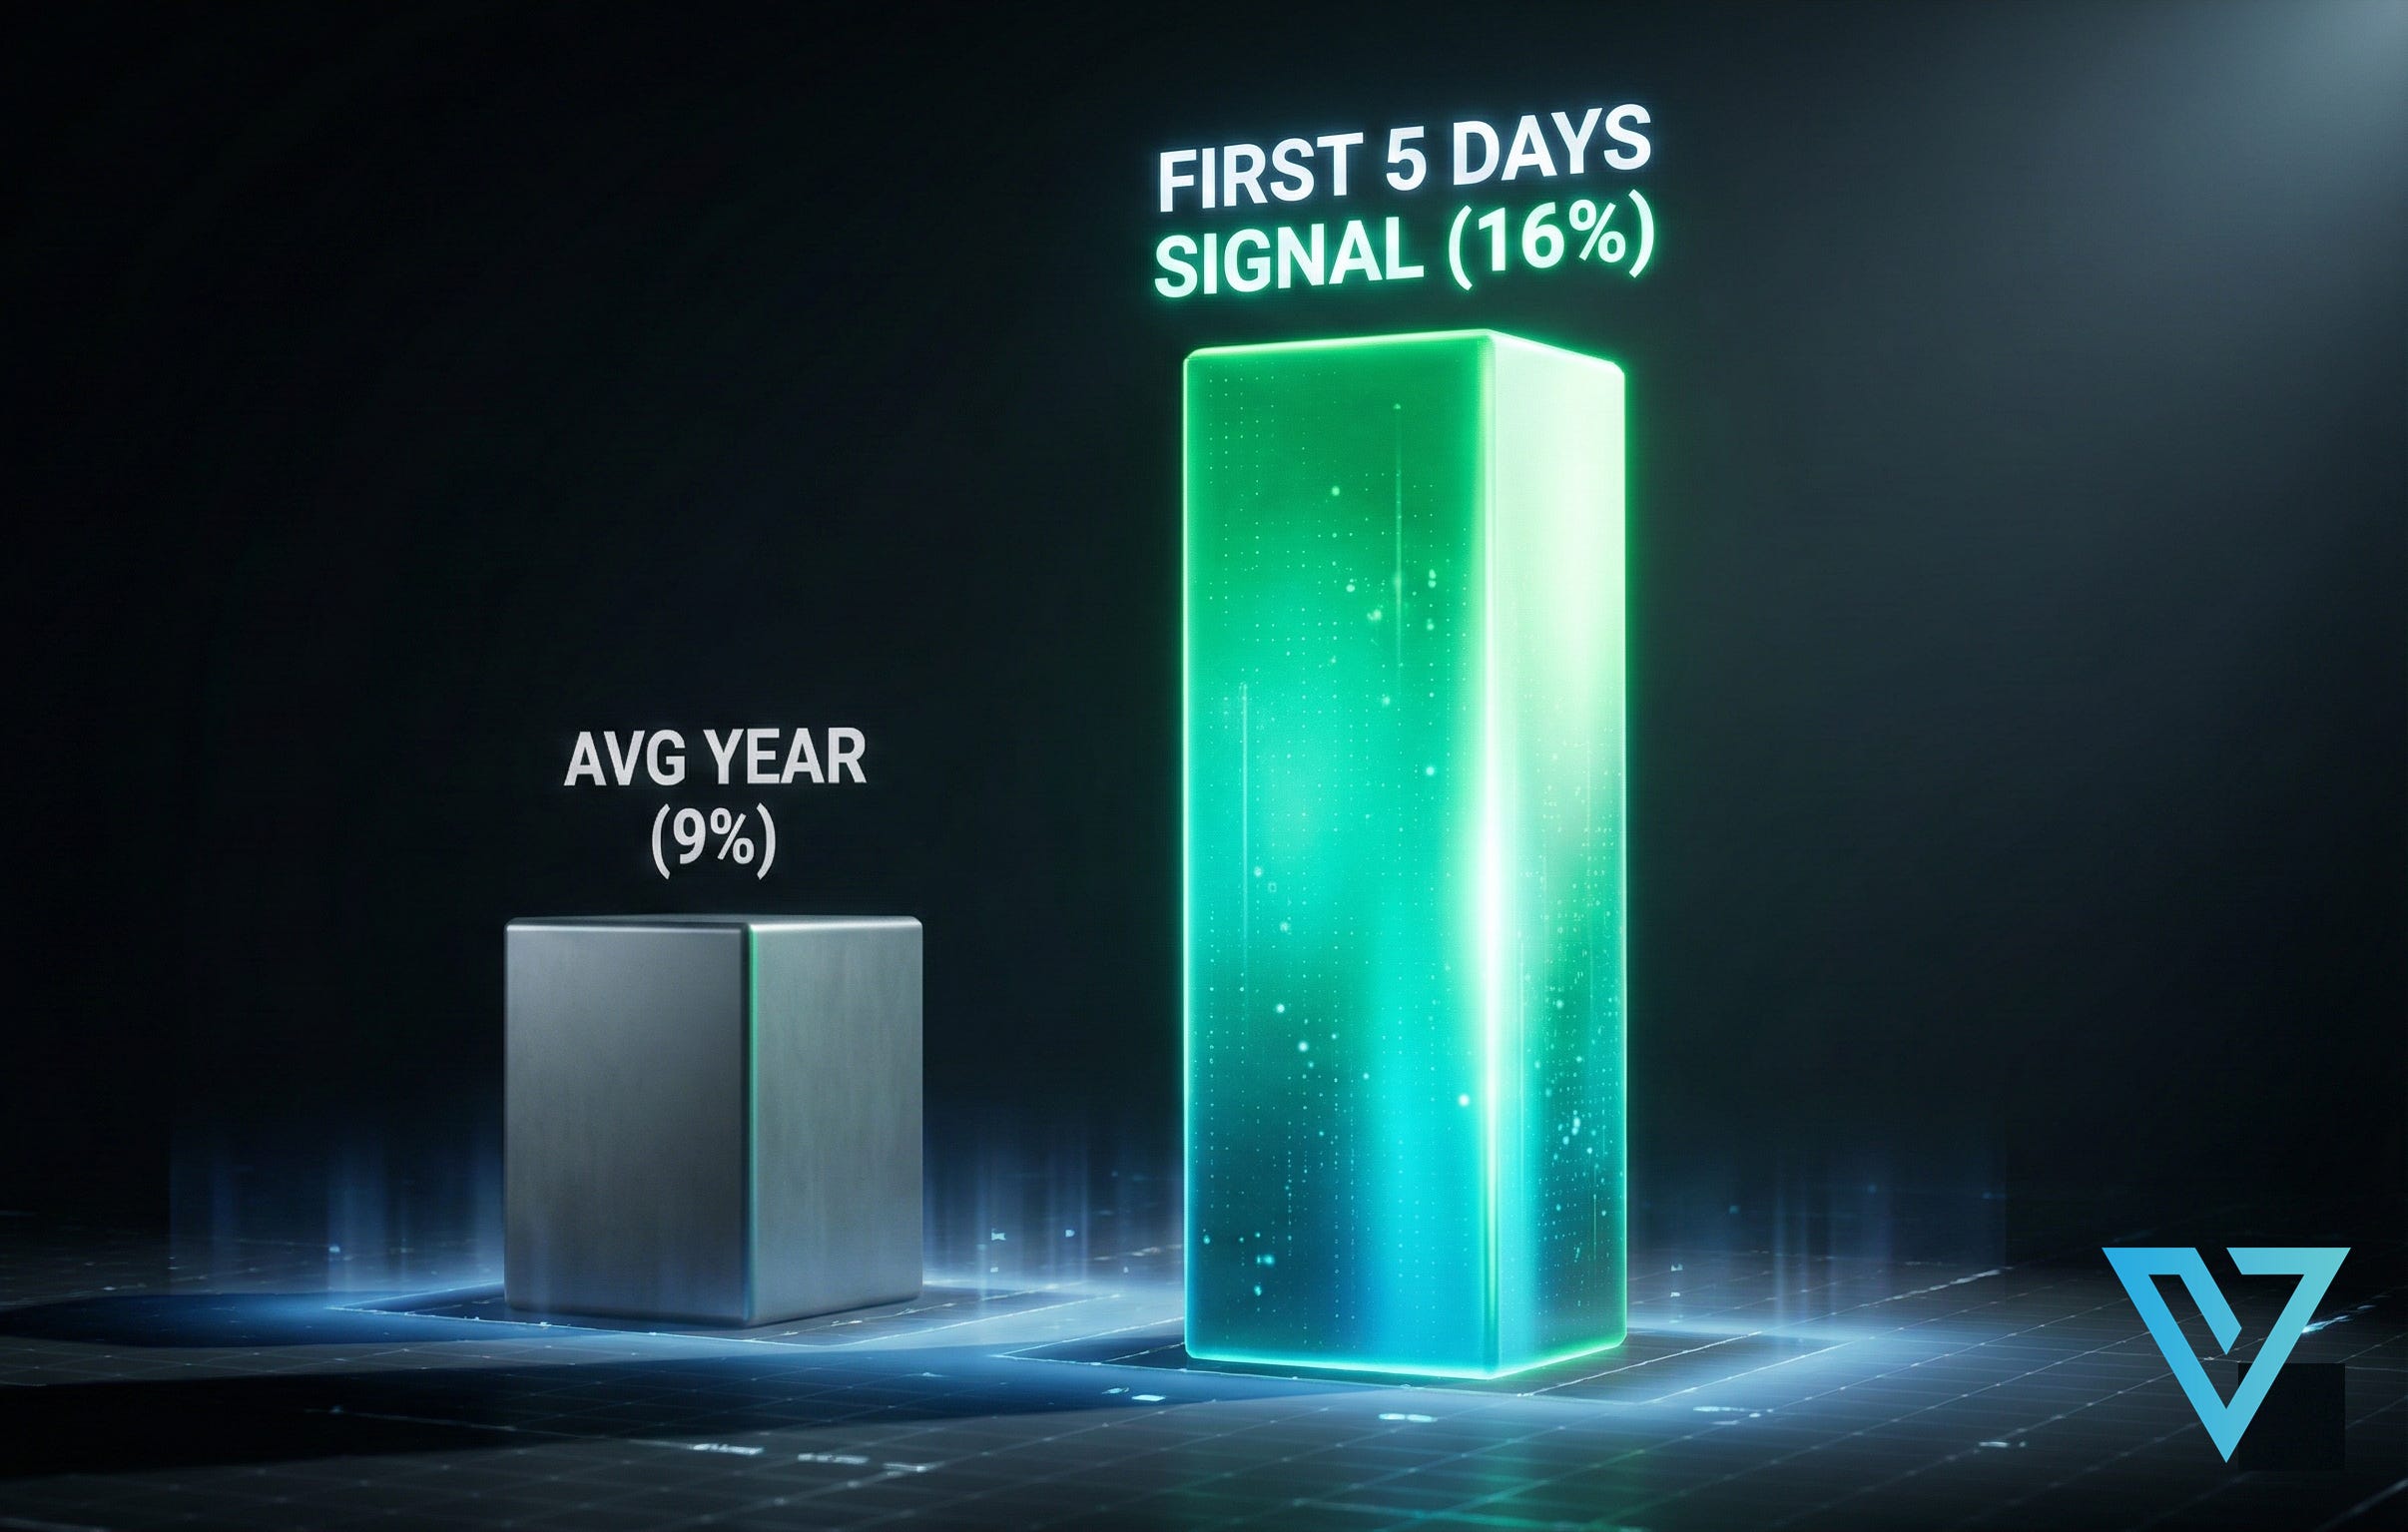
Let’s look at the hard numbers. Since 1950, when the S&P 500 posts a gain in the first five trading days of the year, the results are staggering.
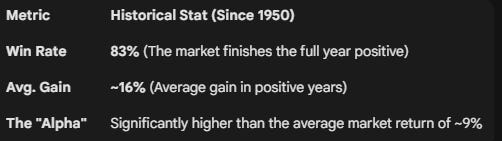
In a game where a 55% win rate makes you a legend, an 83% historical probability is something you pay attention to.
The 2026 Verdict
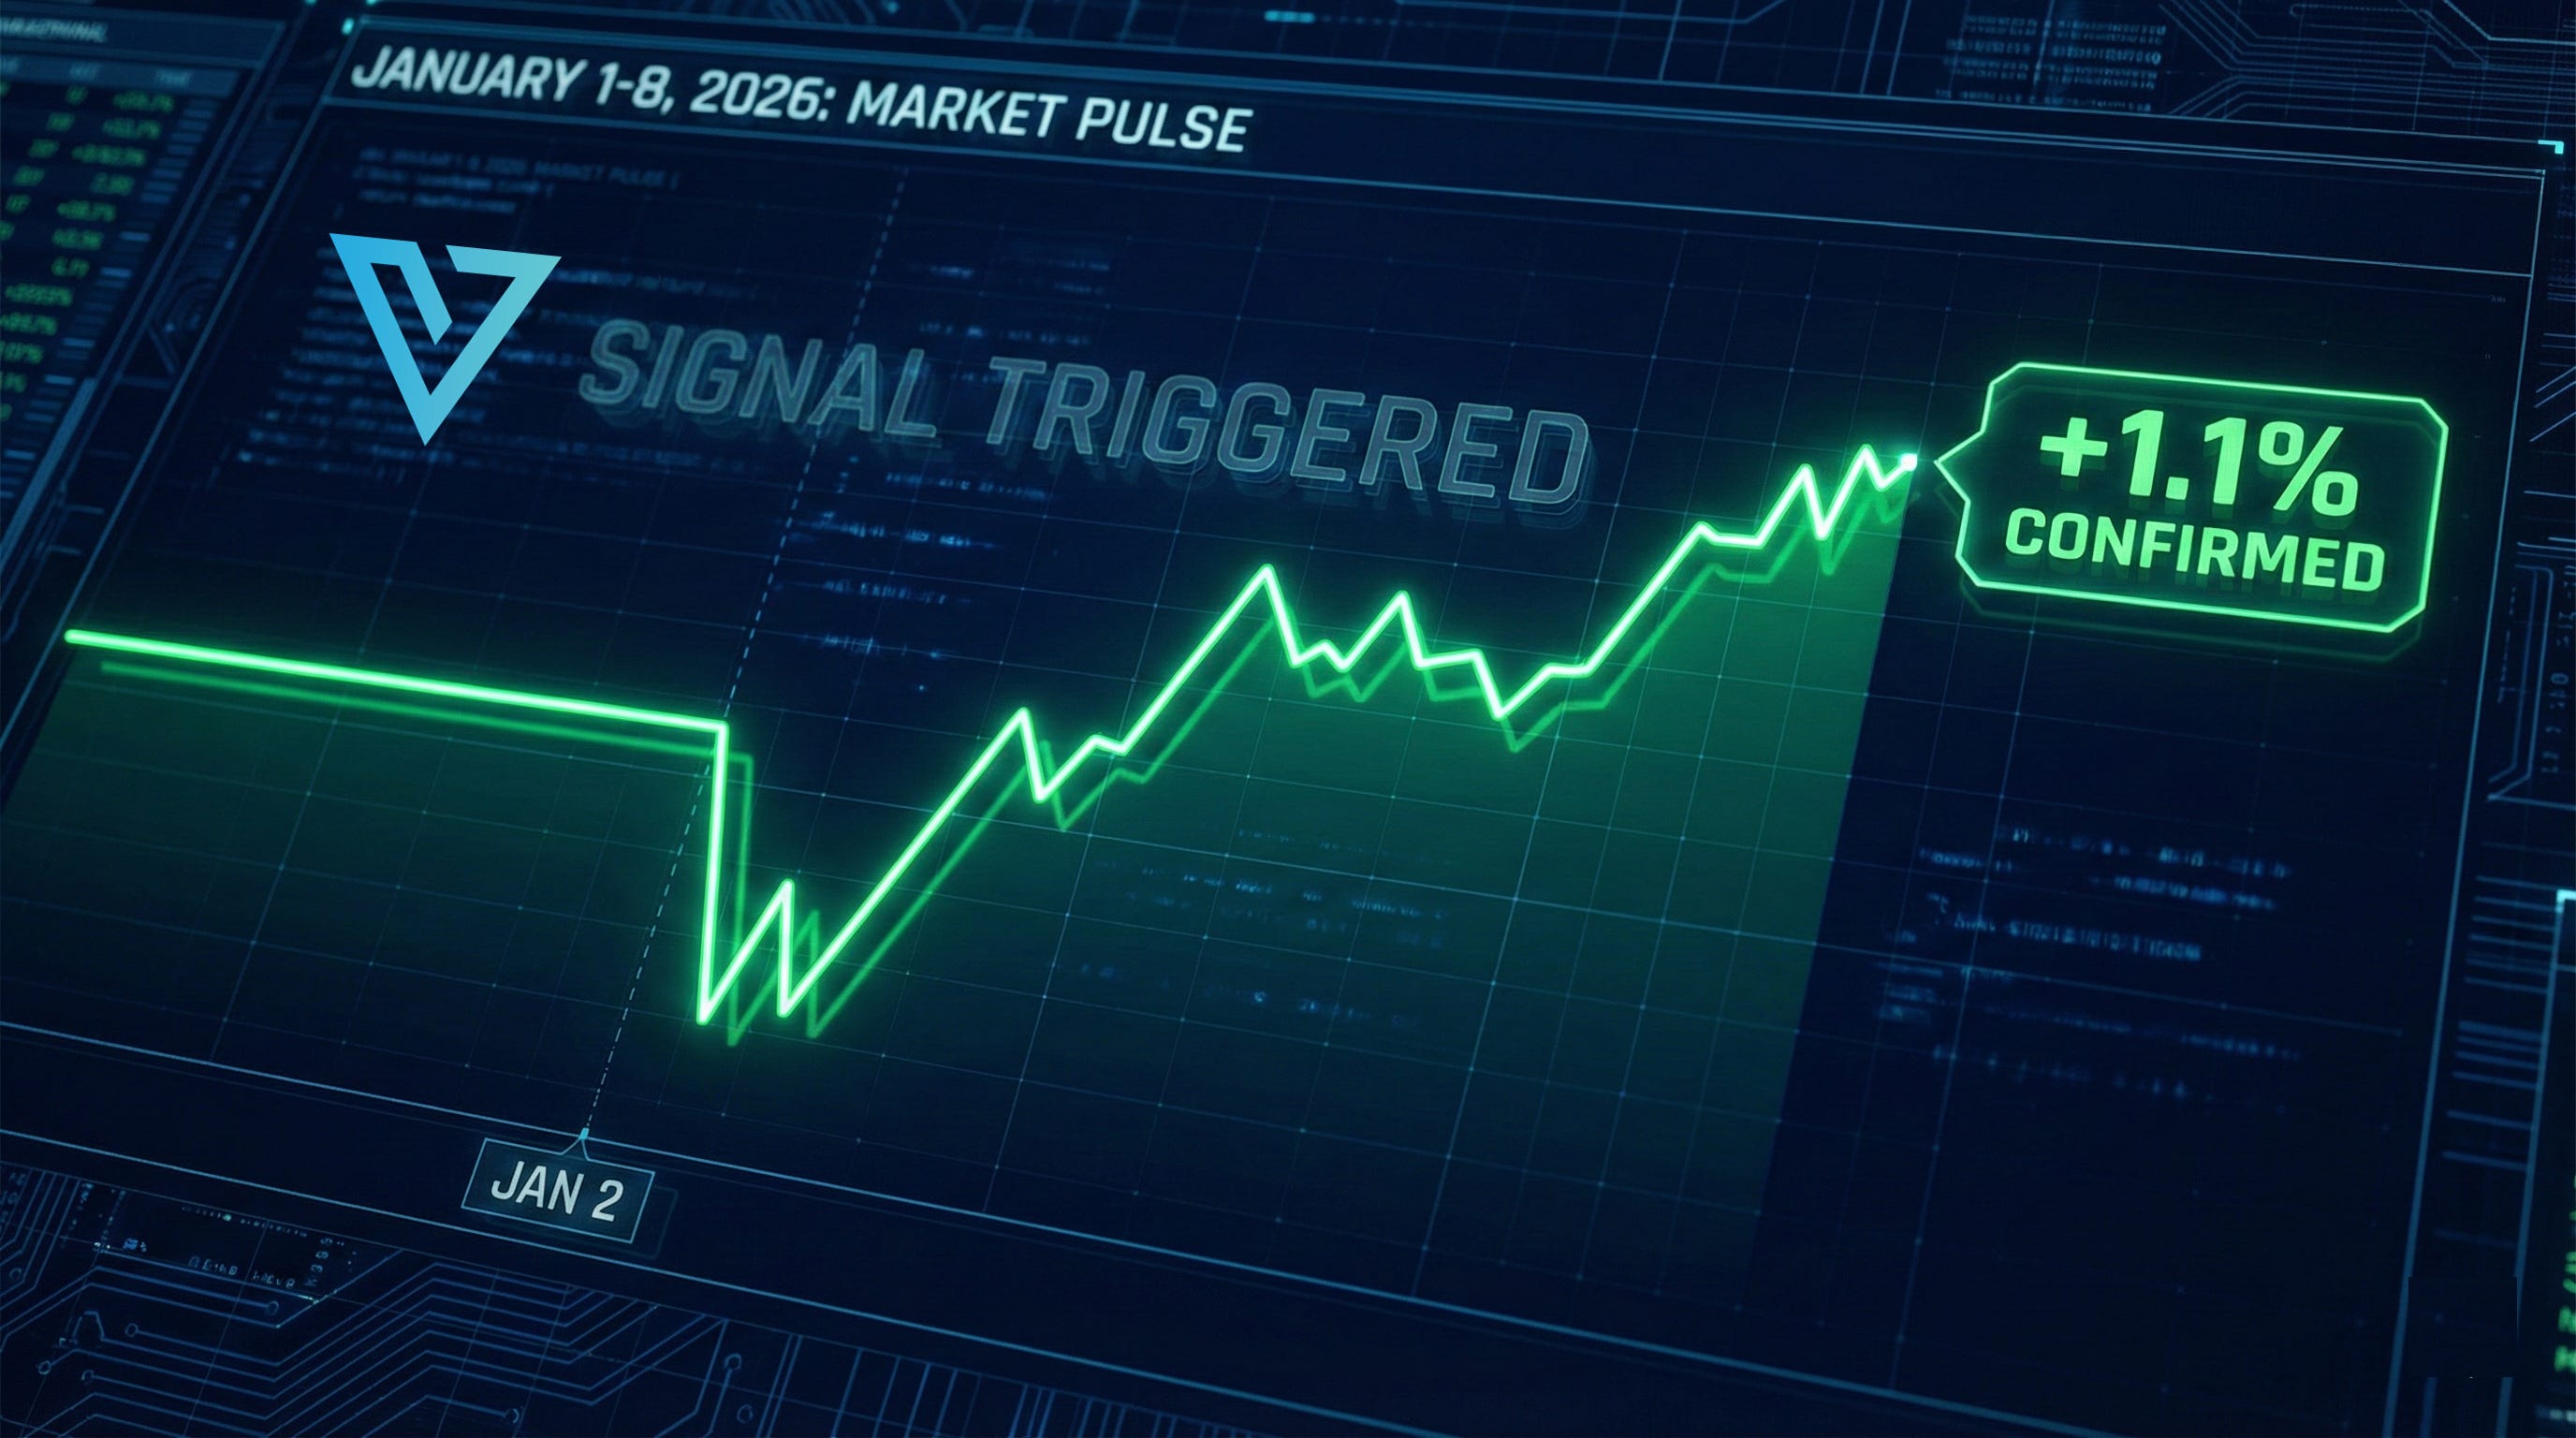
If you were watching closely earlier this month, it looked shaky. We saw a dip on Jan 2nd and mixed results by Jan 5th. But trading isn’t about how you start; it’s about the close.
The official data is in: The S&P 500 finished the first-five-day window of 2026 UP 1.1%.
This means the signal has officially triggered.
The “January Trifecta” Context
To make this even stronger, this indicator is actually part of a three-part signal known as the “January Trifecta.”
Santa Claus Rally: (Last 5 days of Dec + first 2 of Jan) - Missed slightly this year (-0.53%).
First Five Days: (What we just discussed) - HIT (+1.1%).
The January Barometer: (The entire month of January) - Still unfolding.
While we missed the Santa Claus rally, hitting the “First Five Days” is a massive bullish confirmation. In years where we missed Santa but hit the First Five Days and the January Barometer, the market has still historically delivered solid gains.
The Bottom Line
The signal has officially flashed green.
This doesn’t mean stocks go up in a straight line—we will still have volatility and pullbacks (like the dip we saw on Jan 20th). But statistically, the wind is now at our backs. The “smart money” has voted with their wallets, and they are betting on a green 2026.
Past performance doesn’t guarantee future results, but in a game of probabilities, I’ll take an 83% historical edge every single time. The data says the path of least resistance is higher—trade accordingly.
Until next time—trade smart, stay prepared, and together we will conquer these markets!
Ryan Bailey
VICI Trading Solutions