
The 306% Warning: Why U.S. Money Supply Data Just Flashed the Most Dangerous Signal Since the Dot-Com Bubble
The 306% Warning: Why U.S. Money Supply Data Just Flashed the Most Dangerous Signal Since the Dot-Com Bubble

Hello Team,
I’ve got a good one today and ONE number says it ALL: 306%.
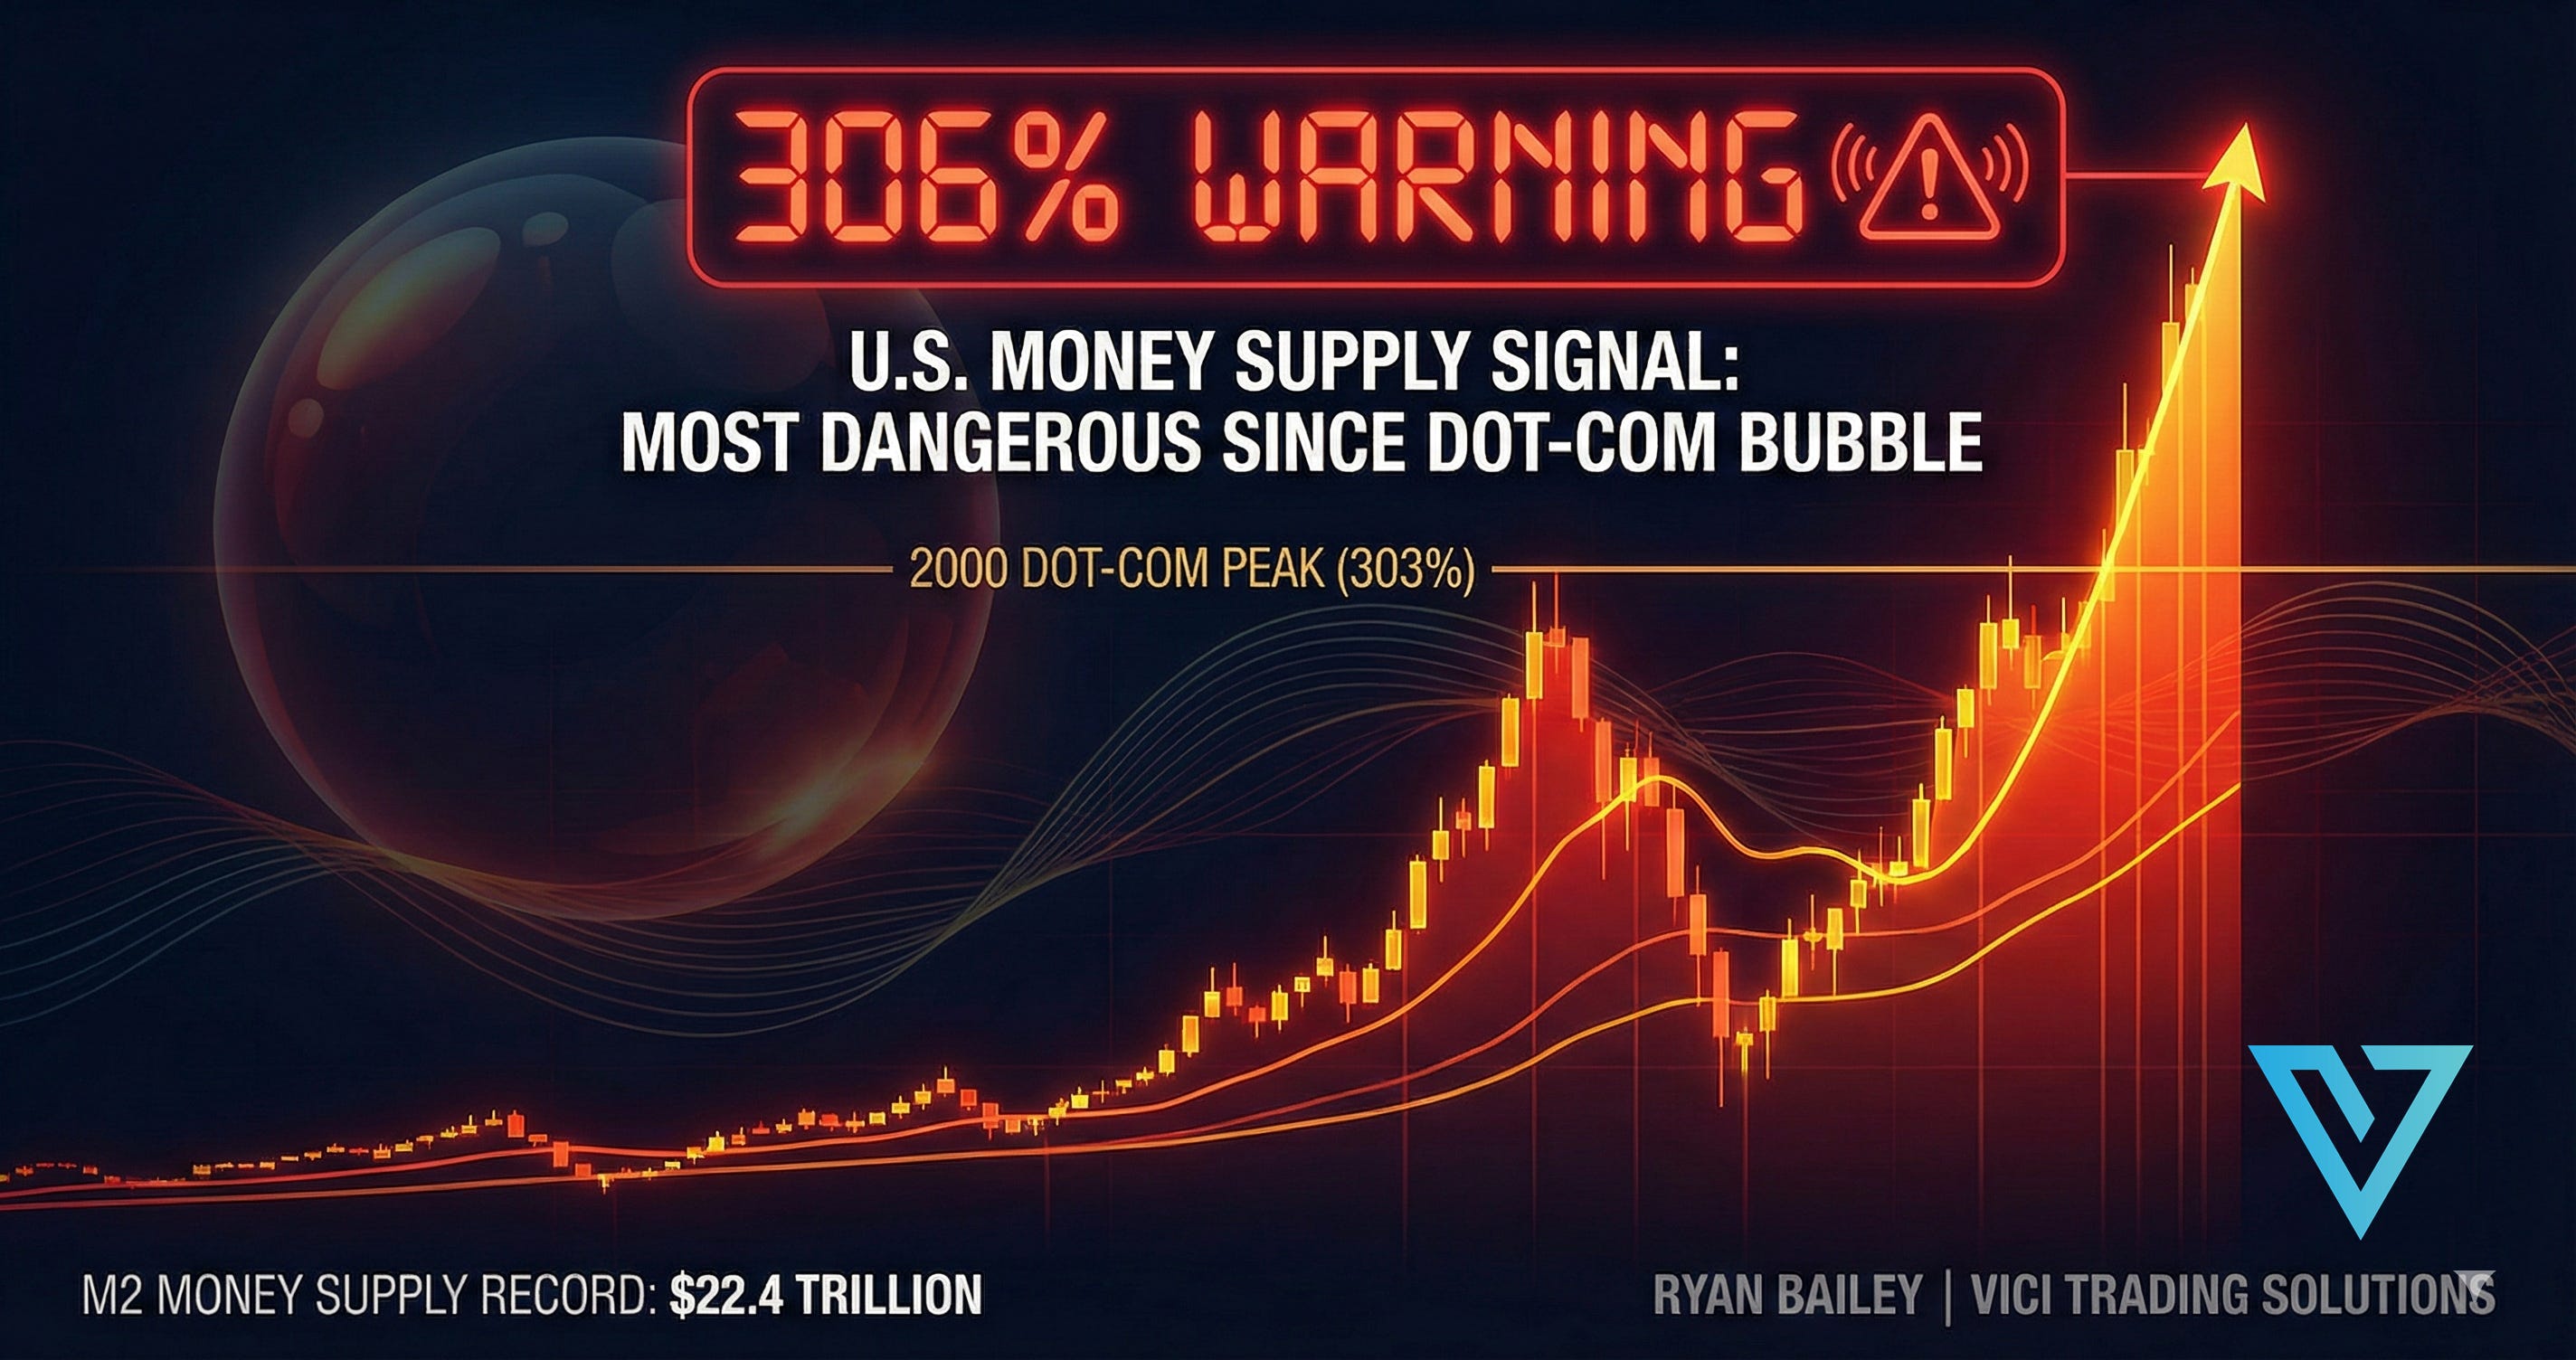
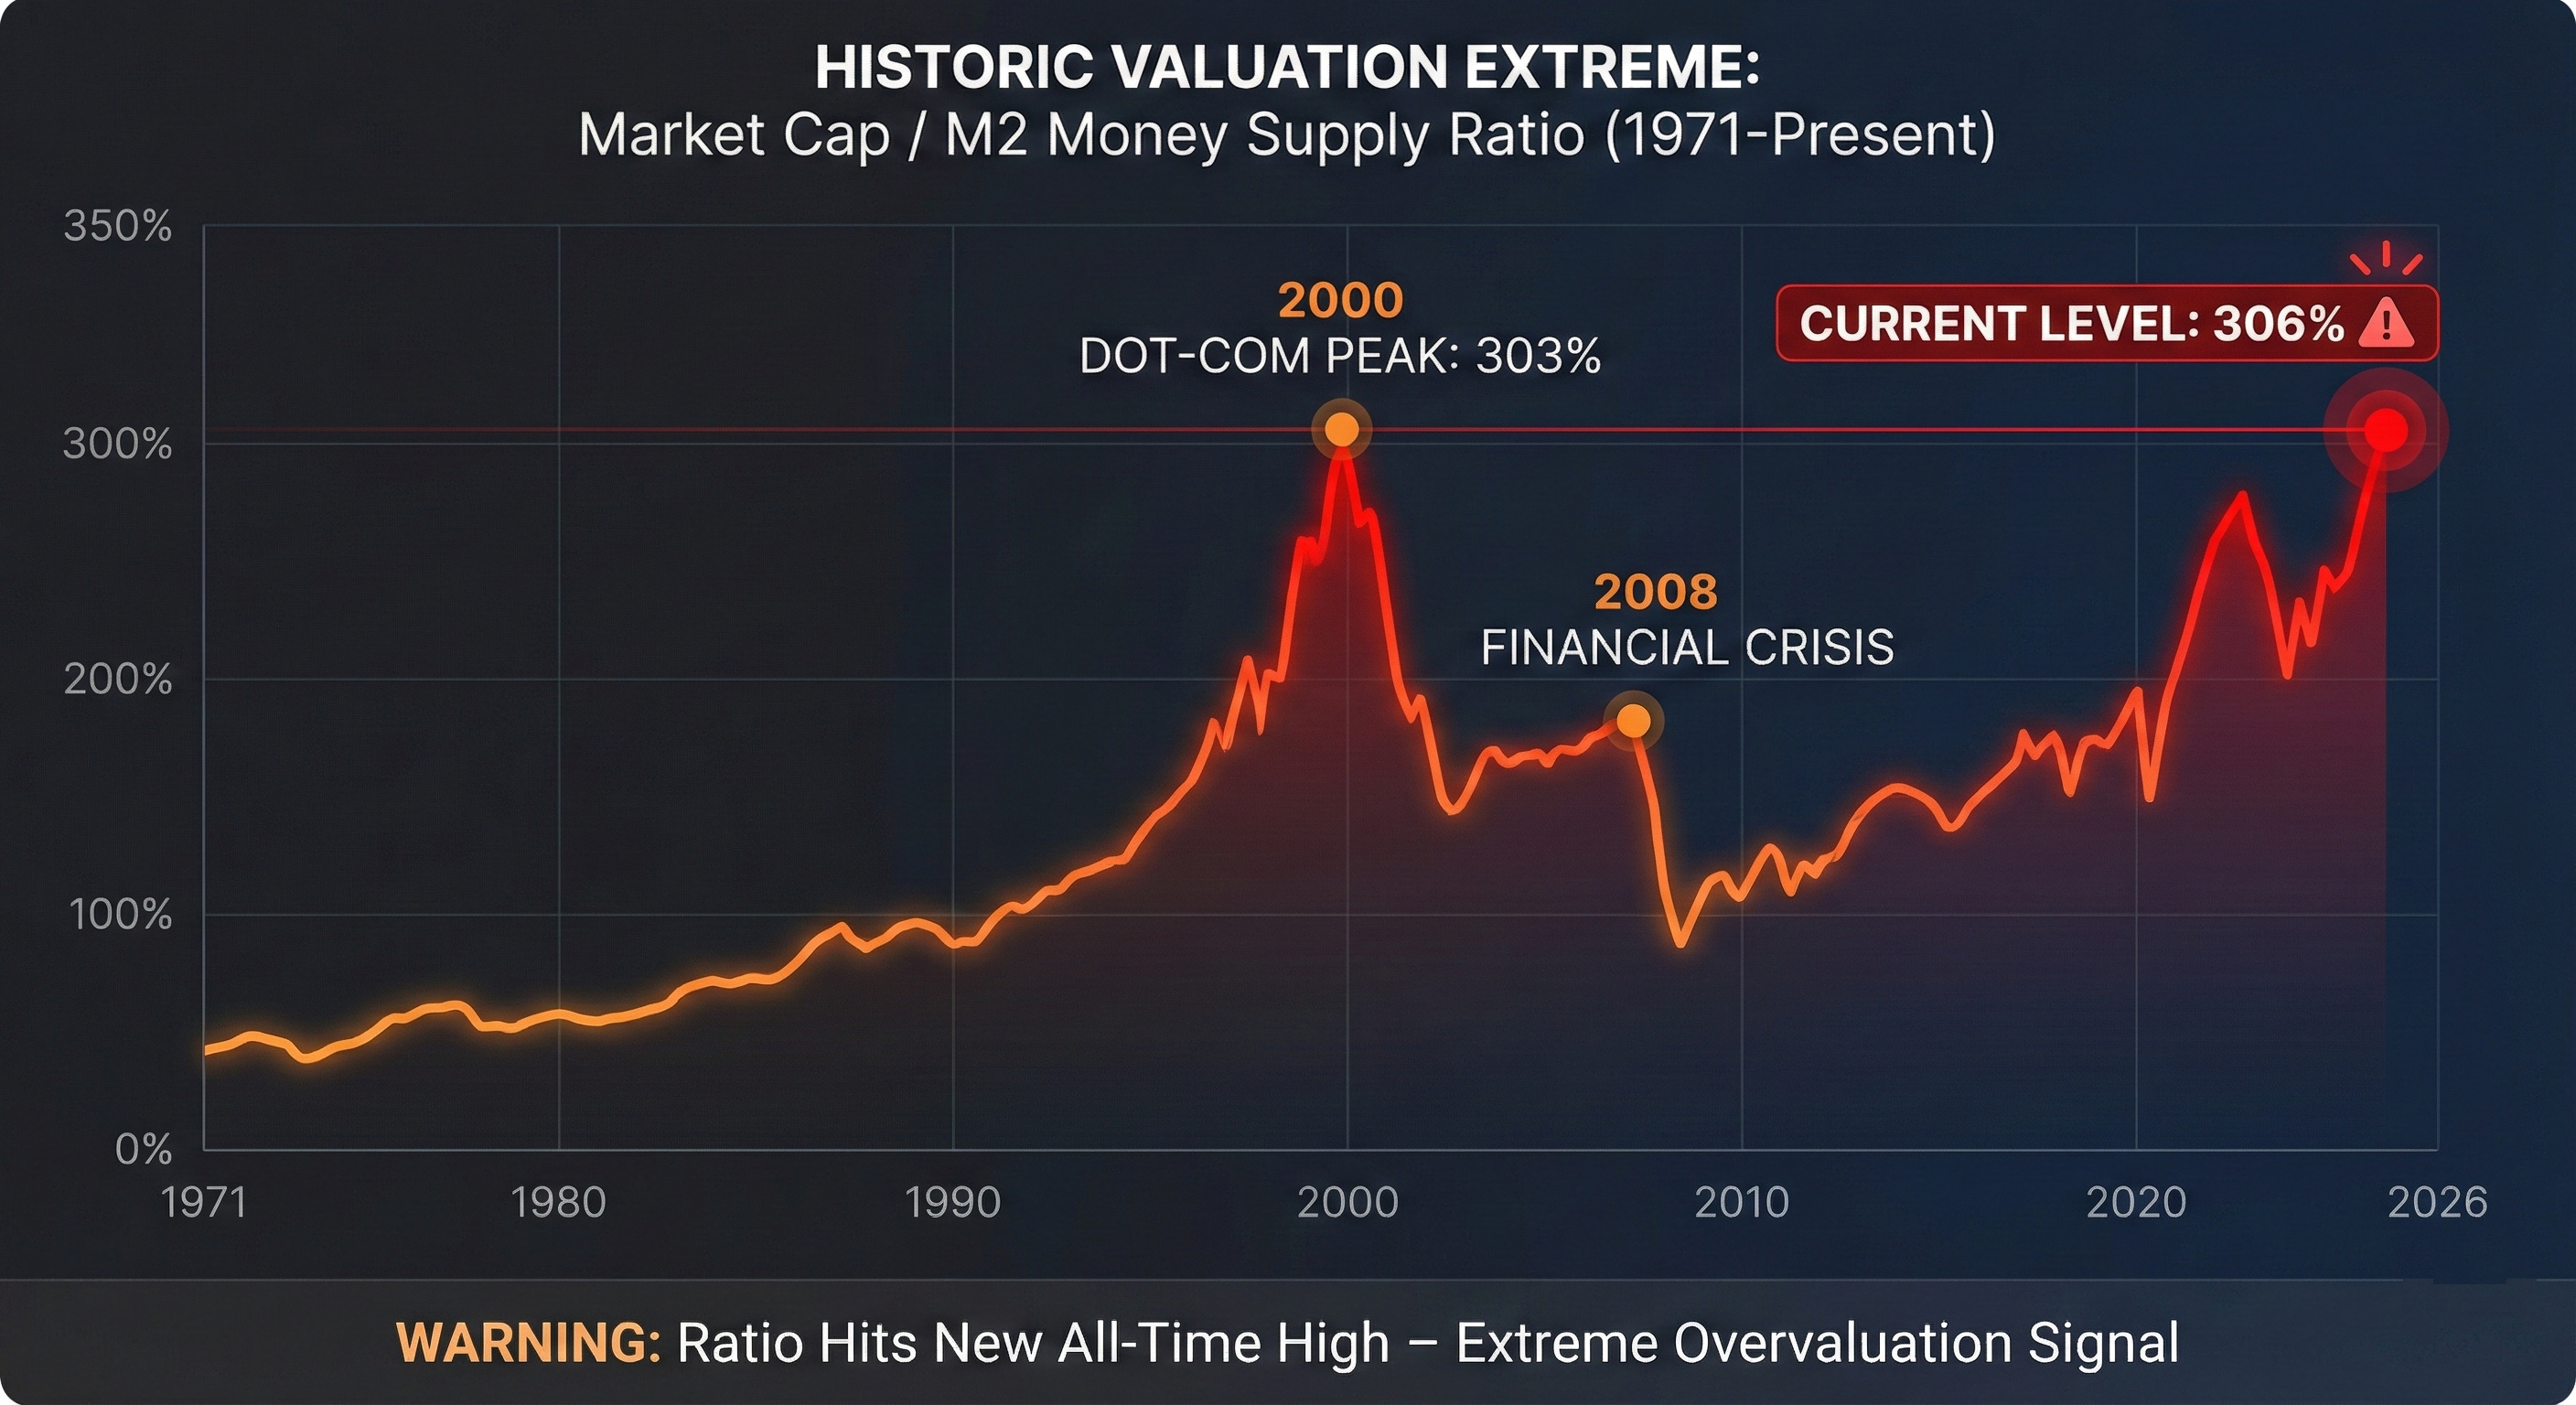
That is the current ratio of total U.S. stock market capitalization to M2 money supply. It just made history—surpassing the 303% reading we saw right before the dot-com bubble burst in 2000.
📊 Translation: This is the most expensive stock market in recorded history by this measure.
The M2 Money Supply Paradox:
Here is what is happening. M2 money supply—which includes cash, checking accounts, savings accounts, and CDs under $100,000—just hit an all-time high of $22.411 trillion in December 2025, according to the Federal Reserve.
On the surface, that sounds bullish. A growing economy needs more capital in circulation. M2 has been climbing steadily since bouncing off its Great Depression-era decline from April 2022 to October 2023.
But here is the kicker: The stock market has been growing faster than the money supply….. Much faster !!
The Numbers Tell the Story
Let us look at the data from the Federal Reserve and market analysts...
M2 Money Supply:
• January 2020: $15.4 trillion
• January 2022: $21.8 trillion (pandemic stimulus peak)
• October 2023: $20.8 trillion (trough—largest decline since Great Depression)
• December 2025: $22.411 trillion (new all-time high)
That is a 45% increase in M2 since 2020. Impressive.
But here is what happened to the stock market:
Total U.S. Market Cap:
• January 2020: ~$34 trillion
• January 2022: ~$53 trillion
• December 2025: ~$68+ trillion
The stock market nearly doubled while money supply grew 45%. That is the bifurcation that has this ratio screaming warning signals.
Why 306% Matters...
Historically, the market cap-to-M2 ratio has fluctuated between 100% and 200%. The long-term average sits around 150%.
Here is the pattern, back-tested to 1971:
• Below 100%: Stocks are cheap relative to money supply. Strong buying opportunity.
• 100-150%: Fair value range. Normal market conditions.
• 150-200%: Getting expensive. Proceed with caution.
• Above 200%: Historically preceded significant corrections.
We are at 306%. That is double the historical average and higher than any point in market history—including the peak of the dot-com mania.
What Happened Last Time?
Every time the market cap-to-M2 ratio surpassed 200% during a bull market since the late 1990s, we saw major corrections:
2000 (Dot-com peak at 303%):
• Nasdaq dropped 78% peak-to-trough
• S&P 500 fell 49%
• Recovery took years
2007 (Pre-financial crisis):
• S&P 500 dropped 57%
• Housing market collapsed
• Global financial system nearly imploded
2021 (Post-stimulus peak):
• Nasdaq fell 33% in 2022
• S&P 500 dropped 25%
• Bear market lasted most of the year
The pattern is consistent: Extreme readings lead to mean reversion. The question is not if—it is when.
What This Means for Traders
Let me be clear: This does not mean the market crashes tomorrow. Expensive markets can get more expensive. But the risk/reward has shifted.
Here is how I am thinking about it:
✅ Short-term (this week): The market does not care about M2 ratios day-to-day. Trade your levels. Focus on price action.
✅ Medium-term (Q1 2026): Be aware of elevated risk. Size positions accordingly. This is not the environment for max leverage.
✅ Macro context: When the rubber band is stretched this far, the snapback can be violent. Have a plan for downside scenarios.
The market can stay irrational longer than you can stay solvent—but it cannot stay irrational forever.
The Bottom Line...
The M2 money supply just hit a record high. That sounds bullish until you realize the stock market grew twice as fast. The resulting 306% ratio is the highest ever recorded—higher than the dot-com bubble.
History shows what happens when this metric gets extreme. It does not predict timing, but it does predict magnitude. When the correction comes, it tends to be significant.
Trade the levels. Manage your risk. And remember: The best traders are not the ones who call the top—they are the ones who survive it.
Until next time—trade smart, stay prepared, and together we will conquer these markets.
Ryan Bailey
VICI Trading Solutions