
The 13th Time Since 1994: What History Says Comes Next After This Historic SPX Rally
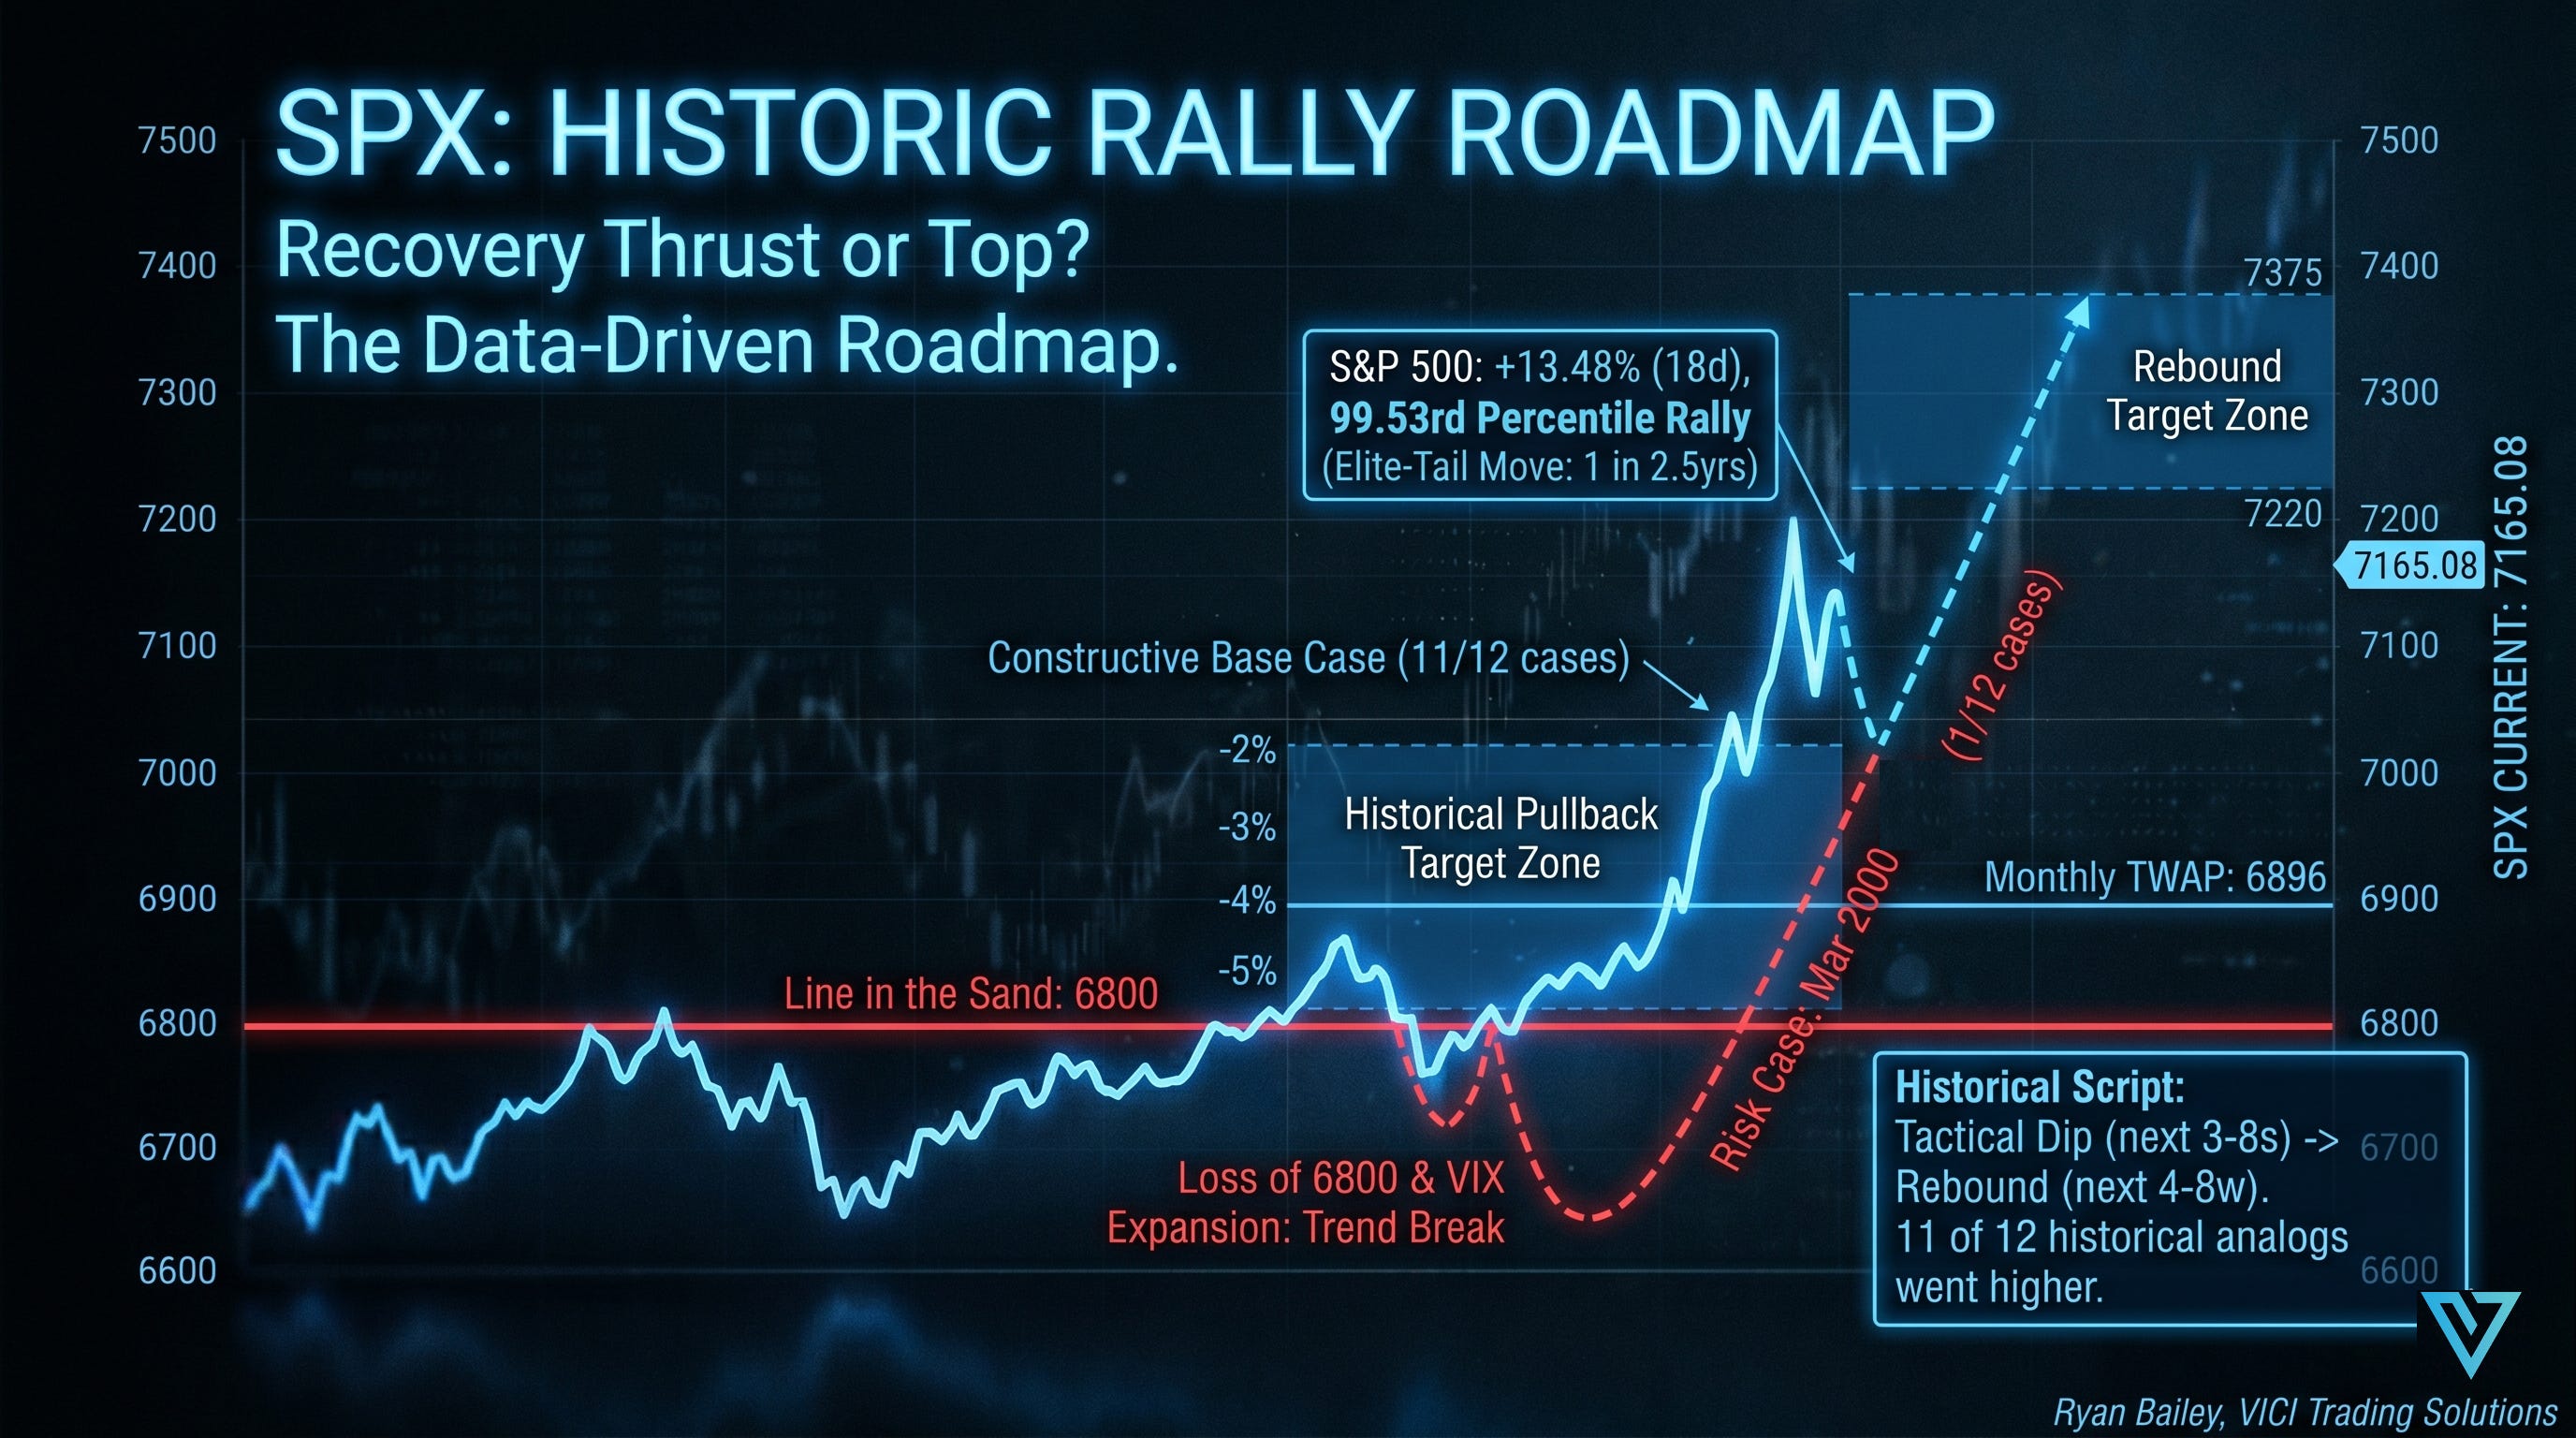
An 18-day, +12.95% surge ranks in the 99.5th percentile. History points to a -2% to -4% pullback, then a rebound toward 7220-7375.

Three weeks ago, the S&P 500 ($SPX) closed at 6343.72.
Yesterday, it closed at 7165.08.
That’s +12.95% close-to-close in 18 trading sessions — and +13.48% measured from the March 30 intraday low to Friday’s high. Eight hundred and twenty-one points of pure thrust. If you’ve been trading this move, you already know what your inbox and Twitter feed look like right now: half the market is screaming “the top is in,” the other half is screaming “buy every dip into eternity.”
Here’s the deal — neither side has done the math.
So I did.

The Thesis: This Is One of the Rarest Rallies of the Modern Era. And History says it’s Almost Never the Top.
That’s the punchline. Now let me show you the work.
Just How Rare Is This Move?
Out of 8,114 rolling 18-session windows in the SPX since 1994, this one ranks #39. That puts it in the 99.53rd percentile — the top half of the top 1%.
When you strip out the overlapping windows and only count distinct, clustered rallies, the current move is the 13th of its kind in 32 years.
Think about that. In three decades of Fed cycles, dot-com bubbles, financial crises, COVID shocks, and everything in between, a thrust this size has happened roughly once every two and a half years. This isn’t normal market behavior. It’s elite-tail behavior.
And elite-tail moves don’t behave like normal moves.
When This Has Happened Before
Here are the 8 closest historical analogs — rallies of roughly the same magnitude (+10.95% to +14.95% in 18 sessions) since 1994:
Feb 28 → Mar 23, 2000: +13.30%
Apr 4 → May 1, 2001: +14.79%
Sep 21 → Oct 17, 2001: +11.52%
Jul 10 → Aug 5, 2009: +14.06%
Dec 24, 2018 → Jan 22, 2019: +11.99%
May 13 → Jun 9, 2020: +13.73%
Oct 30 → Nov 25, 2020: +11.00%
Apr 21 → May 15, 2025: +14.71%
Look at that list. Every single one happened in a fundamentally interesting moment — the dot-com squeeze top, the post-9/11 recovery, the off-the-bear-market-low rip in 2009, the Christmas Eve 2018 V-bottom, two distinct 2020 COVID-era thrusts, and last year’s spring melt-up.
If we widen the criteria to “any rally at least as large as this one,” there have been 12 prior instances since 1994 — making the current rally #13 in the modern dataset.
The lesson from this list: violent upward thrusts of this magnitude tend to occur after something — a panic low, a policy pivot, a crisis resolution. They’re recovery moves, not blow-off tops. That distinction matters for what comes next.
The Pullback Playbook
Here’s where the data gets tradable. For rallies of this magnitude, history shows a clear pattern over the next 5, 10, 20, and 40 trading days:
Next 5d median return: -0.07%
Next 10d median return: -0.98%
Next 20d median return: +0.11%
Next 40d median return: +3.84% (with a 75% win rate)
That looks flat-to-modestly-positive on the surface. But the path is what matters. Inside that 20-day window:
75% of cases saw a -2% pullback within 40 trading days, with the median pullback occurring around day 5-6.
37.5% of cases saw a -3% pullback.
37.5% of cases saw a -5% pullback.
In plain English: after a thrust this large, a tactical pullback in the 2% to 4% range is the base case, and it usually shows up within the next 1-2 weeks. Not because the bull trend is broken — because the rally is statistically stretched and momentum needs to reset before the next leg.
From the current SPX 7165 close, here’s what those pullback levels look like in real numbers:
-2% = 7022
-3% = 6950
-4% = 6878
-5% = 6807
-6% = 6735
And here’s the level worth circling on your chart: the monthly TWAP sits at roughly 6896. That’s almost exactly the -3.75% pullback zone. If this rally rolls over tactically, the 6875-6900 area is the cleanest historical and momentum reset target.
The Rebound Roadmap
This is the part most traders miss. They get the pullback call right, then panic-sell the bottom because they didn’t pre-plan the second leg.
Among the 8 closest analogs, 6 of 8 saw at least a -2% pullback within the first 20 trading days. And of those six pullbacks, all six rebounded at least +5% from the pullback low within 40 trading days. Six for six. Zero misses. The median time to hit that +5% rebound was just 4 trading days from the pullback low.
The full rebound profile from the pullback low:
+6.07% median max rebound within 5 days
+6.32% within 10 days
+8.51% within 20 days
+10.56% within 40 days
Now, “from the pullback low” requires hindsight — you don’t know the bottom in real time. So the more practical measurement is from the first -2% touch. Using that method:
+4.32% median max rebound within 5 days
+4.88% within 10 days
+6.19% within 20 days
+10.34% within 40 days
A +5% rebound was hit in 83.3% of cases (5 of 6).
The one analog that broke the pattern was the March 2000 dot-com top — it bounced, but not cleanly enough before deeper weakness took over. The two analogs that never even produced a -2% pullback (early 2019 and November 2020) simply kept grinding higher with no shakeout at all.
So the historical script reads: massive thrust → tactical pullback → reboundable buy unless risk-off expands. The rebound, more often than not, lands in the +4% to +6% range, with the strongest analogs stretching to +8% to +10%.
Putting the Map Together
Here’s the actionable level map. If SPX pulls back to one of these zones, here’s the historical +5% rebound target from each:
7022 (-2%) → +5% rebound = 7373
6950 (-3%) → +5% rebound = 7298
6878 (-4%) → +5% rebound = 7222
6807 (-5%) → +5% rebound = 7147
The best working map based on this dataset: a pullback into 6950-6880, followed by a rebound target of 7220-7300. If the pullback is shallower than that and the trend reasserts strongly, 7350-7440 becomes realistic.
That’s the historical script. That’s where the data points.
What Could Break the Script
History is a guide, not a guarantee, and one analog in this dataset matters more than the rest: the March 2000 dot-com squeeze. It looked exactly like the others on the way up. It fell apart on the way back. The difference was structural — the underlying trend was already broken; the rally was a final exhaustion thrust, not a recovery thrust.
The tell, in real time, is what happens at the pullback low. If SPX loses the 6800 area with VIX expanding, the playbook shifts from “buyable shakeout” to “weaker bear-market analog path.” That’s the line in the sand worth watching.
Until that happens — and history says it usually doesn’t — the base case is constructive.
The Bottom Line
Pulling it all together:
Short-term (next 3-8 sessions): Expect a tactical -2% to -4% pullback. Median timing puts the first leg of weakness in the next 1-2 weeks.
Medium-term (next 4-8 weeks): History favors a rebound from the pullback low into the 7220-7375 zone, with 7440+ possible if the trend reasserts cleanly.
The risk case: A loss of the 6800 area with expanding VIX flips the framework toward the weaker bear-market analog path. Watch that line.
This isn’t about predicting the exact tick. It’s about understanding the field of play. Out of 12 prior rallies of this magnitude, only one — March 2000 — failed to produce a clean rebound after the inevitable pullback. The other 11 went higher. That’s not a coin flip. That’s an edge.
Trade what’s in front of you. Respect the pullback. Don’t fade the rebound.
Until next time—trade smart, stay prepared, and together we will conquer these markets!
Ryan Bailey, VICI Trading Solutions.