

Most of you reading this will never buy a Treasury bond. You’ll never pull up the 10-year yield on a Friday afternoon. You’ll never care what a term premium is or who bought the last 30-year auction.
You’re paying for all of it anyway.
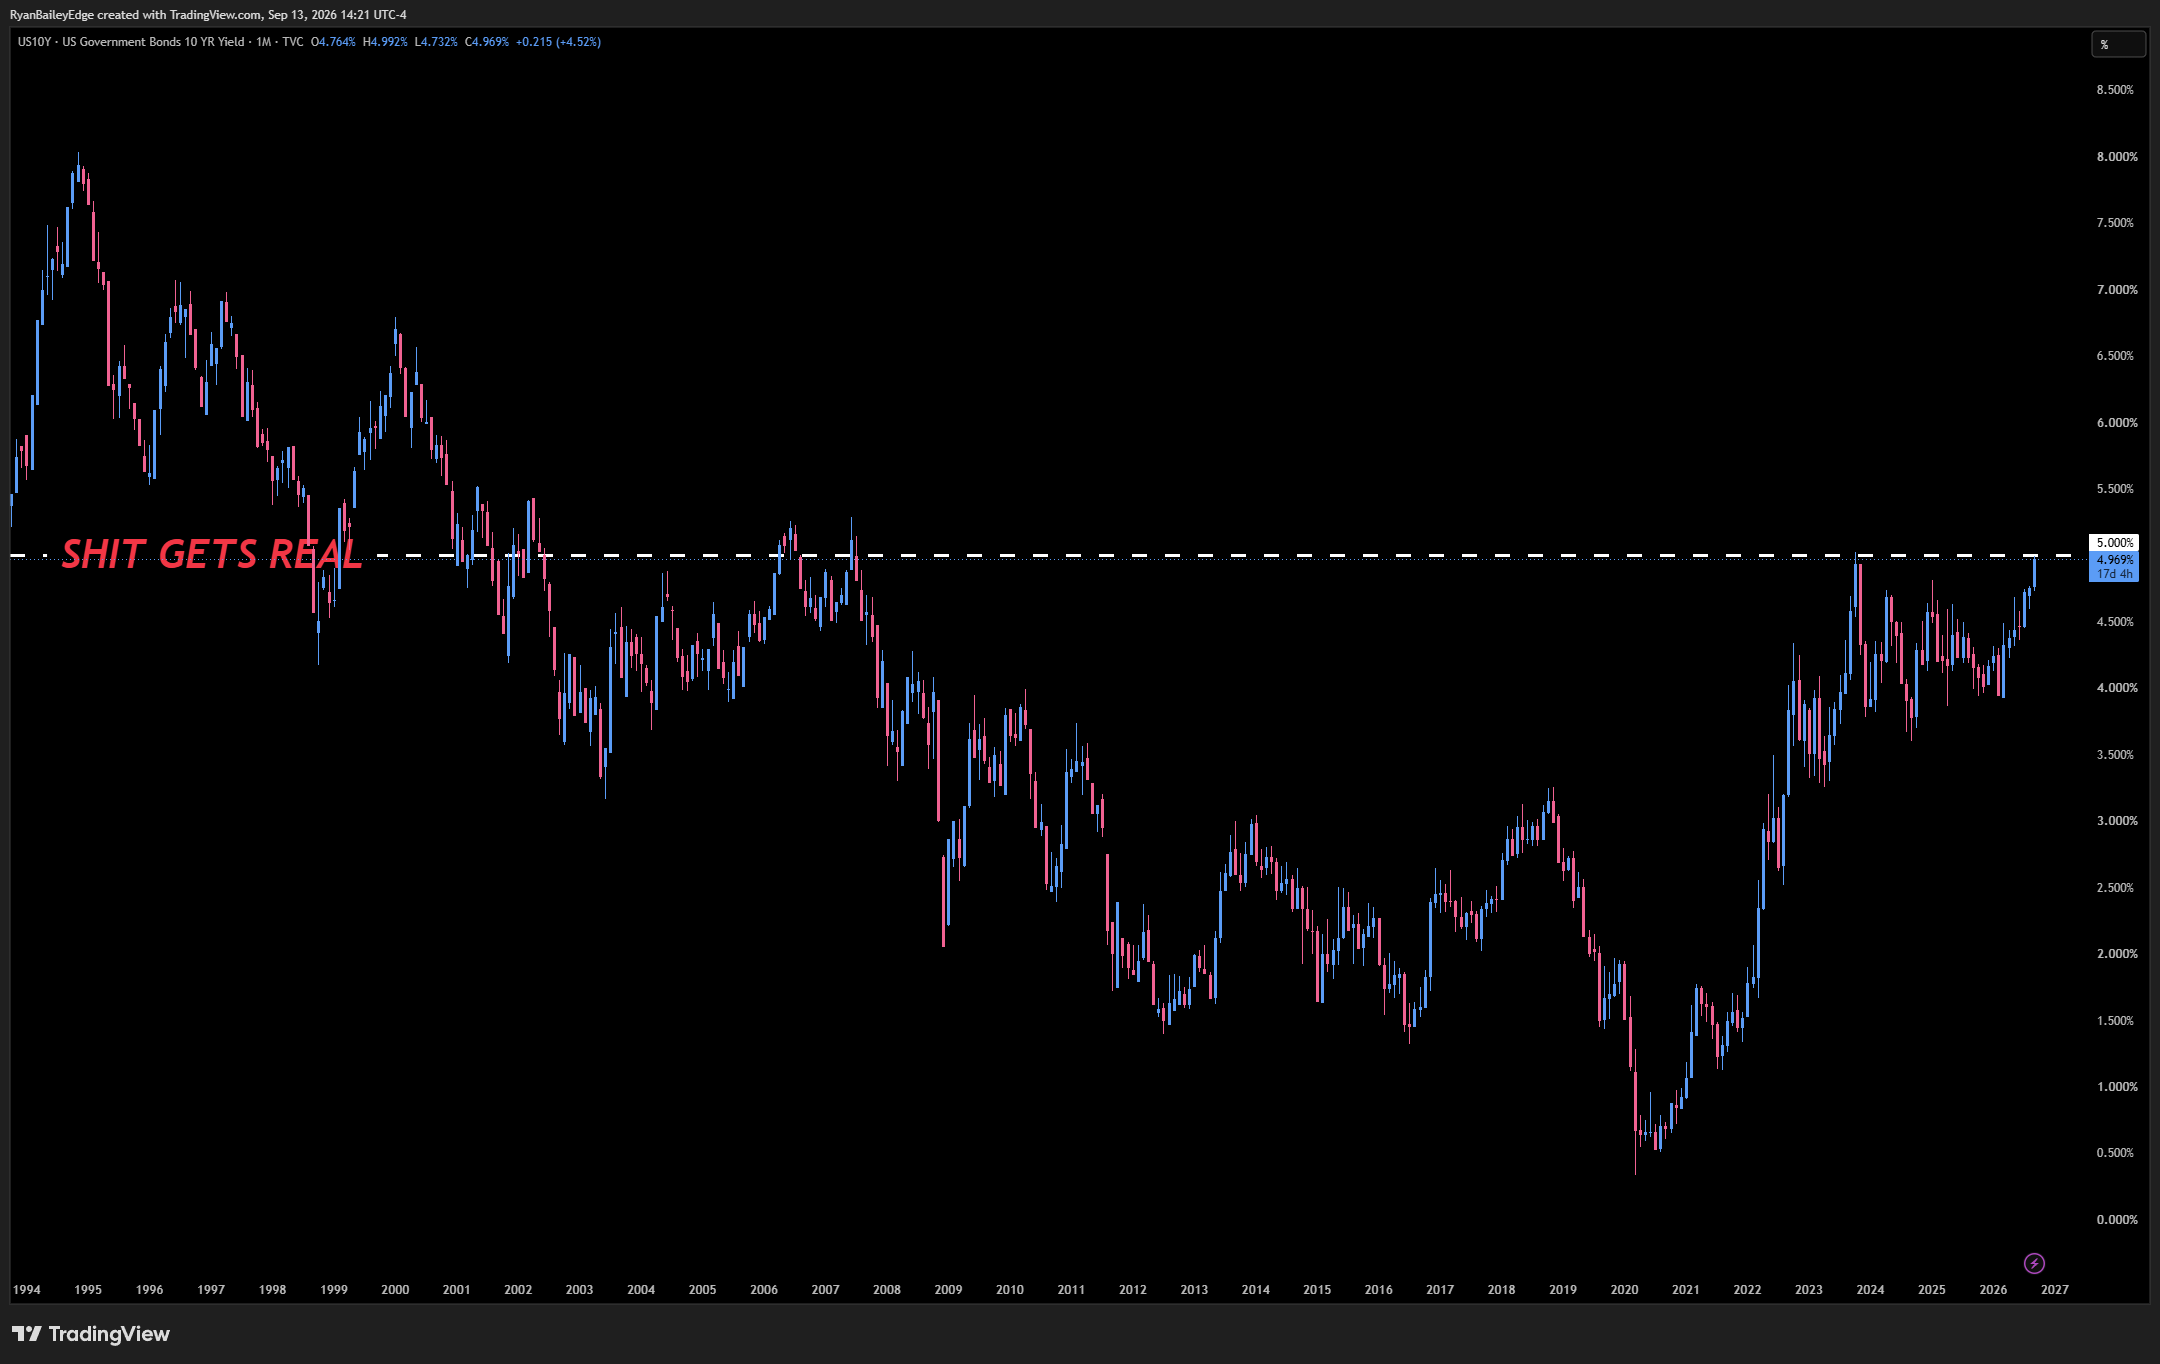
The 10-year closed Friday at 4.955%. The 30-year sits at 5.362% after touching 5.373% on Thursday — the highest that bond has yielded since 2007. Every headline you’ve seen this week is about the 5% line on the 10-year and whether the Fed hikes on Wednesday.
That’s the wrong thing to watch, and it’s the wrong reason to care.
The bond market isn’t forecasting a crash. It’s repricing the cost of everything you finance — and that bill arrives whether or not anything breaks.
Start with what isn’t broken
I want to lead with the counterargument, because the doom version of this story is everywhere right now and most of it doesn’t survive contact with the data.
Core inflation — the measure that strips out food and energy, the one the Fed actually steers by — came in at 2.4% year over year through August. That’s the lowest core reading since March 2021. Shelter inflation, the stickiest component in the entire index, eased to 3.0% from 3.2%.
The volatility complex agrees. The VIX closed Friday at 15.84, down 11.2% on the day. Bond volatility, measured by MOVE, sat at 74.7 — dormant. High yield credit spreads were at 270 basis points as of September 10, which puts them in the richest decile of their entire history against a long-run median closer to 450. Investment grade is near 80. BBB is around 100, in the neighborhood of 25-year tights.
And the buyers are showing up. Last week’s $39 billion 10-year auction drew 2.71 times the paper on offer — the strongest demand since 2019.
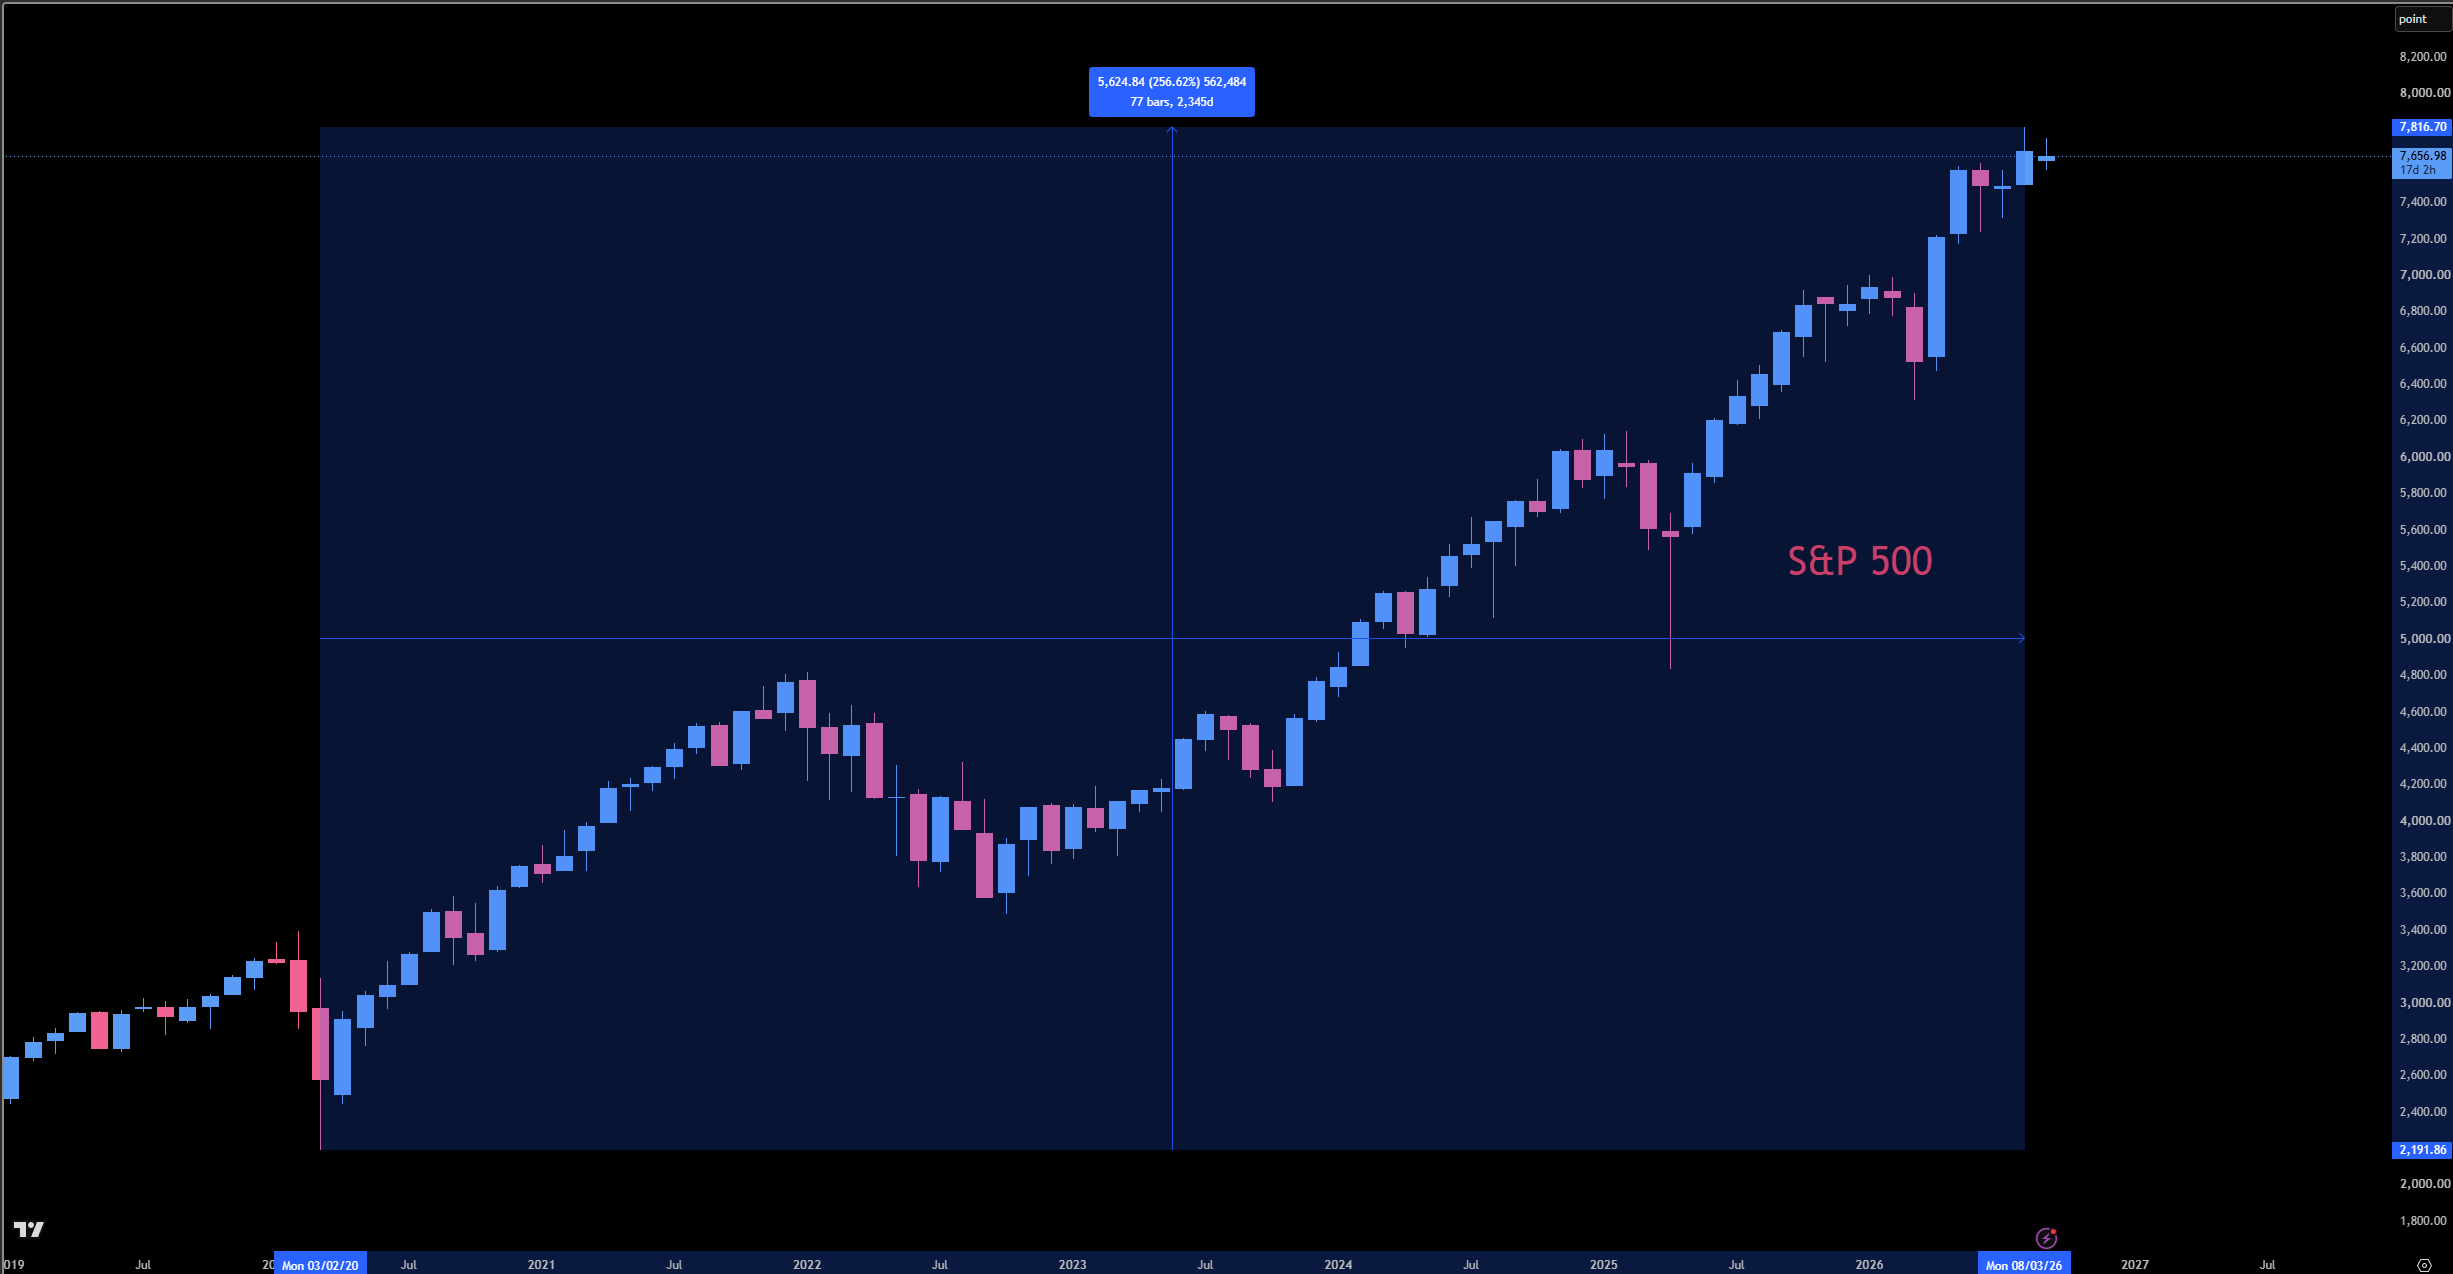
The S&P 500 closed Friday at 7,656.98, roughly 2% under its 52-week high of 7,816.70, after snapping a four-day losing streak. Barclays raised its index target to 7,950.
That is not a market in distress. Anyone telling you the bond market is pricing systemic failure needs to explain why every single gauge that would confirm it is asleep.
So why is the long end screaming?
Here’s the part that actually matters, and it’s the part the “sticky inflation” narrative gets backwards.
Headline CPI held at 3.4% in August, up 0.4% on the month. Gasoline rose 3.9% and accounted for more than a third of that entire monthly increase. Gas is up 27.4% year over year. Fuel oil is up 52%.
Strip the energy out and you get 2.4% — a five-and-a-half-year low.
This isn’t broad inflation reaccelerating. This is an energy shock sitting on top of a disinflating core. Those two things look identical on a headline print and behave nothing alike.
The long end is selling off for reasons that have very little to do with your grocery bill and a lot to do with supply. AI companies have issued north of $1.5 trillion in new corporate debt this year, all of it competing for the same buyers. Pressure on the yen has driven Tokyo to repeatedly sell Treasuries to defend the currency. The Treasury Department tripled its buyback of 10- to 20-year paper to $6 billion — which tells you Washington is actively working to suppress long-end yields, not that it’s succeeding.
The 10-year closed 2026 at its low of 3.961% on February 27. It’s added about a full percentage point since. The old reference everyone is staring at is the October 2023 peak near 5.021%.
Let me be clear about something. The Fed sets the overnight rate. The bond market sets the 10-year. Those are different markets with different buyers, and right now the second one is doing tightening work the first one never authorized.
The price of money, one year apart
The oil shock is the inflation
WTI settled at $100.05 on Friday, down 2.4%. Brent settled at $104.61, down 2.8%. Both still finished the week up roughly 9 to 10% after a wave of US-Iran strikes in the Persian Gulf.
Since the war began at the end of February, WTI is up 52.9%. It’s up 78.5% on the year.
At the pump, that’s $4.15 a gallon nationally. Diesel pushed past $6 for the first time on record — and diesel is the one that matters most, because diesel is a tax on every truck, every train, every barge, every delivery, and every head of lettuce that rides on one.
Now look at what that’s doing inside the equity market, because this is the cleanest evidence in the entire piece.
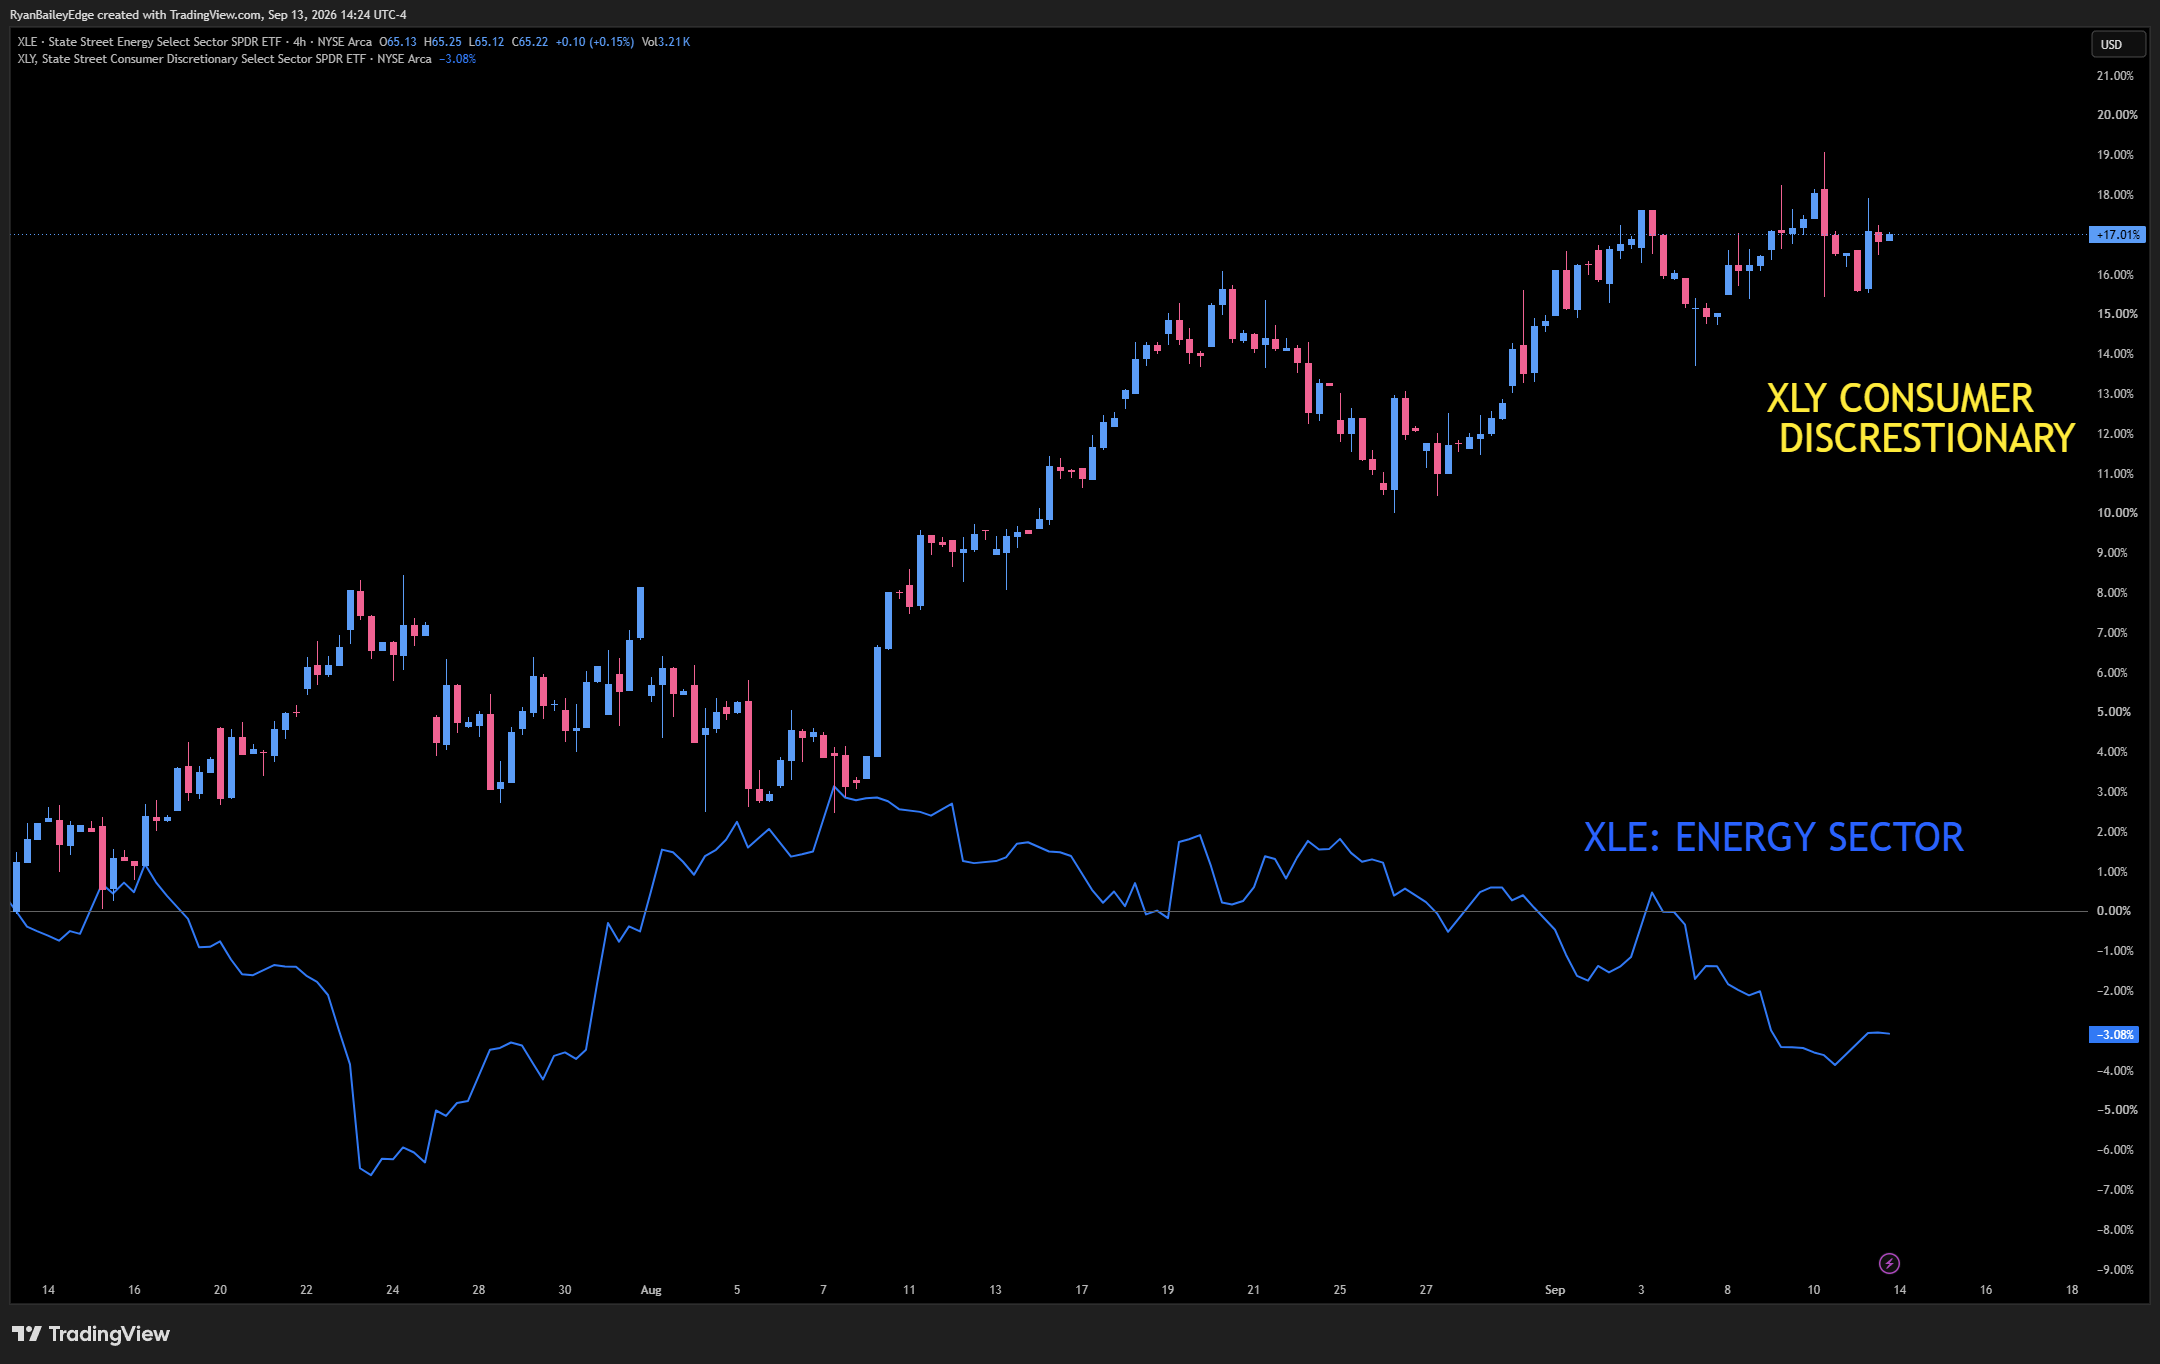
Energy is the only S&P sector up over the past month. It’s up 43% on the year. Consumer discretionary is down 6.5% since mid-August.
That’s not a rotation. That’s a transfer. Money that would have been spent on restaurants, travel, furniture, and cars is going into the tank instead. The market is already pricing the handoff.
Consumers see it too. University of Michigan sentiment printed 47.8, a miss. One-year inflation expectations came in at 4.6%.
And then there’s the piece of data that should make everyone slow down: the IEA cut its global oil demand outlook to a 2.5 million barrel-per-day contraction for 2026 — the largest annual decline since the pandemic. Higher prices and tighter supply are destroying demand. That is stagflationary pressure in print, not in theory.
Now the honest part. This whole setup is one headline away from unwinding. Oil pulled back Friday on reports that Gulf Cooperation Council diplomats are meeting their Iranian counterpart in Oman to discuss a temporary arrangement for Hormuz shipping. Goldman’s scenario of Brent above $120 next year is explicitly not their base case. A credible ceasefire takes the war premium out fast, and the inflation problem largely goes with it.
I’m not going to tell you which way that breaks. Nobody knows. But you should understand that the entire bearish macro case rests on a geopolitical outcome, not an economic one.
What it actually costs you
This is where the abstraction ends.
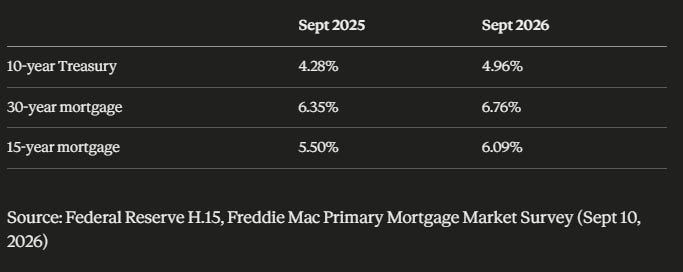
Housing. Freddie Mac put the 30-year fixed at 6.76% for the week ending September 10, up from 6.71% the week before and 6.35% a year ago. The 15-year went to 6.09% from 5.50%.
On a $400,000 loan, principal and interest at 6.76% runs about $2,597 a month. At last year’s 6.35%, that same loan was $2,489. You are paying $108 more every month — $1,296 a year — for the identical house at the identical price.
Against a 3% note from 2021, it’s $1,686 versus $2,597. Nine hundred eleven dollars a month. Over the full term, $534,939 in interest instead of $207,110.
From here, every additional 50 basis points costs roughly $134 a month on that same $400,000.
Here’s why the squeeze feels slow instead of sudden. Your neighbor with the 3% mortgage isn’t paying 6.76% — he’s insulated until he moves. The corporation that locked in 3.5% debt isn’t refinancing until maturity. The damage doesn’t hit on the day the 10-year prints 5%. It hits one borrower at a time, as each one rolls into the new regime. I’ve watched this movie from the floor and from a screen, and the mistake people make every cycle is assuming that because nothing broke this week, nothing is breaking. Duration matters more than the peak.
Cars. Experian put the average new-car APR at 6.39% in Q1 2026, with the average new-vehicle payment at $770. Used cars run 11.43% and $531. On the average new-vehicle loan of about $42,332 over five years, a super-prime borrower at 4.55% pays $790 a month. At the 6.39% average it’s $826. At 11.43% it’s $930. Same car. Different credit file.
Cards. This is the one that moves immediately, because card APRs float. Bankrate’s national average sat at 19.56% in late August. The Fed’s own G.19 data has accounts assessed interest at 21.52%. Average bankcard debt per borrower is $6,519, against $1.25 trillion in total card balances and $18.8 trillion in household debt.
Put those two together and you get the double squeeze. You’re paying more at the pump, and you’re paying 20% on the card you used to cover it.
And the other side. Savers are finally getting paid. T-bills, money market funds, CDs, and newly issued bonds are throwing off real yield for the first time in a generation. A retiree sitting on cash with no debt is winning this environment outright.
Same yield. Opposite outcomes. A 62-year-old with a paid-off house and $400,000 in T-bills and a 28-year-old trying to buy a first home are living in two completely different economies right now, and the only variable separating them is which side of the debt they’re on.
What I’m watching into Wednesday
The FOMC decision lands Wednesday. Markets have roughly 90% priced for a quarter-point hike off the current 3.50% to 3.75% range, which would be the first move of this cycle. Chair Warsh set that repricing in motion at Jackson Hole.
But the Fed decision isn’t the tell. The tell is whether the confirming markets start agreeing with the bond market.
Right now they don’t. The 10-year is near 5% and credit spreads are near record tights. MOVE is at 74.7 and the VIX is under 16. That divergence is the single most important thing on the board. One of those two signals is wrong.
If yields press through 5% and spreads stay pinned, volatility stays dormant, and energy leadership fades as oil cools, that’s the constructive version — the feared level failed to produce stress, and relief tends to be violent.
If the 10-year holds above 5%, the 30-year keeps making new highs, and high yield starts widening while MOVE wakes up — that’s when yields stop being background noise and become the dominant factor in every ES session.
That’s exactly why the 10-year and the 30-year live on the side screen next to the ES levels in the live room every morning before the open. The daily trade plans map where price is likely to react. The macro tells you whether those levels are going to hold when they get there. You need both, and this week you need them more than usual.
The number everyone is watching is 5%. It’s a round number on a screen. It’s not a circuit breaker, it’s not a recession trigger, and it isn’t a policy threshold for anybody.
What it is, is the price of money — and the price of money has gone up about a full point this year while core inflation went down.
Watch the reason, not the level. The level tells you where we are. The reason tells you what happens next.
Until next time—trade smart, stay prepared, and together we will conquer these markets!
Ryan Bailey, VICI Trading Solutions.